Hedera Price Prediction: HBAR Primed for ETF Approval Breakout - Key Levels to Watch

HBAR bulls are charging as ETF speculation reaches fever pitch - and the charts are starting to confirm the hype.
Breaking Through Resistance
Hedera's native token shows textbook bullish consolidation patterns, with technical indicators flashing green across multiple timeframes. The $0.08 level has transformed from resistance to support - a classic sign of institutional accumulation before major catalyst events.
ETF Mania Meets Real Utility
While the crypto space drowns in ETF speculation like teenagers chasing the next meme stock, Hedera's enterprise-grade blockchain continues racking up legitimate adoption. The network's council governance model and energy-efficient consensus give it a regulatory-friendly edge that traditional finance can't ignore.
Market makers are positioning for what could be the most seamless regulatory approval process since Bitcoin's initial ETF wave. Because nothing says 'compliant' like a blockchain actually designed for compliance from day one.
Watch for the breakout above $0.12 - that's when the real FOMO begins.

This development has fueled renewed Optimism among analysts, who see the combination of institutional exposure, rising volume, and bullish chart structures as signals of an impending trend shift.
ETF Approval Speculation Sparks Optimism
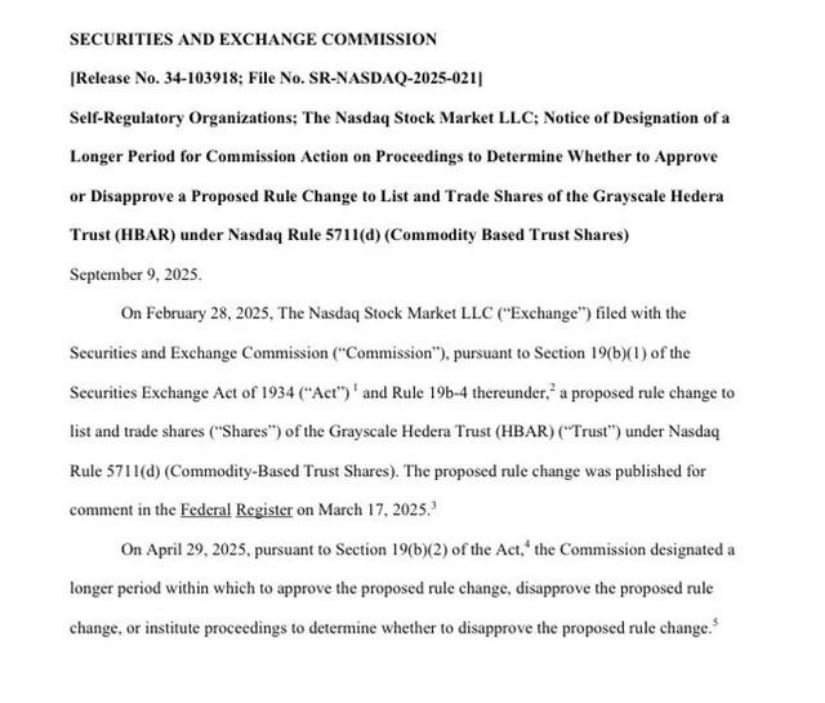
In a recent X post, market analyst ALLINCRYPTO reported that the SEC is reviewing the Grayscale Hedera Trust ETF, with a decision deadline set for November 12. The post added that new listing standards introduced by Paul Atkins could play a pivotal role in the ETF’s potential approval.
The announcement has triggered excitement across the coin community, as ETF approval could open institutional access to the asset and significantly boost liquidity inflows.
Source: X
Adding to the bullish sentiment, analyst Mark referenced a Yahoo Finance report titled “HBAR Price Prediction – Falling Wedge Pattern Hints 150% Upside Amid $44M tokens ETF Inflows.” According to Mark, a decisive daily close above $0.21 WOULD confirm a falling wedge breakout, targeting $0.28, $0.35, and potentially extending toward $0.50.
The ETF reportedly absorbed $44 million in inflows and reached $45.93 million in net assets during its first trading week — a stark contrast to the modest inflows of $719,970 recorded by the Litecoin ETF.
Data Highlights Price Action and Market Metrics
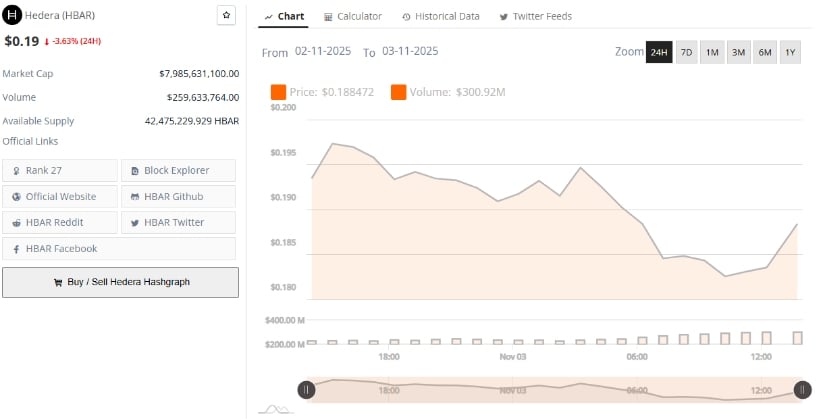
According to BraveNewCoin, Hedera currently trades at $0.19, marking a 3.63% decline over the past 24 hours. The cryptocurrency holds a market capitalization of $7.98 billion and reports a daily trading volume of $259.63 million. Its available circulating supply stands at 42.47 billion tokens, positioning it as the 27th-ranked digital asset by market capitalization.
Source: BraveNewCoin
On the intraday chart, the coin price fluctuates between $0.18 and $0.20, consolidating NEAR its short-term support band. Despite the pullback, overall market participation remains elevated as buyers continue defending the $0.19 zone. Historical data show that each test of this range has been met with renewed demand, reflecting growing confidence among holders anticipating a breakout.
Accumulation Zone and Early Bullish Setup
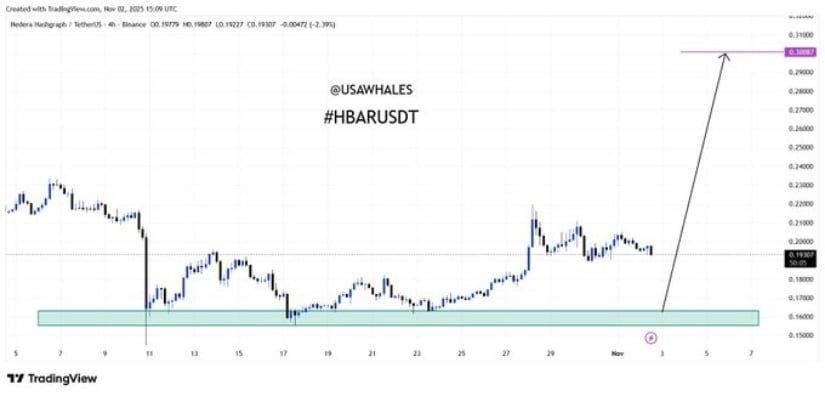
Further supporting the optimistic outlook, analyst USAWHALES noted that HBAR is exhibiting early signs of accumulation, forming a solid base between $0.155 and $0.19 USDT.
Over several weeks, the token has tested this support area multiple times, with each rebound reflecting active buyer interest and “smart money” accumulation. The chart shared by the analyst highlights a recent higher low formation, followed by a strong push from the demand block, a pattern consistent with the early stages of a bullish reversal.
Source: X
From a structural perspective, USAWHALES emphasized that the $0.19 level is not just a psychological line but a reinforced boundary, validated by multiple failed breakdowns and rising volume near the lows. A daily close above $0.22–$0.23 would confirm a trend shift and open the path toward $0.26–$0.30, aligning with Fibonacci extension targets. Conversely, a loss of $0.19 support could invalidate this setup, exposing the price to deeper support around $0.15.
