XLM Ignites Bullish Frenzy: Analysts Target $8 as Stellar Heats Up

Stellar's XLM is sparking intense debate among crypto analysts as bullish momentum builds toward ambitious price targets.
The $8 Question
Technical analysts point to multiple converging factors suggesting XLM could surge toward the $8 mark—a move that would represent staggering gains from current levels. Market sentiment around Stellar has shifted dramatically in recent weeks, with institutional interest growing alongside retail enthusiasm.
Pattern Recognition
Chart patterns show clear bullish formations developing across multiple timeframes. The symmetrical triangle breakout that initially caught analysts' attention has now evolved into what some are calling a 'textbook accumulation phase.' Volume indicators confirm the thesis, with smart money positioning for what could be a parabolic move.
The Skeptics Circle
Not everyone's buying the hype. Traditional finance veterans remain skeptical—because nothing says 'sound investment' like digital tokens named after cosmic phenomena. Yet the technical evidence continues mounting, forcing even conservative analysts to reconsider their positions.
This isn't just another crypto pump story. The fundamentals align with the technicals, creating a perfect storm for potential explosive growth. Whether XLM reaches those lofty targets remains to be seen, but one thing's certain: Stellar is commanding attention in a crowded market.

With technical structures showing long-term accumulation and critical resistance zones nearing, attention now turns to whether the coin can ignite a breakout phase reminiscent of its 2017 rally.
Highlight Show The Coin Could Reach $2 in the current Cycle
In a post shared by crypto GEMs, the analyst confidently claimed, “#XLM going to +$2 this cycle,” sparking widespread discussion among market participants. The statement, supported by a snapshot of current market data, reflects a high-conviction outlook for the coin amid improving sentiment across altcoins.
Source: X
This prediction aligns with broader bullish chatter in the community, where traders argue that the con’s historical performance and increasing adoption potential could justify such an ambitious target. However, others maintain a more cautious stance, emphasizing the need for broader market strength and fundamental catalysts to support sustained gains. Despite differing opinions, the engagement surrounding the crypto underscores renewed attention toward the asset as it tests crucial technical thresholds heading into November.
Market Data Shows Steady Price Performance
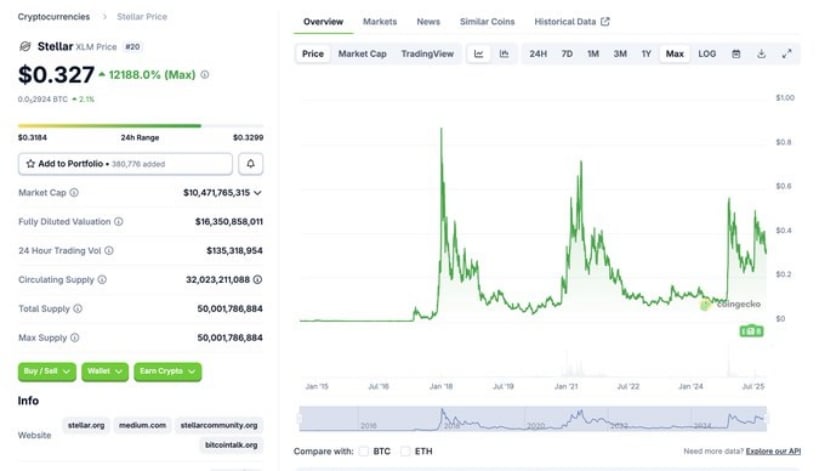
According to BraveNewCoin, stellar trades at $0.33, marking a 1.53% increase over the past 24 hours, with a market capitalization of $10.59 billion and a daily trading volume of nearly $194.7 million. Ranked 20th globally, the asset’s steady climb from its October lows has helped it regain a position of relative stability in the altcoin sector.
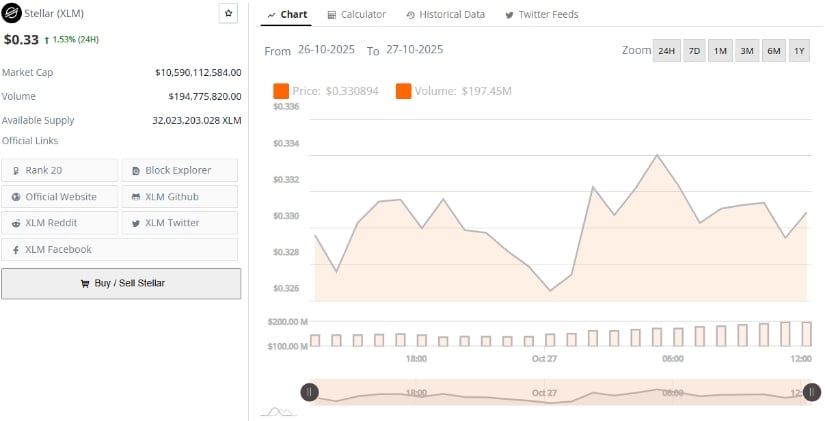
Source: BraveNewCoin
Recent trading patterns show price consolidation between $0.32 and $0.34, suggesting that buyers are accumulating within this range before a possible breakout attempt.
Analysts note that if buying volume continues to expand, the asset could challenge the $0.45–$0.50 resistance zone, a critical level that has capped rallies since early 2022. Sustained movement above this region WOULD significantly improve market structure and validate projections that place the crypto’s medium-term targets near $2.
Technical Charts Indicate Fibonacci Extension Toward $8
Technical analyst ChartNerd shared a long-term chart identifying Fibonacci extension targets between $2.42 and $8.32, anchored on an extended bullish breakout scenario. The analysis compares the current structure to Stellar’s 2017 explosive rally, noting an ascending triangle formation that continues to build higher lows against a multi-year resistance. If the coin breaks and closes above $0.50 on the monthly chart, the MOVE could initiate a new price discovery phase, validating these Fibonacci-based targets.
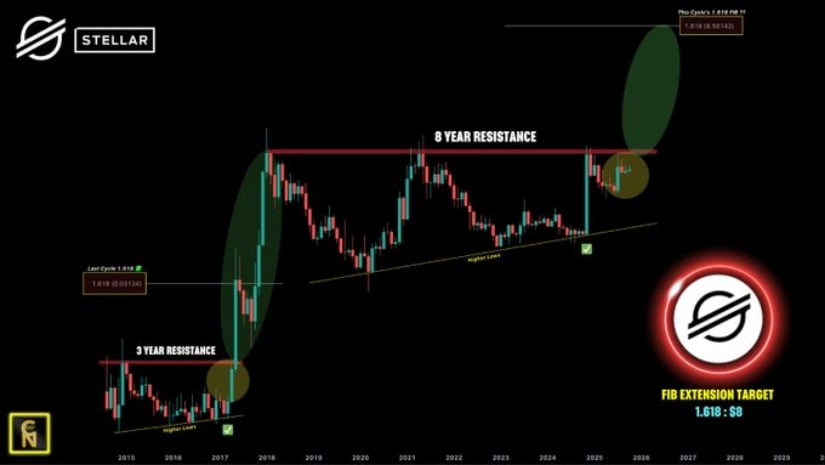
Source: X
At the time of writing, the token trades near $0.33, maintaining key support around $0.32–$0.35. The analyst emphasizes that this support must hold for the bullish case to remain intact. A clean breakout above $0.50 would confirm the momentum shift, while failure to sustain current levels could trigger a retracement toward the lower trendline. Though the $8 projection sits at the higher end of speculative targets, it captures the long-term optimism surrounding the coin’s potential should broader crypto market conditions align favorably.
