Uniswap Price Alert: UNI Battles at $7.49 With Critical $7.18 Support Looming

UNI faces its moment of truth as key technical levels come into play.
The Pressure Cooker
Uniswap's native token dances dangerously close to its make-or-break zone. Bulls defend the $7.49 level while bears eye the $7.18 support like sharks circling wounded prey. One false move could trigger cascading liquidations across leveraged positions.
Market Mechanics at Work
Volume patterns suggest institutional players are accumulating at these levels—smart money knows decentralized exchange tokens represent the future of finance. Meanwhile, retail traders panic-sell at the first sign of turbulence, proving once again that emotional decisions cost more than transaction fees.
The Bottom Line
Watch the $7.18 level like a hawk. If it holds, we're looking at a springboard for the next leg up. If it breaks... well, let's just hope your stop-loss is tighter than a traditional banker's grip on outdated financial systems.

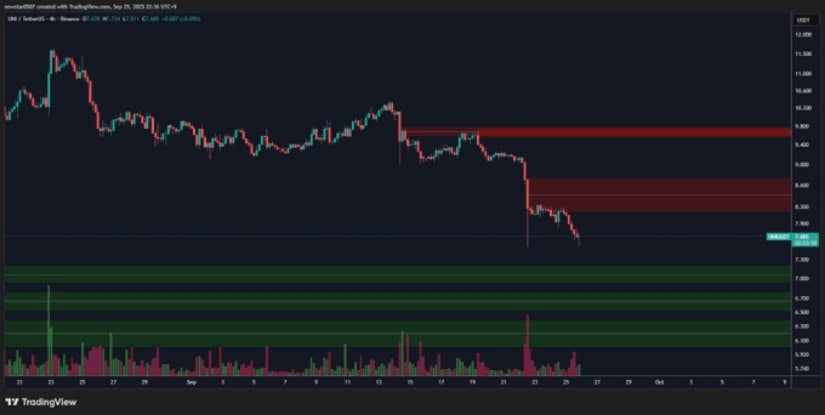
The rejection at higher zones has left bulls on the defensive, and sellers remain firmly in control of the short-term outlook. At $7.49, the token is hovering just above a key support band that will determine whether the current slide stabilizes or accelerates toward deeper demand zones.
Sellers Dominate Short-Term Outlook
The UNI/USDT chart shows a decisive bearish breakdown, with lower highs forming since price failed to sustain momentum in the $10.00–$12.00 range. Attempts to reclaim supply zones in the $8.20–$8.50 band have been unsuccessful, underscoring fading bullish conviction.
These repeated rejections leave the market vulnerable, with $7.18 identified as the next critical liquidity wall where buyers are expected to defend aggressively.
Source: X
If this support holds, the coin could stage a rebound, potentially retesting resistance NEAR $8.20. Market analysts suggest that high-volume activity around this level signals accumulation by larger players, who may be preparing for a short-term countertrend rally.
However, if $7.18 fails, the risk of a breakdown into the $6.50–$6.80 range grows significantly, where the next pool of demand lies. The balance between these zones will likely decide whether the token stabilizes for a bounce or continues its decline deeper into bearish territory.
Market Data Reflects Ongoing Pressure
Additional data from BraveNewCoin provides a chart of the current landscape. The crypto is trading at $7.49, reflecting a daily decline of 5.58%, with a market capitalization of $4.48 billion. Trading volume over the past 24 hours stands at $373 million, indicating strong activity but skewed toward selling rather than buying.
The asset ranks #42 globally, with a circulating supply of just over 600 million tokens, reinforcing its position as a leading DeFi asset despite ongoing weakness.
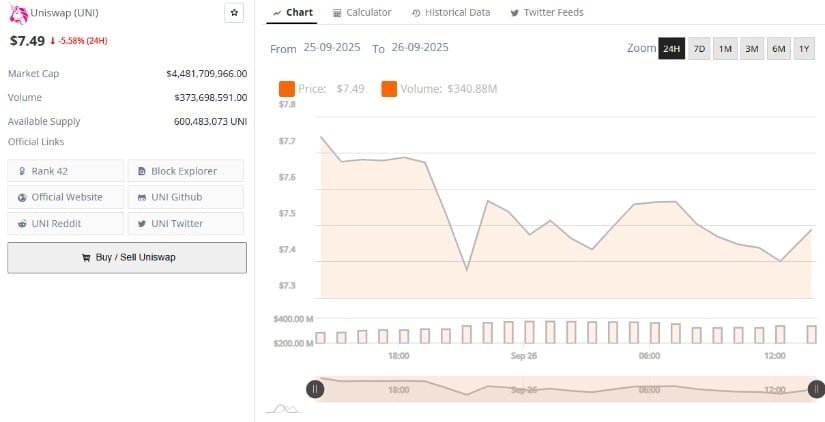
Source: BraveNewCoin
Liquidity remains healthy, but the lack of bullish follow-through raises concerns. While volume inflows suggest traders are actively engaging with UNI, the prevailing bias remains negative. Analysts point out that stability above $7.20 is essential to prevent the token from drifting into lower support levels that could trigger broader capitulation.
Indicators Highlight Bearish Momentum
On the other hand, technical readings add further weight to the bearish picture. The MACD indicator shows a confirmed bearish crossover, with the MACD line at -0.565 trailing below the signal line at -0.360, accompanied by a negative histogram of -0.205.
This setup illustrates that selling momentum outweighs buying strength, and no bullish divergence has yet appeared to suggest a reversal is imminent. Traders often interpret this as a continuation signal, implying that downside risks remain until the MACD curve begins to flatten or cross back upward.
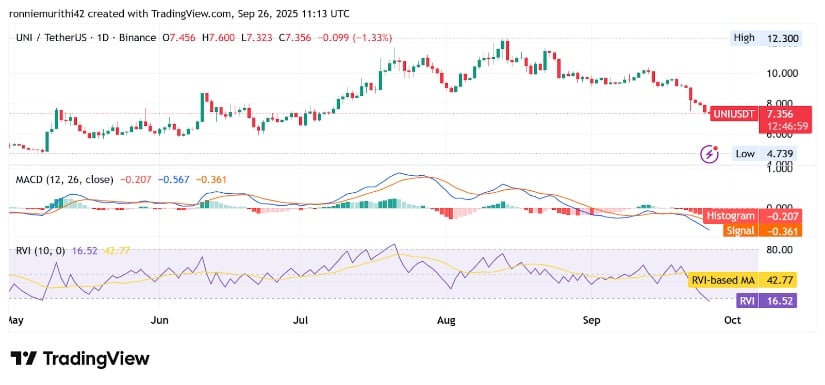
Source: TradingView
The Relative Vigor Index (RVI) paints a similar story, registering at 16.53 compared to its moving average of 42.77. Such depressed readings typically signal oversold conditions but also highlight extreme weakness in bullish conviction.
While oversold levels can sometimes trigger relief rallies, the lack of strong recovery signals suggests that the coin may remain under pressure in the near term. Only a sustained move back above $7.50, followed by a break of $8.20, WOULD begin to shift the tone toward stabilization.
