Bitcoin’s Technical Outlook Remains Neutral Despite Improving Momentum - Here’s What’s Really Happening

Bitcoin's charts show momentum building—but the big picture hasn't shifted yet.
### The Neutral Zone Holds Firm
Technical indicators keep flashing yellow, not green. Momentum's picking up—trading volume spikes, support levels hold—but the overall structure refuses to tip bullish. It's a market stuck in a high-stakes waiting game.
### Momentum's Quiet Comeback
Behind the flatlining price action, something's stirring. Short-term buyers are testing resistance, pushing the envelope without breaking through. Each failed rally builds pressure—like coiling a spring.
### The Trader's Dilemma
This isn't indecision—it's equilibrium. Bulls and bears have dug trenches at key levels, creating a stalemate that defies both panic and euphoria. The market's holding its breath, waiting for a catalyst that hasn't arrived.
### Why Neutral Isn't Nothing
In crypto, sideways action often precedes explosive moves. This consolidation period shakes out weak hands and builds foundations—the boring work that makes rallies sustainable. Forget moon shots; watch for the base.
### The Verdict: Prepare, Don't Predict
Improving momentum without directional conviction creates opportunity—for those who don't confuse activity with progress. Remember: Wall Street spends billions predicting markets that still surprise them daily. Bitcoin's next move will come when it's ready, not when charts say it should.

The price of Bitcoin has fallen beneath $90,000, along with the 100-hour simple moving average. The price could potentially rise once more if the buyers maintain their momentum.
At the $90,000 mark, we are encountering significant resistance. The $90,500 mark represents the first significant hurdle to overcome. On the hourly chart of the BTC/USD pair, a bearish trend line is emerging, with resistance positioned at $90,650.
TradingView's Market analysis tools:
- The hourly MACD is currently picking up momentum in the positive territory.
- Hourly RSI (Relative Strength Index) – The relative strength index for BTC/USD has currently surpassed the 50 threshold.
- Key Support Levels – $88,550, then $88,000.
- Key Resistance Points – $90,000 and $90,500.
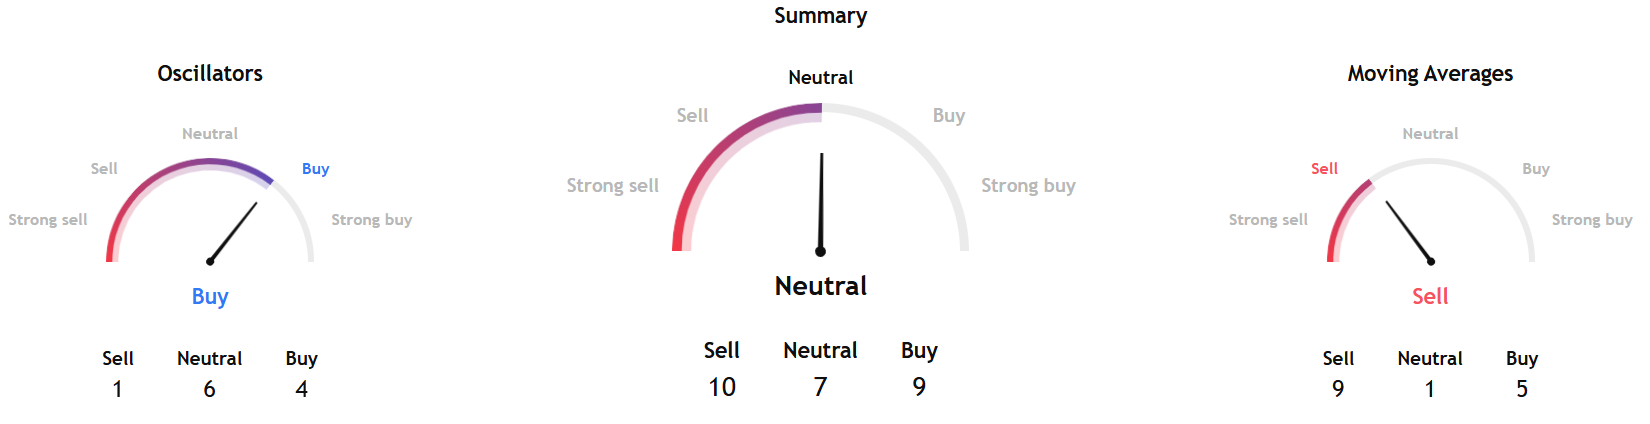
TradingView's overall bitcoin Technical Analysis gauge, based on the summary, is based on the most popular indicators, such as moving averages, oscillators, and pivots, and points to a neutral signal for the coming week.
Separately, InvestTech's Algorithmic Overall Analysis and recommendation for one to six weeks pointed to a hold signal.
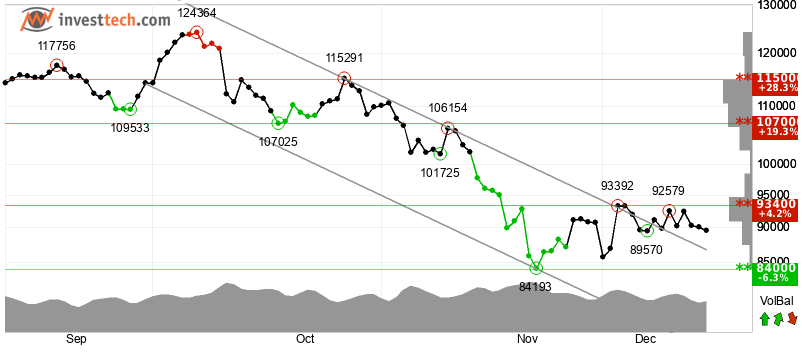
Investech said, "Bitcoin has broken through the ceiling of a falling trend channel in the short term. This indicates a slower falling rate initially, or the start of a more horizontal development. The token has support at $84,000 and resistance at $93,400."
The firm added, "Positive volume balance shows that volume is higher on days with rising prices than on days with falling prices. This indicates increasing Optimism among investors. The token is overall assessed as technically neutral for the short term."
➢ Stay ahead of the curve. Join Blockhead on Telegram today for all the latest in crypto.+ Follow Blockhead on Google News