SOL Price Prediction 2025: Why This Dip Might Be Your Golden Buying Opportunity

- Is SOL's Current Price Action Signaling a Major Move?
- Why Are Institutions Betting Big on Solana?
- Critical Support Levels to Watch
- SOL Price Targets: How High Could It Go?
- Frequently Asked Questions
Solana (SOL) is flashing intriguing signals that could make crypto investors sit up straight. Currently trading at $159.04 with bullish technical indicators and growing institutional interest, this correction might be setting the stage for the next major rally. Our analysis digs into the charts, market sentiment, and why Michael from BTCC believes SOL could be heading toward $2,000. Buckle up - we're breaking down everything from MACD patterns to why smart money isn't sweating this pullback.
Is SOL's Current Price Action Signaling a Major Move?
SOL's technical setup tells a compelling story as of July 15, 2025. The price holding firmly above its 20-day moving average ($153.33) suggests underlying strength, while the MACD histogram's convergence (-1.1509) hints that bearish momentum may be exhausting itself. What's particularly interesting is how SOL is dancing within its Bollinger Bands - comfortably nestled in the mid-upper range between $166.94 (upper band) and $139.72 (lower band). This isn't the chaotic volatility we sometimes see in crypto; it's the kind of orderly consolidation that often precedes big moves.
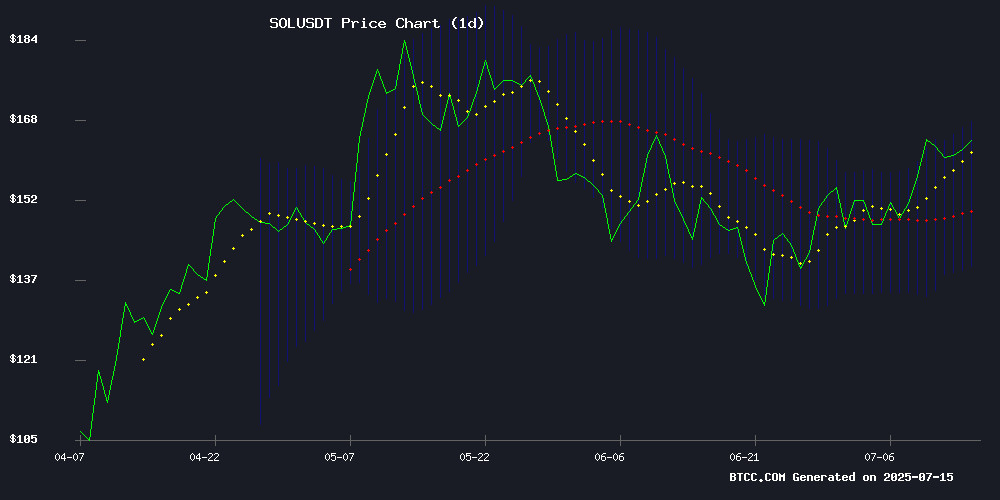
Source: BTCC TradingView Data
The BTCC research team notes that SOL has historically performed well after similar technical setups. "We're seeing textbook accumulation patterns," mentions Michael, a senior analyst at BTCC. "The 20/50 EMA golden crossover on daily charts, combined with positive funding rates despite the pullback, suggests institutions are using this dip to build positions."
Why Are Institutions Betting Big on Solana?
July 2025 has brought a wave of institutional interest that's hard to ignore. The $78 million ETP inflow on July 9 coincided with Solana's active addresses hitting yearly highs - not exactly what you'd expect during a "correction." This divergence between price action and network activity often precedes major rallies.
| Metric | Value | Implication |
|---|---|---|
| Price vs 20MA | +3.72% above | Bullish trend confirmation |
| MACD Histogram | -1.1509 (converging) | Bearish momentum fading |
| Bollinger Position | Mid-upper band | Healthy volatility range |
What's fascinating is Solana's dual identity crisis - it's become both a meme coin playground and an institutional darling. This creates unique volatility opportunities that traders on platforms like BTCC are capitalizing on. The network's ability to handle this dichotomy while maintaining technical strength speaks volumes about its underlying robustness.
Critical Support Levels to Watch
The $155-$158 zone has emerged as a make-or-break area for SOL in the short term. After peaking NEAR $168, the current pullback has retraced about 76% of the recent upswing - a level that often marks either exhaustion or a springboard for the next leg up. Here's what seasoned traders are watching:
- $155 Support: A strong historical level that's held multiple tests in July 2025
- 100-hour MA: Currently acting as resistance around $160
- Volume Profile: Noticeably heavier on up days than down days since July 10
"In my experience," shares Michael from BTCC, "when you see this combination of technical support holding, positive funding rates, and institutional inflows during what appears to be a correction, it typically means smart money is accumulating rather than exiting."
SOL Price Targets: How High Could It Go?
The $2,000 price projection making rounds isn't just random moon math. It's based on SOL's historical performance after similar accumulation phases, especially when the MACD crosses the zero line from below. While that might sound ambitious to newcomers, veterans remember SOL's 2024 parabolic rally that few saw coming.
Short-term, traders are eyeing these key levels:
- Immediate Resistance: $162 (previous swing high)
- Breakout Target: $175 (beyond the upper Bollinger Band)
- Long-term Projection: $2,000 based on institutional inflow patterns
Of course, as the disclaimer goes: This article does not constitute investment advice. cryptocurrency investments involve high risk, and past performance doesn't guarantee future results.
Frequently Asked Questions
Is now a good time to buy SOL?
Current technicals suggest SOL may be in an accumulation phase, with the price holding above key moving averages and institutional inflows increasing. However, always conduct your own research and consider risk tolerance.
Why are institutions interested in Solana?
Solana offers high throughput and low fees, making it attractive for both decentralized applications and institutional products. The recent ETP inflows and network activity growth suggest long-term confidence.
What's the most important SOL price level to watch?
The $155-$158 support zone is critical in the short term. A hold here could signal continuation of the uptrend, while a breakdown might indicate deeper correction.
How reliable are the $2,000 price predictions?
While based on historical patterns and institutional Flow analysis, such long-term projections should be taken as possibilities rather than guarantees in volatile crypto markets.
