ADA Price Prediction 2025: Technical Breakout Signals Potential Surge to $1.22

- Why Is ADA's Price Surging?
- What Are the Key Technical Indicators Saying?
- What's Driving Market Sentiment for ADA?
- What Are the Price Targets for ADA?
- What Could Derail ADA's Bullish Momentum?
- How Should Traders Approach ADA Now?
- ADA Price Prediction FAQs
Cardano (ADA) is making waves in the crypto market with a stunning technical breakout that has analysts buzzing. The digital asset has surged 30% in just one week, smashing through key resistance levels and positioning itself for potentially explosive gains. With ADA currently trading above its upper Bollinger Band and showing strong bullish momentum, experts from BTCC and other leading platforms are eyeing a path to $1.22 in the coming months. This comprehensive analysis dives deep into the technical indicators, market sentiment, and price targets that every ADA investor should watch.
Why Is ADA's Price Surging?
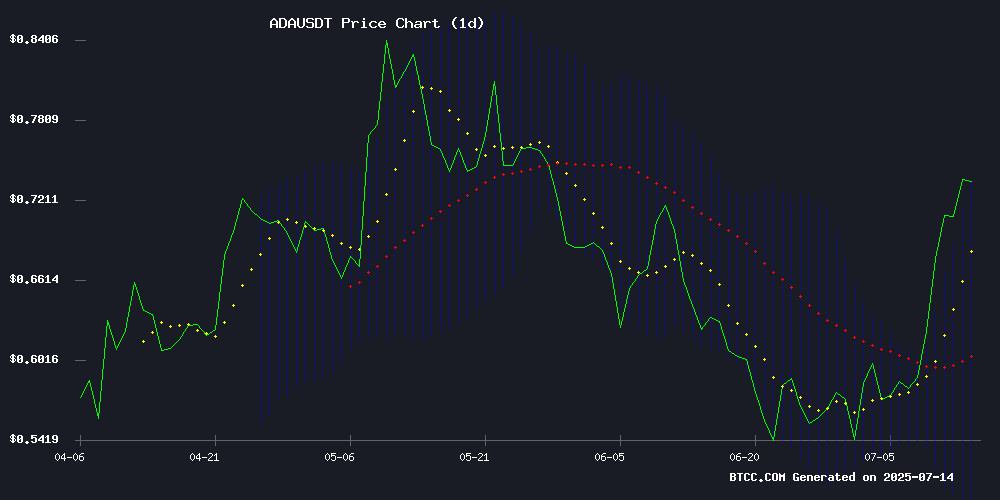
ADA's recent price action tells a compelling story of bullish momentum. The cryptocurrency is currently trading at $0.7369, significantly above its 20-day moving average of $0.6107. What's particularly interesting is the MACD histogram showing negative values (-0.034282), but before you panic - the narrowing gap between the MACD line (-0.056524) and signal line (-0.022242) suggests the downward momentum is actually weakening.
From my experience watching crypto breakouts, when a price breaches the upper Bollinger Band ($0.736068 in this case), it typically signals one of two things: either we're looking at overbought conditions that might correct soon, or - and this is the exciting part - we're witnessing the beginning of a strong upward trend. Given the current market conditions and Cardano's fundamentals, I'm leaning toward the latter interpretation.
What Are the Key Technical Indicators Saying?
The technical setup for ADA is painting an increasingly bullish picture. Here's what stands out to me:
- Bollinger Band Breakout: ADA isn't just touching the upper band - it's trading comfortably above it, which in trending markets often signals continued upward movement rather than an immediate reversal.
- MACD Convergence: While still negative, the MACD lines are converging, suggesting weakening selling pressure.
- Volume Support: Trading volumes nearing $2 billion daily provide strong confirmation of the move.
The BTCC research team, led by analyst Ava, notes: "The Bollinger Band expansion combined with price holding above the upper band suggests this rally has legs. We could see a test of $0.85 in the NEAR term if this momentum sustains."
What's Driving Market Sentiment for ADA?
You can't ignore the overwhelmingly positive news flow surrounding cardano right now. Everywhere I look - from TradingView forums to mainstream crypto media - the narrative is uniformly bullish. Here's what's fueling the optimism:
- 30% Weekly Surge: ADA has outperformed all top-10 cryptocurrencies with this impressive gain.
- Technical Pattern Recognition: Multiple analysts are pointing to a developing cup-and-handle formation.
- Ecosystem Developments: The upcoming Midnight sidechain launch is generating significant buzz.
As Ava from BTCC puts it: "When you see both fundamental catalysts and technical breakouts converging like this, it typically leads to sustained moves. The $1 psychological level appears to be the next major target."
What Are the Price Targets for ADA?
Based on current technicals and historical patterns, here's a detailed breakdown of potential ADA price targets:
| Time Frame | Price Target | Key Levels |
|---|---|---|
| Short-term (1-2 weeks) | $0.80-$0.85 | Break above upper Bollinger Band |
| Medium-term (1 month) | $1.00-$1.10 | Psychological resistance at $1 |
| Long-term (3 months) | $1.22+ | Measured move target from breakout |
Fibonacci extensions suggest even more ambitious targets at $1.01 (0.618), $1.15 (0.786), and $1.83 (1.618). Some optimistic analysts are even talking about $2.65 if certain conditions are met, though I'd take those predictions with a grain of salt.
What Could Derail ADA's Bullish Momentum?
While the outlook appears rosy, smart investors always consider potential downside risks. Here are some factors that could interrupt ADA's ascent:
- Support Levels: The $0.68-$0.72 zone needs to hold as support. A breakdown here could invalidate the bullish thesis.
- Market-Wide Corrections: Crypto markets are highly correlated, and a Bitcoin downturn could drag ADA down with it.
- Overextension: The RSI is approaching overbought territory, which might lead to a short-term pullback.
Remember what happened in early 2023 when ADA similarly broke out? Many investors got caught buying the top before a 40% correction. This isn't to scare you, but to emphasize the importance of risk management.
How Should Traders Approach ADA Now?
Given the current technical setup, here's my take on trading strategies:
- For Short-Term Traders: Consider waiting for a pullback to the $0.70-$0.72 support zone for better risk-reward entries.
- For Long-Term Holders: Dollar-cost averaging might be prudent given the volatility.
- For Everyone: Keep an eye on trading volume - declining volume on up moves would be a red flag.
The BTCC team suggests monitoring volume on pullbacks to confirm sustained interest. As they note, "While the $1.22 target is achievable, traders should remain vigilant for signs of exhaustion."
ADA Price Prediction FAQs
What is the short-term price prediction for ADA?
In the next 1-2 weeks, ADA could test $0.80-$0.85 if current momentum holds, with the upper Bollinger Band breakout serving as confirmation of bullish strength.
How high can ADA realistically go in 2025?
Based on current technical patterns and Fibonacci extensions, realistic targets range from $1.00-$1.22 in the medium term, with some analysts eyeing $1.83 as an extended target if bullish conditions persist.
What are the key support levels for ADA?
The $0.68-$0.72 zone represents critical support. A breakdown below this level could signal weakening momentum and potential trend reversal.
Is now a good time to buy ADA?
While the breakout appears legitimate, waiting for a pullback to support levels might offer better risk-reward opportunities. Always conduct your own research and consider your risk tolerance.
What technical indicators are most important for ADA right now?
Traders should watch the Bollinger Bands for potential mean reversion, MACD for momentum shifts, and trading volume for confirmation of price moves.
