Dormant Bitcoin Stirs: 1,401 BTC (Aged 2-3 Years) Awakens Overnight Amid Market Selloff

Sleeping giants don't just wake up for no reason.
Bitcoin's Ancient Coins on the Move
While traders panicked over yesterday's dip, something more interesting happened in the depths of the blockchain. A cluster of 1,401 BTC—untouched for two to three years—suddenly stirred from digital slumber.
Timing Speaks Volumes
These coins moved precisely when weak hands were dumping. Coins this old belong to veterans who survived multiple cycles. Their movement during volatility suggests strategic positioning, not panic selling.
Market Mechanics in Play
Long-term holders activating during selloffs often precedes local bottoms. Their patience contrasts sharply with Wall Street's quarterly obsession—where 'long-term' means until next earnings call.
Watch the whales, not the waves. While traditional finance frets over basis points, Bitcoin's old guard just made a calculated move that could signal the next chapter.
Long-Term Holder Activity Adds Pressure to Bitcoin
Darkfost’s analysis highlights that Bitcoin’s long-term holders (LTHs) remain active, even as the pace of their coin movements has slowed compared to previous months. This ongoing activity underscores a critical dynamic in the market: supply from experienced holders is still finding its way into circulation, influencing price action.
A closer look at the younger LTH cohort, defined as those holding coins between six and twelve months, illustrates this clearly. Since the beginning of September, this group has executed 10 notable transfers, with each transaction ranging between 8,000 and 9,000 BTC. On average, that amounts to roughly 8,500 BTC per move. With bitcoin priced near $115,000 during this period, the selling pressure translates into approximately $10 billion introduced into the market within just a few weeks.

This level of distribution carries significant implications. While such selling pressure can dampen immediate upward momentum, it also reflects a normal stage in the market cycle where coins purchased at higher levels mature and transition into LTH status. The challenge arises when this supply coincides with heightened uncertainty or corrective phases, as seen in recent sessions.
Adding to the complexity, altcoins continue to trade in close correlation with Bitcoin. Despite narratives of diversification, the broader market has yet to fully decouple from BTC’s dominance. As a result, when long-term holders sell, triggering a downside in Bitcoin, altcoins often follow suit, amplifying the volatility.
Ultimately, LTH movements highlight a tug-of-war between profit-taking and new inflows. While this creates near-term headwinds, the absorption of supply by fresh demand will determine whether Bitcoin can stabilize and push higher in the coming weeks.
Price Faces Heavy Pressure At $112K
The 8-hour Bitcoin chart shows clear signs of weakness after bulls failed to hold the $115K support, with price now trading around $112,523. The breakdown followed sustained selling pressure, in line with recent on-chain data pointing to long-term holders moving coins into circulation.
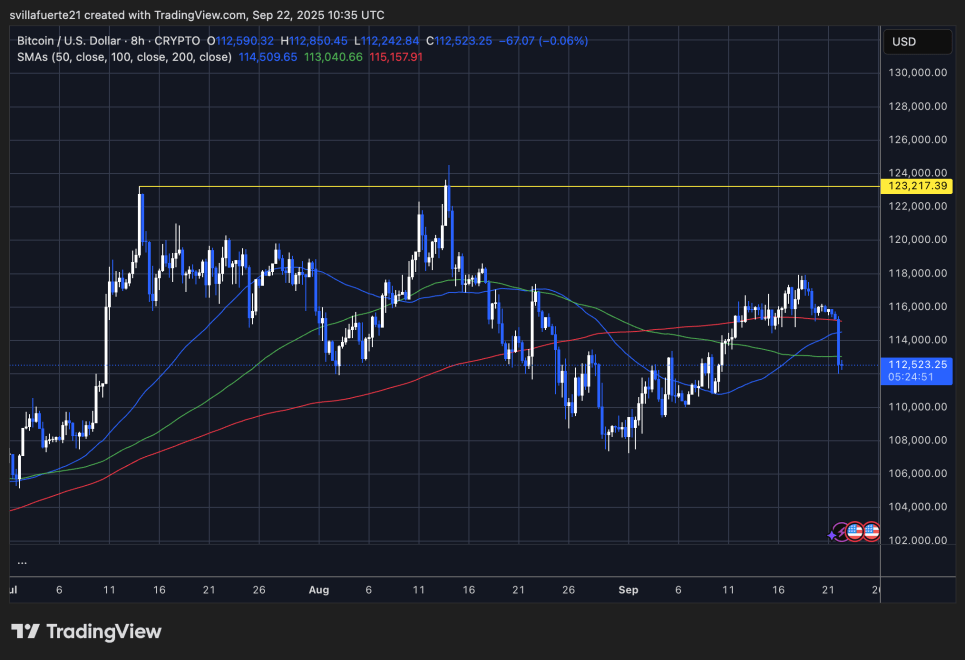
Technically, Bitcoin has slipped below both the 50-SMA ($114,509) and the 100-SMA ($113,040), confirming a bearish shift in momentum. The 200-SMA at $115,157, which previously acted as strong support, now flips into resistance. Unless BTC reclaims this area quickly, the path of least resistance remains to the downside.
The rejection NEAR $117K earlier in the week also adds weight to the bearish case, showing that buyers lacked strength to push toward the $123K resistance. Immediate support lies around the $111K–$112K region, which coincides with prior consolidation levels from early September. A decisive break below could open the door to a deeper correction toward $108K.
Despite the bearish short-term outlook, the broader structure remains intact as long as BTC holds above the summer lows near $105K. For now, traders will be watching if bulls can defend current levels and stage a rebound, or if sellers drive the market further into correction territory.
Featured image from Dall-E, chart from TradingView
