Bullish Continuation Setup Predicts Ethereum Price Surge to $6,500 - Here’s the Timeline

Ethereum's chart just flashed its most aggressive bullish signal in years—and the target screams $6,500.
Patterns Don't Lie
A textbook continuation setup broke out above critical resistance, confirming the next leg up. Volume confirms institutional accumulation—smart money isn't just dipping toes; they're diving in headfirst.
Timing the Ascent
Expect the climb to accelerate through Q4, with the $6,500 target looking achievable by early 2026. Key moving averages align perfectly—no flukes, just pure momentum.
Of course, traditional finance pundits will call it speculative madness right up until their own funds quietly allocate 5% to 'digital gold.' Some things never change—neither does Wall Street's timing.
Ethereum Price Remains On The Side Of The Bulls
The recent drawdown, while having beaten the Ethereum price by around 10% since then, has not turned the price action bearish. If anything, crypto analyst HAMED_AZ believes that it is a healthy correction that is helping the altcoin to get ready for the next bullish phase.
One thing that stands out is that the drawdown has led to a corrective phase instead of a freefall. This suggests that the pullback is healthy for the digital asset and is rather bullish, especially as the ethereum price has continued to maintain an important support zone above $4,100.
With the current corrective phase, the crypto analyst explains that the Ethereum price is now forming a bullish flag pattern. A bullish flag pattern is a continuation pattern that is notoriously known to form after a fast price increase, followed by a brief correction. The last part of the bullish flag pattern is the breakout, and doing so with volume puts the digital asset at a unique advantage to continue its uptrend.
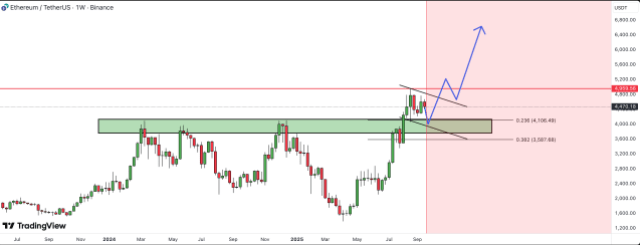
Support Zone Needs To Hold
With the bullish flag pattern that formed on the chart, the only major thing that could derail the Ethereum price is if its support fails. Right now, that support remains firm at $4,100 and continues to hold. HAMED explains that as long as the Ethereum price continues to hold this support, then the price action is still very much bullish.
A breakout from the bullish flag pattern WOULD lead to an impulse wave, and this impulse wave could lead to new all-time highs. An around 50% rally is expected to result from this impulse wave, putting the Ethereum price as high as $6,500 before it is over. “Keep a close eye on the flag breakout and watch for bullish momentum to resume once the consolidation completes,” the analyst stated.
In the event of a break below the support level, though, the Ethereum price could be in trouble. The next major support would reside at the $4,000 psychological level, where the bulls would mount their defense.
