Bitcoin Bull Run at a Crossroads: LTHs Hold Strong While STHs Start Sweating

Bitcoin's relentless rally faces its first real test of 2025 as long-term holders dig in—but weak hands are getting shaky.
The HODL wall vs. the paper hands
Veteran BTC stacks aren't budging despite 18 months of green candles. Meanwhile, recent buyers eye exits as volatility spikes—classic bull market jitters before either a blow-off top or the mother of all dips.
Institutions vs. degenerates
Wall Street's bitcoin ETFs now hold more BTC than MicroStrategy (which frankly should embarrass Saylor). Retail traders? Still chasing memecoins instead of stacking sats—some things never change.
The market's stuck in that sweaty-palm phase where every -10% candle sparks 'cycle top' tweets from permabears who've been wrong since $3K. But with the halving barely in the rearview, smart money's betting this train's got miles to go. Just don't tell the SEC.
Long-Term Holders Support Bullish Structure Amid Short-Term Selling Pressure
CryptoQuant analyst AbramChart highlights that Long-Term Holders (LTH) continue to anchor Bitcoin’s bullish narrative, with the Net Unrealized Profit/Loss (NUPL) metric remaining solidly above 0.5. This indicates that LTH are still in significant profit territory and show no signs of capitulation. Their strong conviction and willingness to hold are providing a solid foundation for Bitcoin’s price, even as market sentiment shows signs of cooling after the recent rally to $123K.
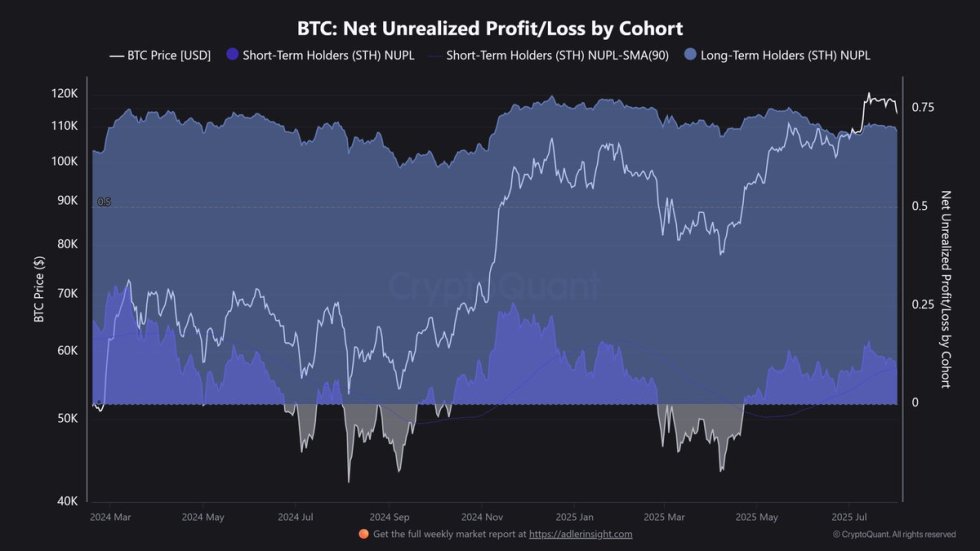
In contrast, Short-Term Holders (STH) are operating under different conditions. Their NUPL levels are fluctuating NEAR lower profit margins, suggesting that many are either realizing gains during brief rallies or are feeling pressure from holding underwater positions. This behavior is creating short-term corrective waves in Bitcoin’s price action, contributing to the recent volatility.
Currently, Bitcoin is trading close to the $104K zone, a level that appears to be supported mainly by LTH confidence. The absence of mass selling from these long-term holders reflects their belief in Bitcoin’s continued upward trajectory, despite temporary market pullbacks.
AbramChart emphasizes that unless LTH begin to distribute their holdings aggressively, the macro uptrend remains intact. Therefore, current price action is likely a phase of consolidation within a larger bullish cycle, where STH-driven volatility offers strategic accumulation opportunities for long-term participants.
Price Action Details: Testing Key Resistance
Bitcoin (BTC) is currently trading at $114,316, following a sharp pullback from the local highs at $122,077. The chart shows that BTC is now retesting the $115,724 resistance zone, which was previously a key support level during the two-week consolidation range. The 100-period moving average (green line) around $115,326 is adding additional pressure, creating a confluence resistance level that bulls need to overcome for further upside momentum.
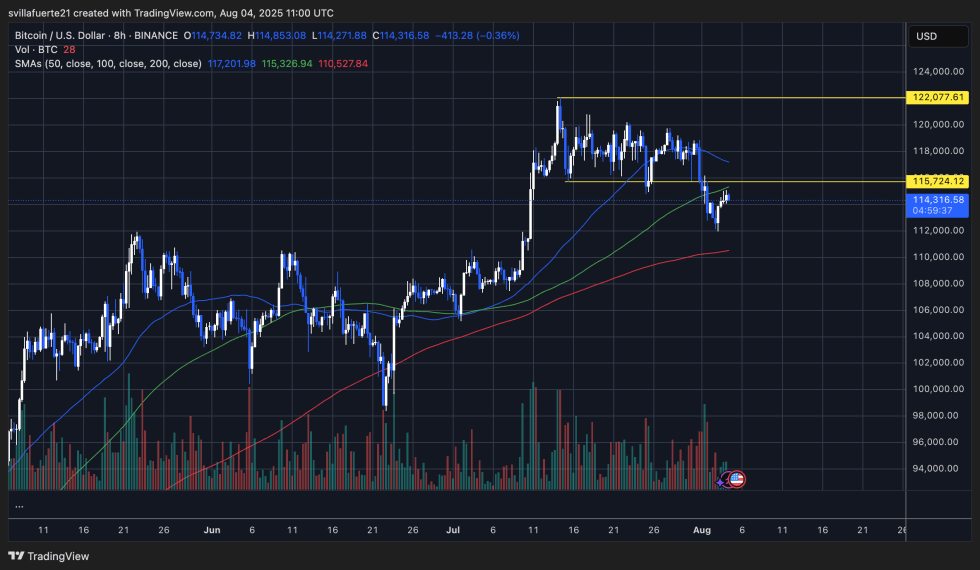
Volume has picked up during the recent bounce, indicating that buyers are attempting to defend the $112K zone. However, BTC is still trading below the 50-period moving average (blue line) at $117,201, suggesting that short-term trend momentum remains bearish unless BTC can reclaim this level.
The overall structure suggests a relief rally within a corrective phase. Bulls need a decisive close above $115,724 to shift the short-term bias back to bullish and aim for a retest of the $122,077 highs. Failure to break above resistance could result in continued range-bound price action, with support at $112,000 being the immediate level to watch.
Featured image from Dall-E, chart from TradingView
