Bitcoin Buying Frenzy Reignites: Retail to Mega Whales Are Stacking Sats Again

After months of sideways action, Bitcoin's demand surge just went vertical—and this time, everyone's invited.
From minnows to megalodons
Wallet analytics show accumulation patterns not seen since the 2024 halving. Retail traders doubled down during the recent dip, but the real story? Those elusive 10,000+ BTC wallets just opened their vaults again.
Liquidity hunters circle
Market makers are scrambling to source coins as OTC desks report 3x normal inquiry volume. Meanwhile, futures premiums suggest institutions are paying up for exposure—classic FOMO meets actual dollar deployment.
The cynical take
Wall Street's suddenly remembered crypto exists right as their traditional portfolios bleed. How convenient that decentralized money looks shiny again when the S&P flatlines for a quarter.
One thing's clear: when whales and plebs buy together, rallies tend to stick. Whether this marks the start of a new macro uptrend or just another liquidity trap remains the trillion-satoshi question.
Bitcoin Accumulation Trend Score Is Hinting At Market-Wide Buying
In a new post on X, the on-chain analytics firm Glassnode has shared about how the behavior of the various bitcoin cohorts has looked from the perspective of the Accumulation Trend Score recently. The Accumulation Trend Score is an indicator that tells us about whether the BTC investors are accumulating or distributing. The metric takes into account two factors when calculating its value: the balance changes happening in the wallets of the holders and the size of the wallets themselves. The second weighting factor means that larger entities have a larger influence on the score.
The metric’s value can lie between 0 and 1, with the two extremes corresponding to perfect behaviors of accumulation and distribution, respectively. The 0.5 mark acts as the boundary between the two types of behaviors.
Now, here is a chart that shows the trend in the Bitcoin Accumulation Trend Score for different segments of the network over the past year:
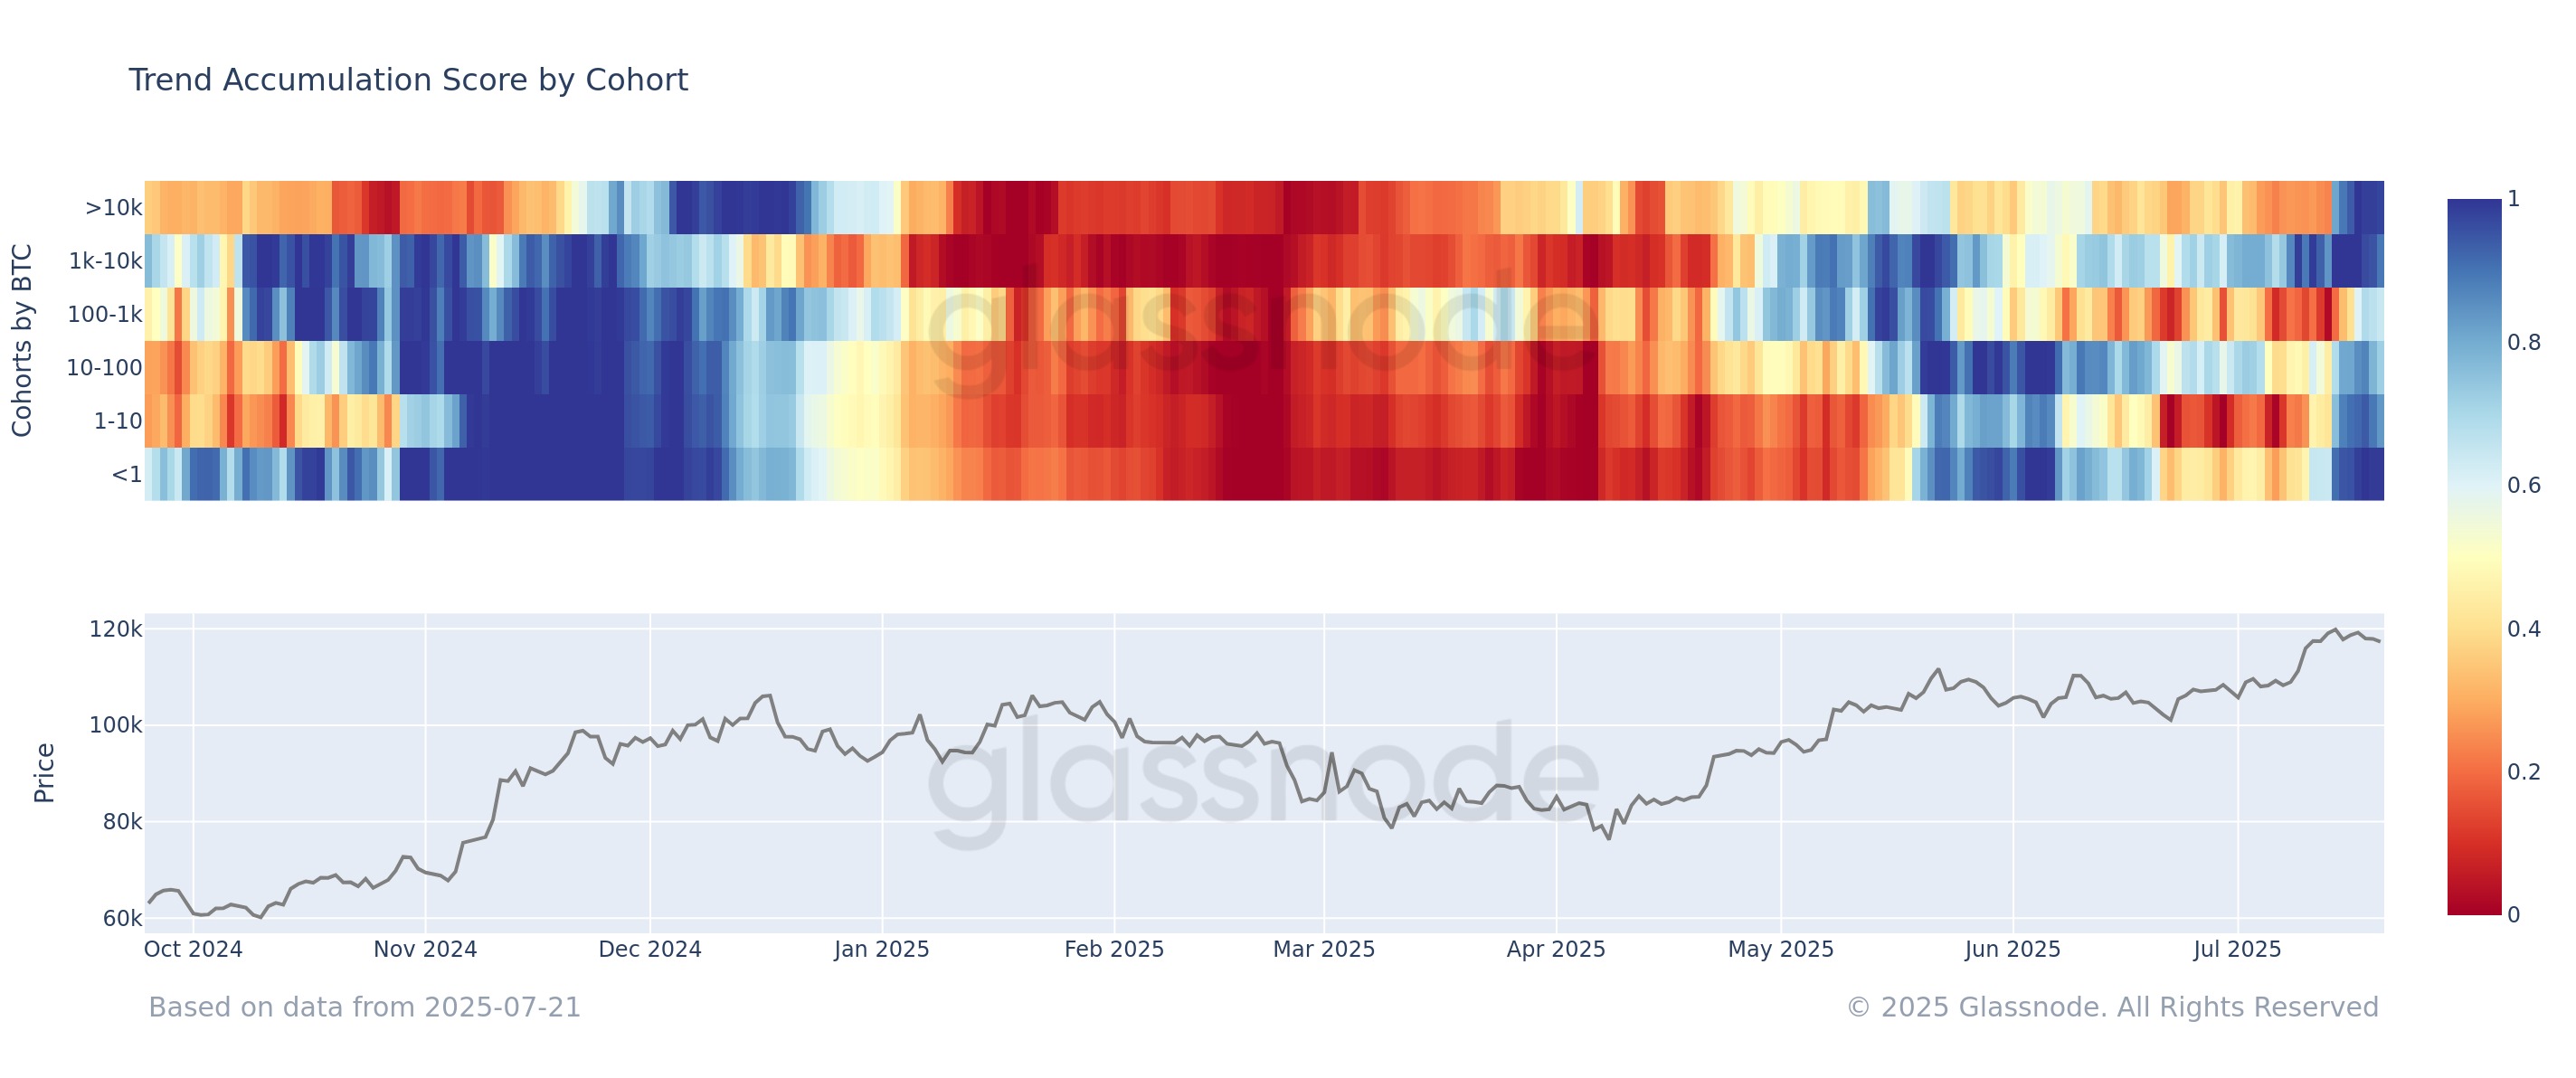
As displayed in the above graph, the Bitcoin Accumulation Trend Score was showing mixed behavior across the investor cohorts earlier, implying the holders were divided on the cryptocurrency’s outcome. Recently, however, a shift has occurred, with all investor groups showing some degree of accumulation. Three cohorts in particular stand out for their aggression: shrimps, whales, and mega whales.
The shrimps, investors with less than 1 BTC, were showing light distribution before the latest rally, but following it, they have changed their tune and started showing aggressive accumulation instead. The whales, holding between 1,000 and 10,000 BTC, were already buying with conviction when the rest of the market was unclear, and they have only continued this trend since the new all-time high (ATH) in the asset.
Finally, the largest of holders on the network, those with more than 10,000 BTC, have broken a distribution streak to show levels of buying not seen since December 2024. “The alignment across wallet sizes suggests broad-based conviction behind the current BTC uptrend,” notes Glassnode.
While the investors as a whole have been buying, it’s not like there hasn’t been any selling done at all. One group that has been responsible for distribution in the latest leg of the rally has been the miners, according to data from analytics firm CryptoQuant.
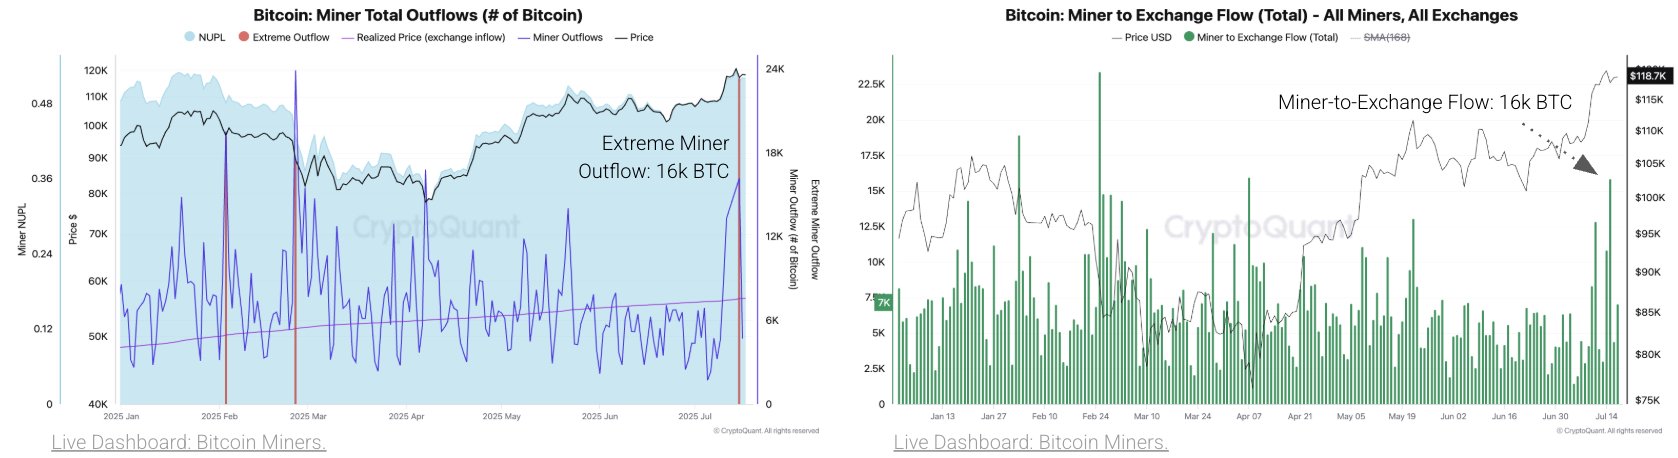
As is visible in the left chart, Bitcoin miners made a significant amount withdrawals from their wallets recently. What they wanted to do with these coins may be answered by the second graph, which shows most of the 16,000 BTC outflow went to centralized exchanges.
Miners deposit to these platforms when they want to sell, so this withdrawal spree could be an indication that this cohort took advantage of the rally to take profits.
BTC Price
Bitcoin has taken to sideways movement during the past week as its price is still floating around the $118,000 level.
