🚀 Bitcoin Buy Signal Flashes Green – But Why Are Bulls Moving Like Snails?

Crypto's fear-greed pendulum just swung toward 'buy'—yet traders are hesitating like Wall Street bankers at a volatility buffet.
The Contradiction: On-chain metrics scream accumulation, but price action whispers uncertainty. One analyst calls it 'bullish paralysis'—the market equivalent of standing on a diving board too long.
Behind the Indicator: The Bitcoin Weekly Relative Strength Index (RSI) just punched through a 3-month downtrend. Historically, this signals 30-50% rallies within 60 days. But trading volumes remain suspiciously flat—like hedge funds forgot to fuel their Lambos.
The Elephant in the Room: Macro risks loom as the Fed keeps playing interest rate Jenga. Meanwhile, crypto maximalists argue Bitcoin's 'digital gold' narrative strengthens with every central bank blunder.
Will this be another fakeout before the halving rally? Or are smart money players quietly stacking sats while retail stares at charts? Either way—the market's moving, with or without consensus.
Bitcoin Sentiment Stays Bullish, But Buying Pressure Fades
Top crypto analyst Axel Adler recently shared an update on the Bitcoin Advanced Sentiment Index, offering key insights into the current market psychology. According to Adler, the index currently reads 64%, signaling that sentiment remains solidly bullish. However, he noted a critical caveat: while the market leans toward buying, bulls appear to lack the aggression needed to push Bitcoin decisively above its all-time high of $123,000.
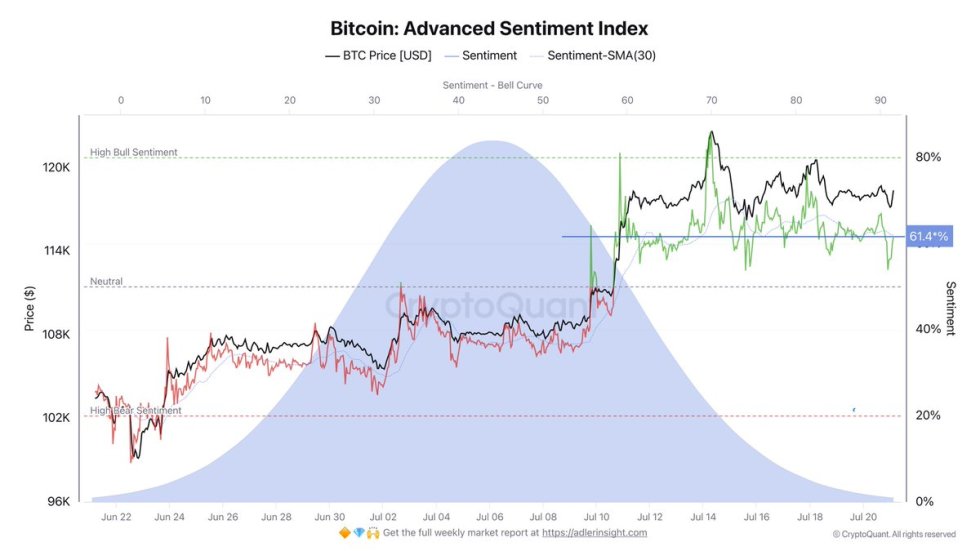
This hesitation is consistent with what’s unfolding in the charts. After a sharp rally of over 20% since late June, bitcoin is now consolidating in a tight range between $115K and $120K. While this structure suggests strength, the lack of follow-through buying at higher levels reflects caution among investors. It appears that market participants are waiting for a clear catalyst before positioning more aggressively.
The current compression in price action could precede a large move, as periods of low volatility at elevated levels often do. Traders should prepare for a breakout in either direction. While the overall trend and sentiment favor upside continuation, the possibility of a correction remains in play, particularly if sentiment begins to fade or macro conditions shift unexpectedly.
BTC Consolidates Near All-Time Highs
The daily chart shows Bitcoin consolidating just below its all-time high of $123,000, trading at $118,636 at the time of writing. The recent price action suggests strong bullish control, but the lack of a decisive breakout above the $122,077 resistance has introduced short-term uncertainty. The structure remains clearly bullish, with BTC forming higher highs and higher lows since the rebound from the March lows near $97,000.
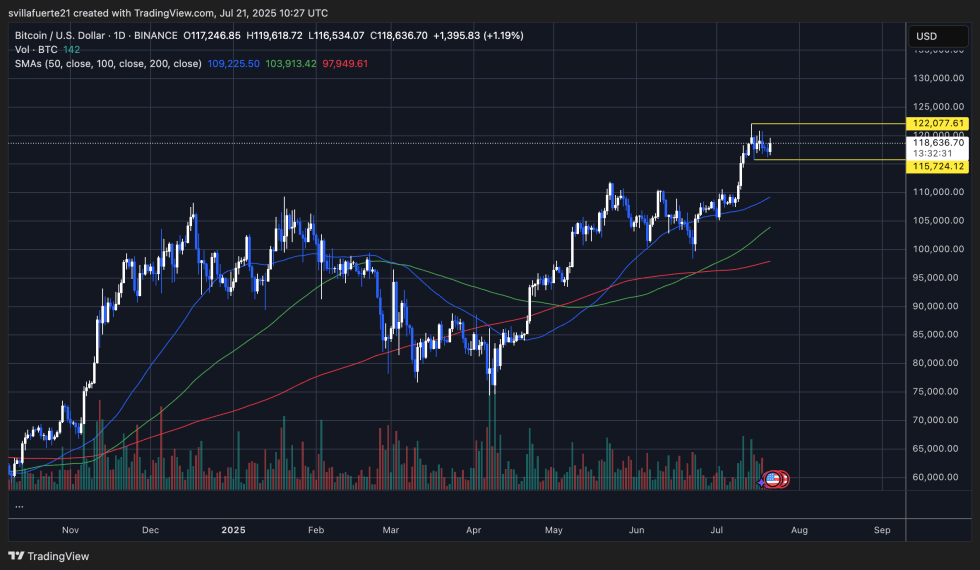
Notably, Bitcoin is holding well above the 50-day ($109,225), 100-day ($103,913), and 200-day ($97,949) moving averages. These levels now serve as layered support, reinforcing the long-term bullish trend. The ongoing consolidation above $115,724 suggests that bulls are defending this zone with conviction.
However, volume has not followed through as strongly during this consolidation phase, a sign that some market participants are waiting for confirmation before committing new capital. If BTC breaks above $122,077 with strong volume, it could trigger a breakout and price discovery toward higher levels. On the flip side, a break below $115,724 could lead to a deeper retracement toward the 50-day MA.
Featured image from Dall-E, chart from TradingView
