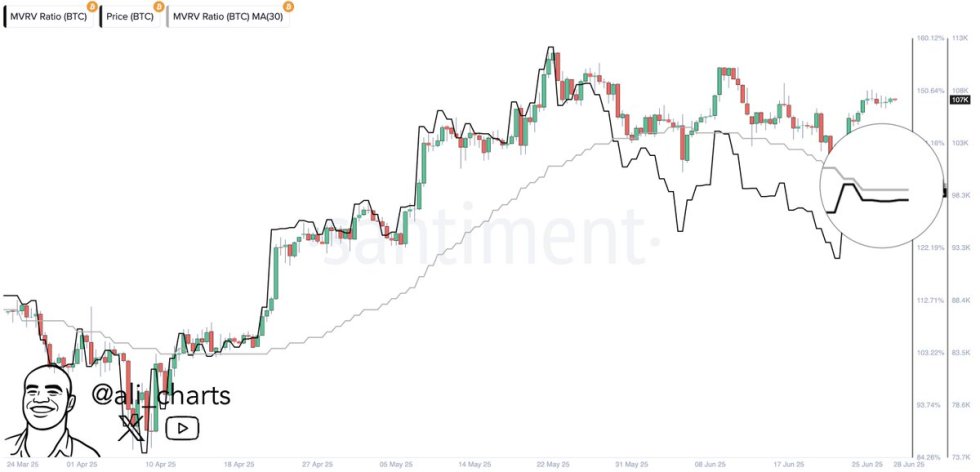
Bitcoin MVRV Golden Cross Looms – Brace for the Next Bull Run

Bitcoin's MVRV ratio flashes a golden cross signal—historically the precursor to explosive price action. Traders are strapping in.
Market Value to Realized Value (MVRV) just hit the inflection point that's preceded every major BTC rally since 2016. When this metric's 30-day moving average crosses above its 365-day counterpart, the market tends to wake up screaming.
The last time we saw this setup? December 2023. Bitcoin then ripped 300% in 14 months. Coincidence? The chart says otherwise.
Of course, Wall Street will claim they saw it coming—right after they finish downgrading their price targets. Nothing like a little hindsight bias to keep those management fees rolling in.
Bitcoin Consolidates Above $105K
After a period of heightened geopolitical tension involving the US, Israel, and Iran, global markets have found a sense of relief. With those conflicts now largely de-escalated, risk appetite has returned, and Bitcoin has responded with strength. The leading cryptocurrency pushed decisively above the $105,000 level, reclaiming short-term momentum and signaling renewed confidence among investors. However, BTC now faces a critical challenge: breaking into uncharted territory above its all-time highs.
Currently trading just below the key resistance zone near $109K–$112K, bitcoin is consolidating in a tight range. Price action has shown resilience, but momentum has paused as bulls and bears battle for control. Still, analysts believe a breakout may be close. Market structure is intact, and support levels have held firmly through recent macro volatility.
Top analyst Ali Martinez has drawn attention to a compelling on-chain signal: a potential golden cross forming between Bitcoin’s MVRV Ratio and its 30-day simple moving average. Historically, this crossover has preceded major upward moves and has served as a reliable indicator of trend reversals. Martinez suggests that if the cross confirms, it could mark the beginning of Bitcoin’s next leg higher.
The coming days will be crucial. A strong breakout above resistance could open the door to price discovery and reignite broader crypto market momentum. Conversely, failure to break through could lead to continued consolidation. For now, Bitcoin is coiled and ready, waiting for a decisive catalyst to define its next major move.
BTC Momentum Builds On 4H Chart
Bitcoin is currently trading at $107,322, showing a tight consolidation just below the key $109,300 resistance level. The 4-hour chart reveals a clear structure of higher lows following the rebound from the $103,600 support zone, which has held strongly through several tests. This level now serves as the lower boundary of Bitcoin’s current range, while $109,300 remains the critical resistance bulls must flip for further upside.
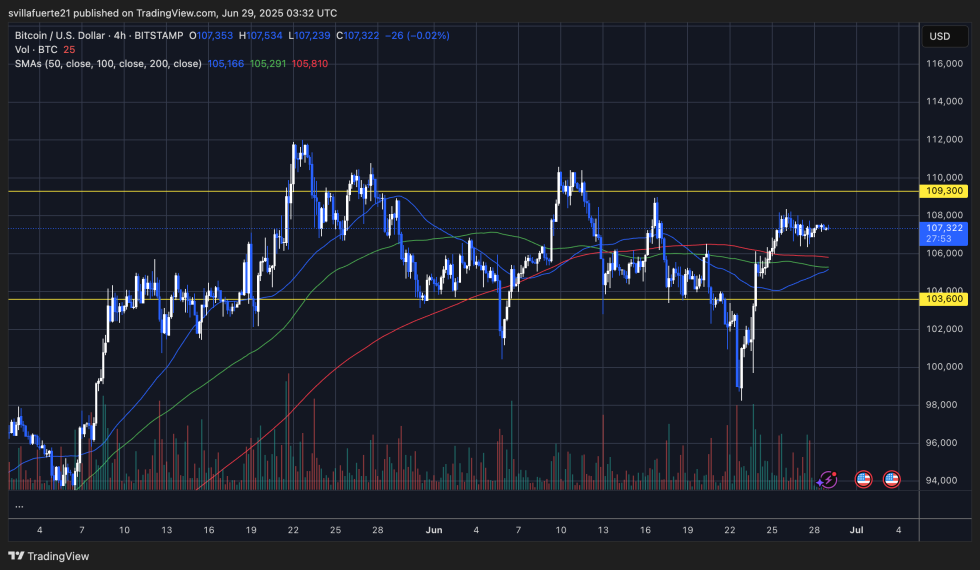
The price is trading above all major moving averages on this timeframe—50 SMA ($105,166), 100 SMA ($105,291), and 200 SMA ($105,810)—which are now converging into a bullish alignment. This structure supports the short-term bullish bias, indicating strength and growing demand above $105K.
However, volume remains relatively subdued during this consolidation phase, suggesting that traders are waiting for confirmation before initiating new positions. A breakout above $109,300, especially on strong volume, WOULD likely trigger a push toward new highs and potentially begin price discovery.
On the downside, a breakdown below $105K would invalidate the current bullish setup and put the $103,600 support at risk. For now, Bitcoin appears coiled within a well-defined range, with momentum slowly building ahead of what could be a decisive move.
Featured image from Dall-E, chart from TradingView
