Bitcoin’s Bullish Surge: The $100K Target Is Closer Than You Think

Bitcoin's price action is painting a picture even Wall Street can't ignore—a textbook breakout pattern signaling a potential sprint to $100,000. Here's the breakdown.
The Technical Case for a Six-Figure BTC
Charts don't lie (though hedge fund managers might). Bitcoin's current trajectory mirrors historical pre-bull run formations—the kind that saw 300%+ rallies in prior cycles. Key resistance levels? Obliterated. Trading volume? Stacking like unconfirmed transactions in a mempool.
Why Traders Are Betting Big
Institutional FOMO meets retail frenzy. Spot ETF inflows hit record highs while the 'dumb money' crowd still thinks Dogecoin is a viable hedge against inflation. Meanwhile, Bitcoin's scarcity math stays brutally simple: 21 million coins versus 8 billion people.
The Cynic's Corner
Sure, $100K sounds outrageous—until you remember the same suits calling it a bubble are the ones who missed Amazon at $50. The real question isn't 'if,' but 'when.' And whether your bank will still be charging 0.5% interest when it happens.
Bitcoin Bulls Must Step In Now – Analyst
In an X post on June 20, the Titan of Crypto provides an in-depth analysis into a recent Bitcoin price rejection. The premier cryptocurrency initiated a price rally on June 20 to trade as high as $106,000 where it faced a stern rejection forcing a return below the $103,157. According to Titan of Crypto’s analysis, Bitcoin’s price rejection at a Fair Value Gap (FVG) meaning price rose into an inefficiency zone but was unable to break through. For context, the FVG is a price imbalance or inefficiency on the chart where the market moved too quickly in one direction as seen on June 20, leaving behind a zone where little to no trading occurred.
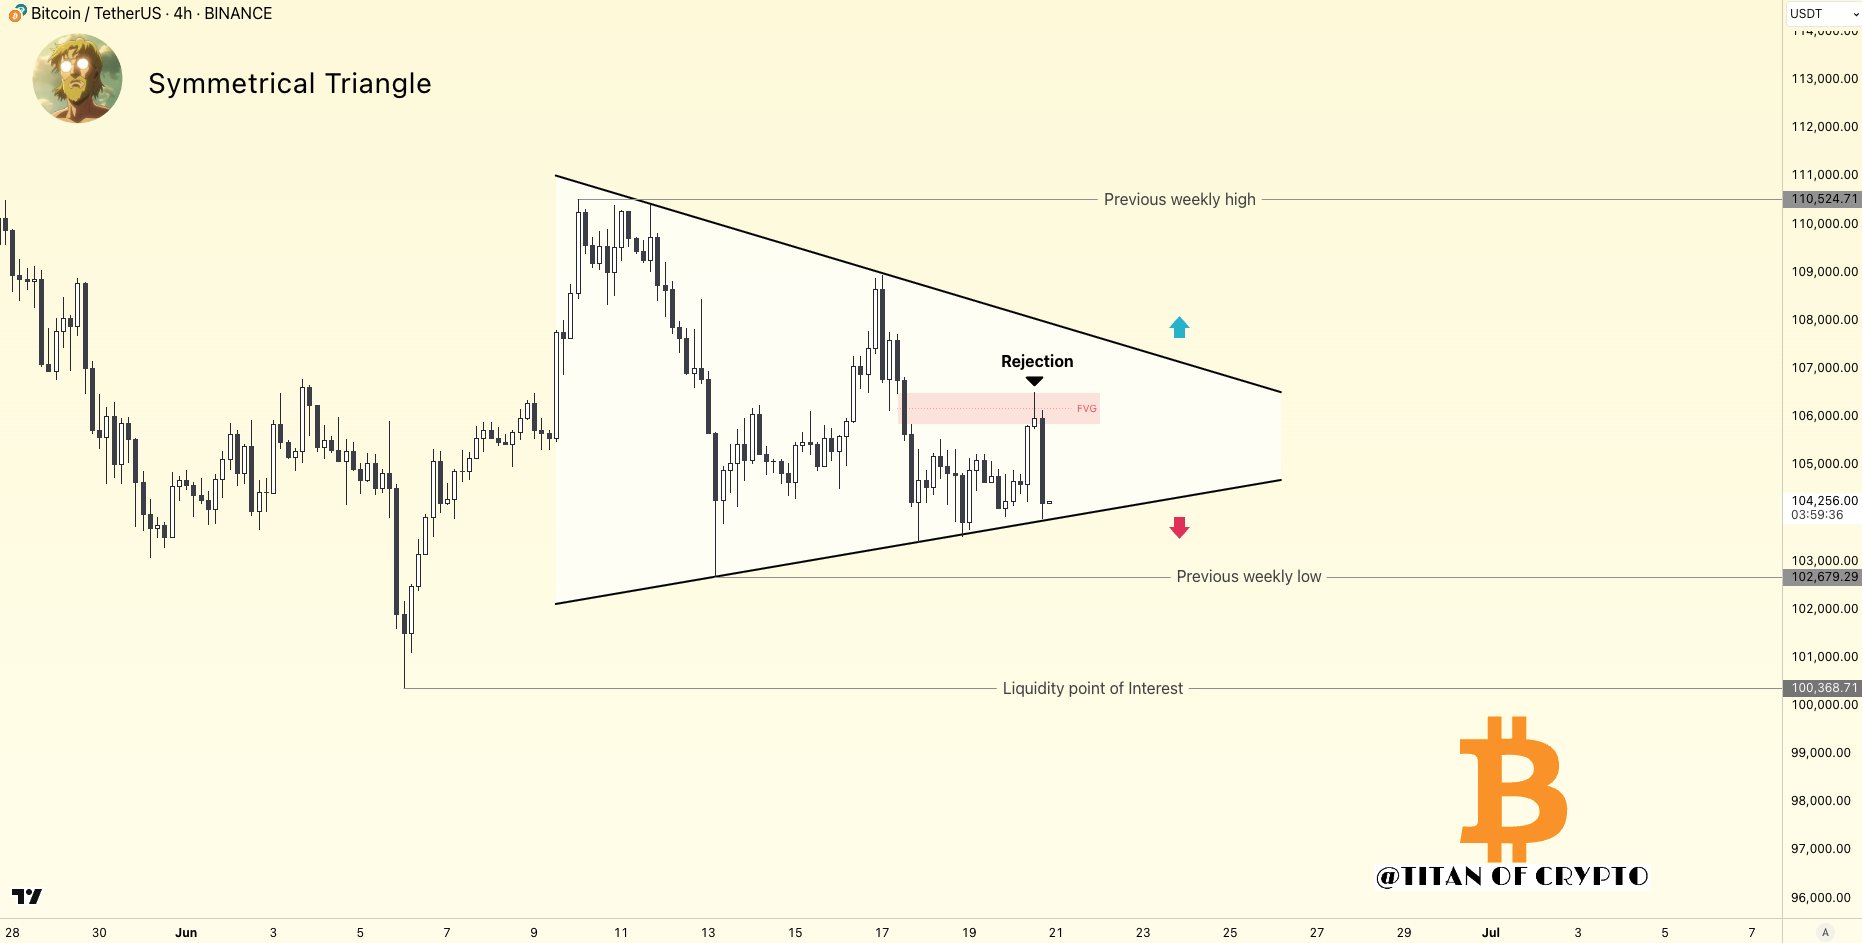
However, the FVG lies within a bigger symmetrical triangle – a common chart pattern that signals a period of consolidation before a major price move. As seen in the chart above, it is formed by two converging trendlines, narrowing structure suggests growing pressure, often leading to a breakout or breakdown as the market seeks direction. Based on recent developments, BTC has retested and now broken through through the lower boundary of the symmetrical triangle indicating a potential for further downside. According to Titan of Crypto, possible price targets for bitcoin in this event include the previous weekly low at $102, 679, failure of which to act as a strong support zone would force prices to around the psychological $100,000 zone.
Bitcoin Market Overview
In other developments, blockchain analytics firm Sentora reports that Bitcoin networks fees grew by 105.8% on the weekly scale indicating a surge in transaction numbers and user engagement. Meanwhile, there was an notable exchange outflow of $2.06 billion suggesting a long-term market confidence as investors MOVE their holdings to their private decentralized wallet.
As earlier stated, BTC is trading at $103,402 with losses of 1.88% and 7.02% on the weekly and monthly chat. Meanwhile, the daily asset trading volume is up by 38.31% and valued at $50.14.
