Avalanche on Fire: Transaction Volume Skyrockets 275% – Is This the Next Big Crypto Play?

Avalanche isn''t just surviving—it''s thriving. The blockchain''s transaction volume just exploded by a jaw-dropping 275%, leaving skeptics scrambling and bulls licking their chops.
Why the surge? Scalability meets demand.
Avalanche''s sub-2-second finality and low fees are finally getting the attention they deserve. While Ethereum gas fees have traders groaning, Avalanche''s C-Chain is eating their lunch—quietly, efficiently, and without the legacy-chain baggage.
Institutional eyes are watching.
Hedge funds love a good ''Ethereum killer'' narrative, and Avalanche''s recent numbers are catnip for yield-hungry portfolios. Meanwhile, retail FOMO is creeping in—because nothing excites crypto Twitter like triple-digit growth metrics.
Caveat emptor, though.
Remember when every ''next-gen blockchain'' promised to dethrone Ethereum? (Looking at you, EOS.) But Avalanche''s tech stack—not just hype—might actually justify the buzz. For now, the charts scream opportunity. Just don''t bet the farm before the next ''crypto winter''—Wall Street''s algo-traders certainly won''t.
Daily Number Of Transactions For Avalanche Has Shot Up
According to data from the institutional DeFi solutions provider Sentora (previously IntoTheBlock), the Number of Transactions is significantly up for Avalanche compared to early May. The “Number of Transactions” here is an on-chain indicator that measures, as its name suggests, the total number of transfers that are occurring on a given cryptocurrency network every day.
Below is the chart shared by Sentora that shows the trend in this indicator for Avalanche over the past year.
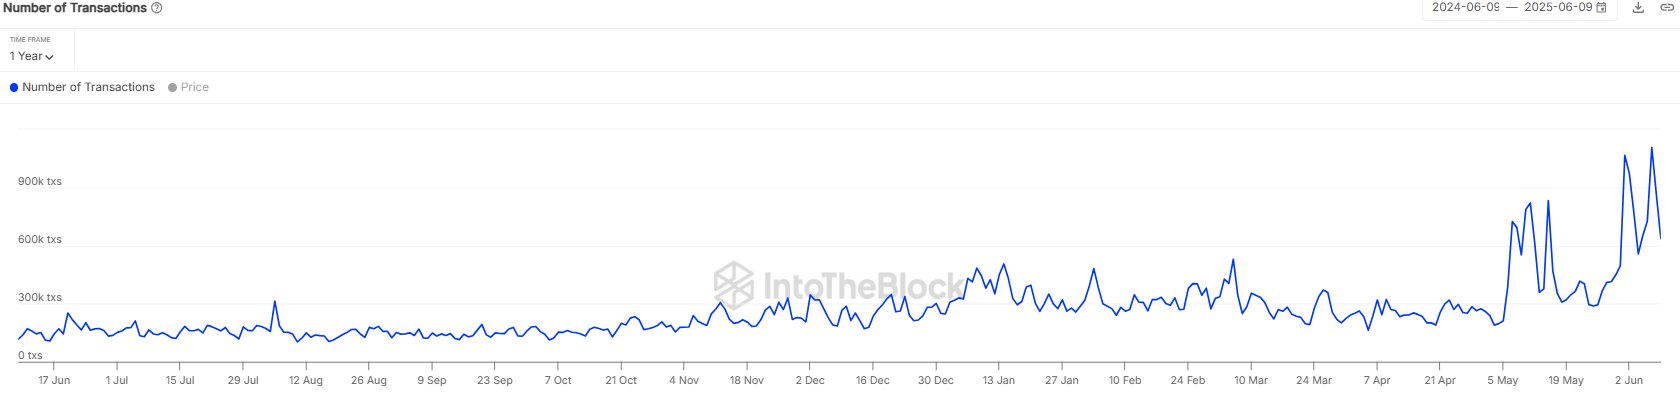
From the graph, it’s visible that the Number of Transactions stayed around a consistent level during the past year, until May arrived. That month saw some rapid growth in the metric, although the increase in network activity couldn’t last. By the end of the month, the indicator had returned to the same familiar muted levels as before.
In this new month of June, however, the indicator has again observed an uptick and has already surpassed the May peak. The surge has been so strong that the network is now averaging 759,000 daily transactions, which is more than 275% up compared to early May.
Generally, an uptick in chain activity can be a sign that investors are paying more attention to the cryptocurrency. The increased moves from the holders can feed into price volatility, so the asset can see increased action when this trend develops. It now remains to be seen whether something similar WOULD happen with Avalanche or not.
In some other news, AVAX currently ranks second by Development Activity among Real World Assets (RWAs), as the analytics firm Santiment has revealed in an X post.
The “Development Activity” refers to a metric that tells us about the total amount of work that the developers of a given cryptocurrency project are putting into its official GitHub repository.
The indicator gauges the work done in terms of ‘events,’ where each event corresponds to some action on the repository like pushing a commit or creating a fork.
Here is how the RWAs in the sector have compared against each other in terms of their Development Activity over the past month:
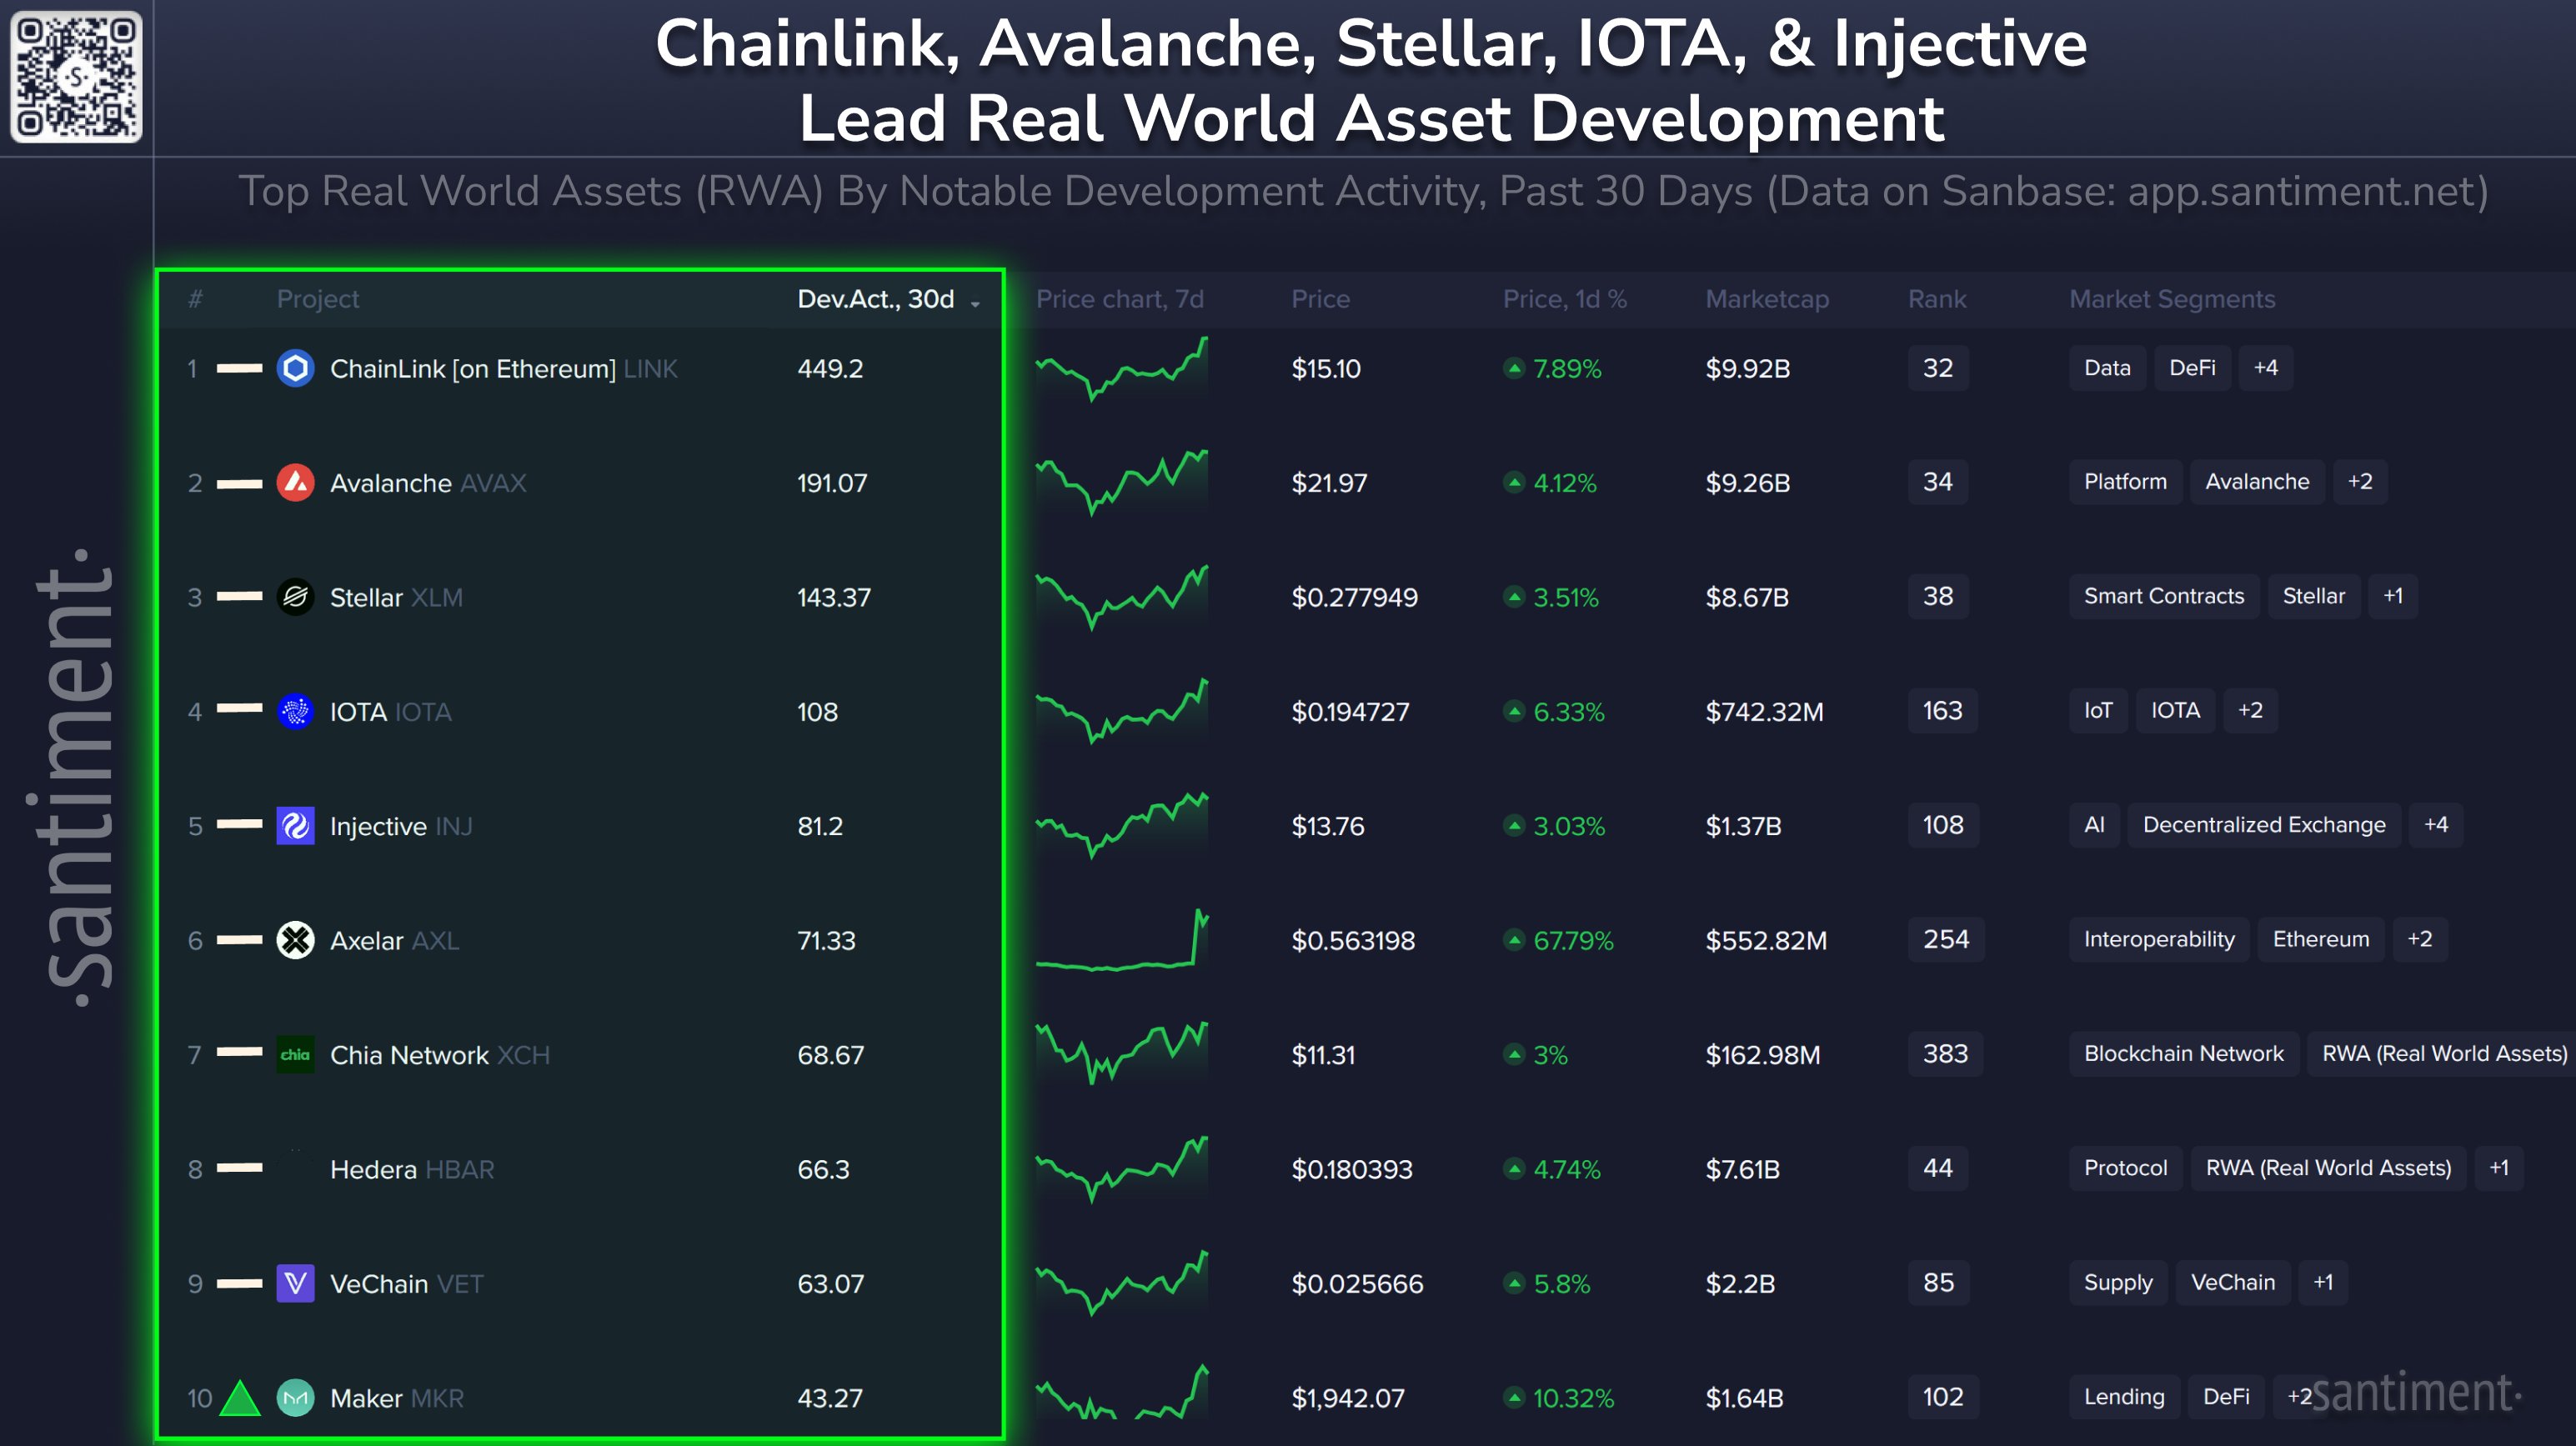
As displayed in the above table, Avalanche has recorded a 30-day Development Activity of 191.07, which puts it larger than all of these assets, except for chainlink (LINK), which has seen an impressive value of 449.2.
AVAX Price
At the time of writing, Avalanche is floating around $22.4, up almost 7% in the past week.
