Bitcoin Stumbles While Stocks Rally – Temporary Dip or Ominous Divergence?

BTC’s underperformance against traditional markets raises eyebrows as Wall Street hits record highs. Is this just crypto taking a breather—or the canary in the coal mine?
Key signals to watch: Institutional flows drying up? Miner capitulation? Or just another ’healthy correction’ (as bagholders always say). Meanwhile, Goldman Sachs traders high-five over their 0.05% bond yield ’alpha’.
Bitcoin Faces Resistance But Eyes Liquidity Above $105K
Bitcoin continues to consolidate above the $103,000 level, forming a tight range that typically precedes major moves. Bulls are pushing to reclaim momentum, but resistance at the $105,000 mark remains strong. Liquidity clusters just above this level and into the all-time high zone around $109,000, making it a critical region for a potential breakout. However, growing short positions have kept pressure on BTC, slowing upward momentum despite favorable broader conditions.
Daan’s technical analysis adds depth to this picture. His review of the BTC/SPX 1D chart shows that Bitcoin has recently failed to outperform stocks, a notable change from previous weeks. The relative weakness followed news that the US reached a “Deal” with China, reducing market uncertainty and fueling a risk-on rally in equities. Bitcoin, on the other hand, stalled just below its highs.
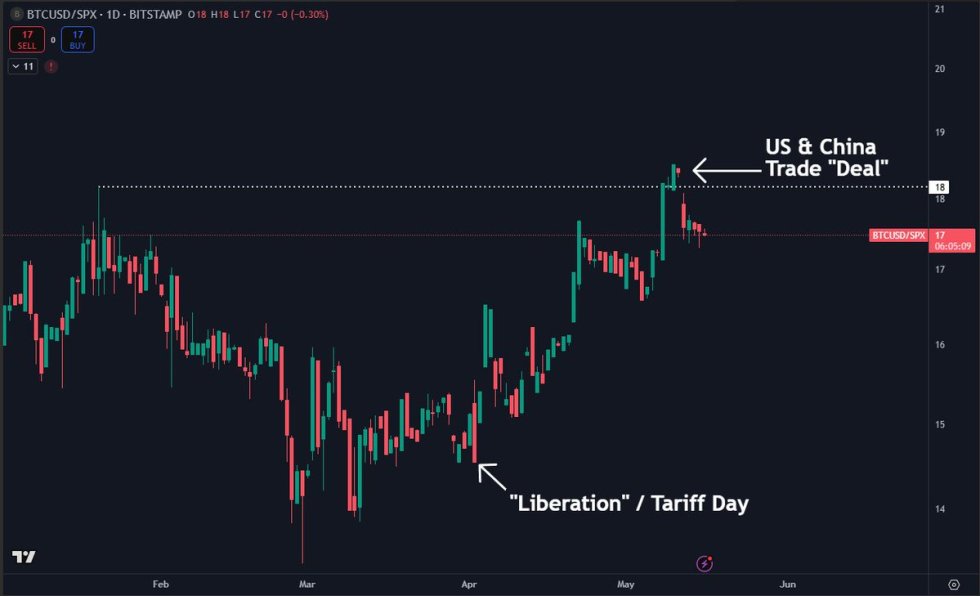
This divergence suggests that Bitcoin is evolving into an asset that investors lean into during periods of outflows or global instability. While it may be underperforming in the short term compared to equities, BTC’s strong run-up prior to the trade deal remains intact. Daan notes that continued monitoring of this ratio is essential as the macro environment shifts, especially if new volatility emerges.
Weekly Chart Analysis: Breakout Confirmation Still Pending
The weekly chart for Bitcoin shows a strong recovery from the April lows, with BTC now consolidating just below the key $105,000 resistance zone. After reclaiming the $100,000 psychological level with a powerful bullish candle, the price is stabilizing around $103,000–$104,000, suggesting growing pressure for a breakout into new all-time highs.
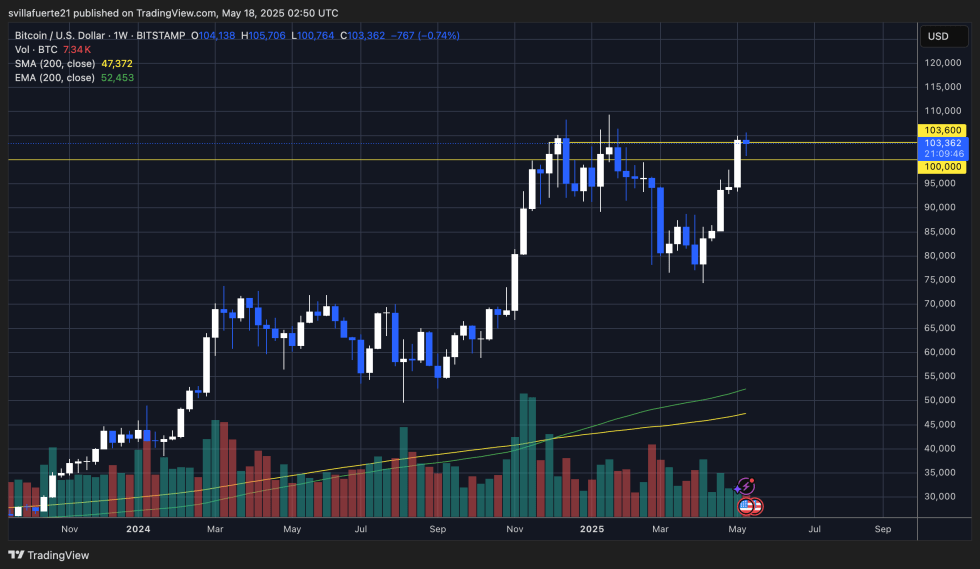
Volume has remained relatively stable, with no extreme spikes, indicating steady interest rather than aggressive speculation. The structure still favors the bulls, as the current weekly candle holds above last week’s high and the price continues to trade well above both the 200-week simple moving average (SMA) at $47,372 and the exponential moving average (EMA) at $52,453.
The chart suggests that if Bitcoin can close the week above $105,000, we could see an explosive move into price discovery. However, repeated rejections at this level WOULD increase the likelihood of a short-term correction. The $100,000 mark remains the key support for maintaining a bullish structure.
Momentum remains with the bulls, but caution is warranted as this is historically a high-risk, high-reward zone. Traders are watching closely to see if Bitcoin can break cleanly above resistance and begin a new leg higher.
Featured image from Dall-E, chart from TradingView
