Bitcoin Mirrors April’s Rally – This Key Range Will Signal the Next Big Move

Bitcoin’s chart is pulling a déjà vu—trading patterns eerily similar to its April surge are flashing again. Traders glued to screens are watching one critical resistance zone like hawks.
Breakout or fakeout? The $65K-$68K range holds the clues. Clear it, and bulls charge toward new highs. Fail, and we’re stuck in another ’institutional adoption’ waiting game—Wall Street’s favorite excuse to drag their feet.
Meanwhile, crypto degens whisper: ’History doesn’t repeat, but it often rhymes.’ Just don’t tell that to the SEC.
Bulls Eye Price Discovery As Bitcoin Tests Key Resistance
Bitcoin is on the verge of entering price discovery mode as bulls aim to break above the $105,000 mark and challenge the all-time high NEAR $109,000. After gaining over 40% since its April 9th low, the asset has entered a critical phase, with investors closely watching for a decisive breakout. Despite facing local resistance, the sustained momentum from recent weeks has kept bullish sentiment alive.
According to Daan, Bitcoin’s recent behavior mirrors a pattern observed since the April rebound. The cycle has been consistent: a strong upward move, followed by tight consolidation, then another leg higher.

Daan suggests “keeping an eye on this local range and waiting for a breakout in either direction” as the most strategic course of action. Rather than attempting to predict the next move, he advises reacting to confirmation in the charts.
As bitcoin hovers near resistance, the market remains sensitive and susceptible to volatility. A breakout above $105K could ignite a powerful move into uncharted territory, triggering strong buying interest. However, failure to clear this level may invite short-term corrections. With Bitcoin standing at a pivotal juncture, both bulls and bears are preparing for high-stakes moves that could define the trend for the weeks ahead.
Technical Details: BTC Consolidates After Explosive Rally
The chart shows Bitcoin consolidating just below the $105,000 resistance level after an explosive rally that began in early April. Price action remains strong, with BTC currently trading around $103,820 — a level that has now become a battleground between bulls and bears. The uptrend remains intact, supported by the 200-day SMA at $92,316 and the 200-day EMA at $87,993, both well below the current price and sloping upward, confirming bullish momentum.
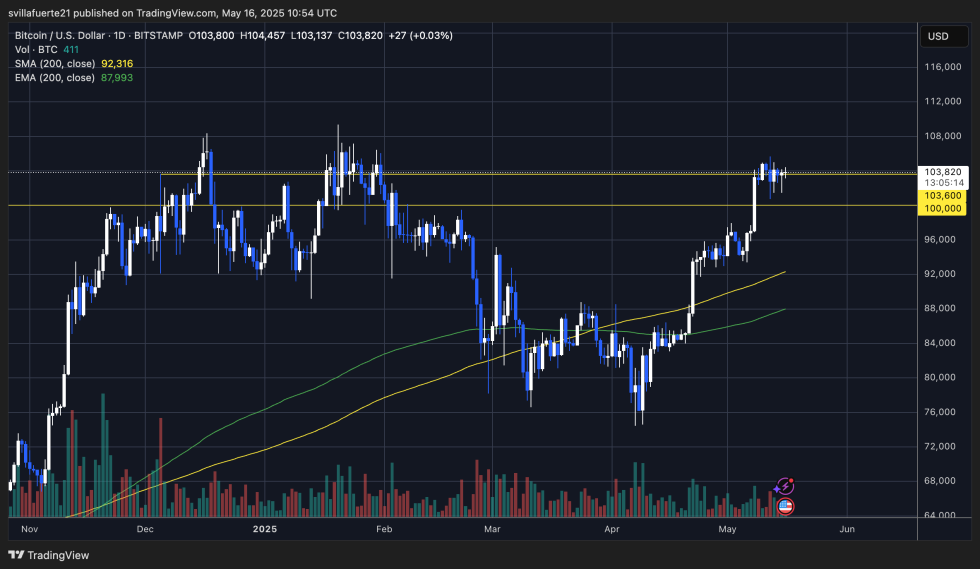
Volume has slightly decreased during the past few sessions, which aligns with the consolidation phase. However, this could be a healthy pause as the market digests gains from the recent breakout above $100K. The tight range between $103,600 and $104,800 suggests that a breakout in either direction could trigger significant volatility.
If bulls manage to push BTC decisively above $105K, a move into price discovery targeting the all-time high around $109K is likely. On the flip side, failure to break above this range could lead to a retracement toward the $100K support zone, which must hold to maintain bullish structure.
Featured image from Dall-E, chart from TradingView

Log in to Reply
Log in to comment your thoughtsComments
Related Articles
|Square
Get the BTCC app to start your crypto journey
Get started today Scan to join our 100M+ users