Bitcoin’s Daily RP Yield Hits Bullish Signals – Traders Brace for Sustainable Rally

Bitcoin’s yield metrics flash green as institutional inflows surge past $1B this week—despite legacy finance pundits still calling it a ’pet rock.’
Key drivers:
- Daily realized profit (RP) yield spikes to 3.2%, highest since 2024’s ATH run
- Miner capitulation ends as hash rate recovers 18% from Q1 lows
- Tether’s $2B USDT mint this month suggests hungry sidelined capital
Cynical take: Wall Street’s sudden ’blockchain conversion’ coincides perfectly with their client portfolios underperforming crypto YTD. The math isn’t mathing.
Sustained Profitability Suggests Bitcoin Uptrend Remains Intact
Bitcoin is currently testing demand NEAR the $100,000 level after a strong multi-week rally that added over 40% in value since its April 9th low. Following a surge that brought BTC to the $105K mark, the market is now consolidating, with investors closely watching for signs of continuation or a deeper pullback. For now, the structure remains bullish, but volatility is expected.
Top analyst Axel Adler shared valuable on-chain insights via X, highlighting that bitcoin is trading near $100K while its realized price—an indicator of the average price at which all coins last moved—sits at approximately $45,000 and continues to rise. This consistent upward movement in realized price suggests that the market remains in accumulation mode and is not yet at an overheated point.
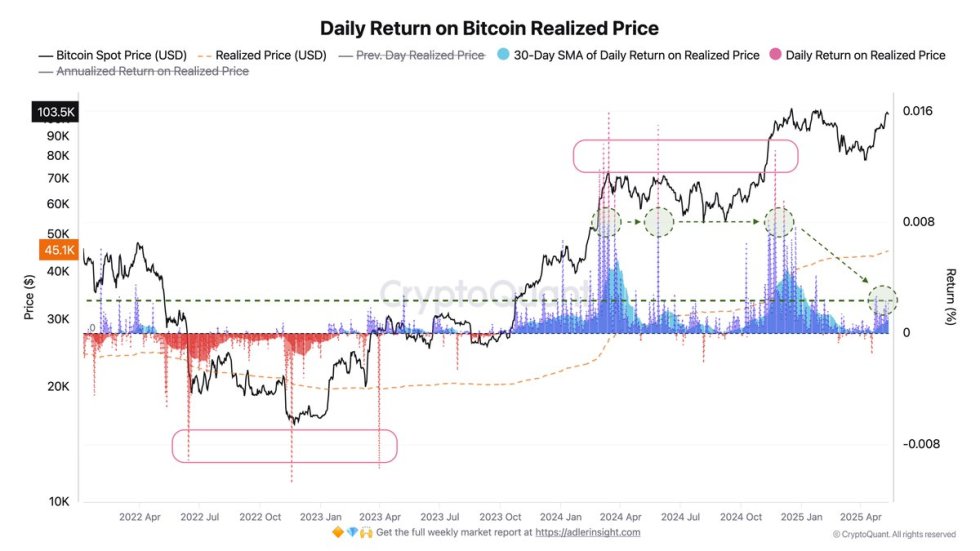
Daily Realized Profit (RP) yield, a key profitability metric, ranges from 0.10% to 0.23%, or roughly 36–85% on an annualized basis. The 30-day simple moving average of this metric holds steady at around 0.10%, equal to 35–40% annualized. These figures point to a healthy market environment—profits are being realized, but not at levels that suggest excessive euphoria or speculative overheating.
Despite the bullish backdrop, analysts remain divided. Some argue that a major breakout is imminent once BTC confirms support above $100K, while others anticipate a correction to reset positioning. Either way, the current data signals that Bitcoin remains in a sustainable bull phase driven by organic demand and strengthening fundamentals.
BTC Tests Support At $101K As Market Cools Off
The 4-hour chart shows Bitcoin consolidating just above the $100K psychological level, trading at $101,921 after a failed breakout attempt near $105K. This pullback has shifted short-term momentum, with BTC now moving between key horizontal levels: $103,600 as resistance and $100,000 as crucial support.
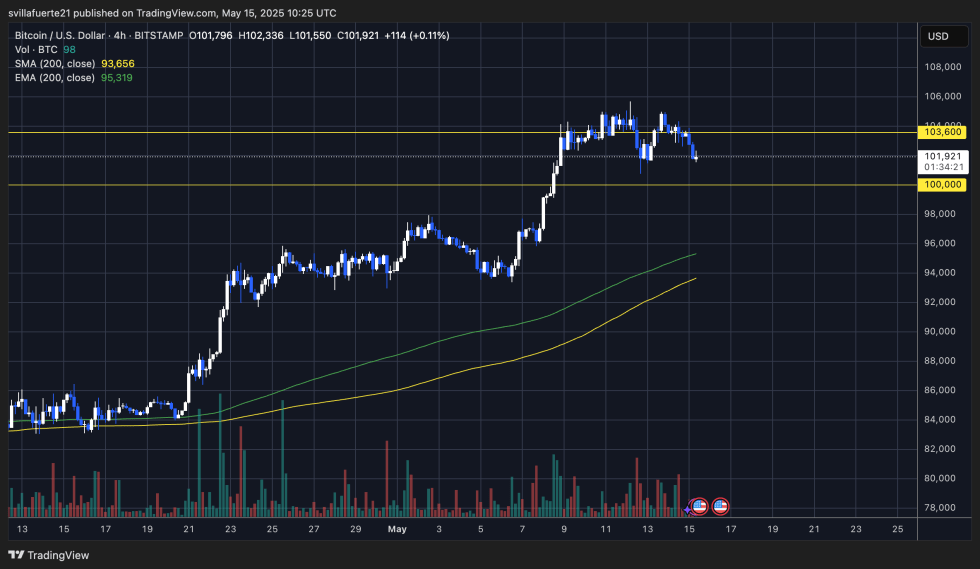
Price action reveals lower highs forming since the local peak, suggesting that buying pressure is weakening in the short term. However, the broader trend remains intact, with the 200 EMA ($95,319) and 200 SMA ($93,656) trending upward and acting as dynamic support. This zone around $95K–$96K is likely to serve as a demand floor should Bitcoin lose $100K in the near term.
Volume has tapered off during this pullback, indicating that the retracement is more likely corrective than driven by panic selling. Still, the current structure warrants caution: a clean reclaim of $103,600 is needed to reestablish bullish dominance and target a breakout above the all-time high.
Until then, traders are likely to monitor the $100K level closely. A breakdown could trigger a cascade toward the $96K–$98K region, while a bounce here WOULD strengthen the case for a renewed push toward price discovery.
Featured image from Dall-E, chart from TradingView
