Ethereum Squeezes Into Make-or-Break Volatility Crunch – ETH/BTC Coiling Like a Spring

Ethereum’s price action against Bitcoin has entered a compression zone so tight, traders are holding their breath. The ETH/BTC chart shows volatility hitting multi-month lows—a classic setup for explosive moves.
When consolidation patterns get this narrow, they rarely hold. Either ETH breaks out with conviction or gets smacked down hard. Meanwhile, Bitcoin maximalists are already popping champagne—because nothing makes them happier than watching altcoins twitch helplessly in BTC’s gravitational pull.
Technical indicators suggest the stalemate won’t last. Bollinger Bands are at their narrowest since the 2024 rally, and historical data shows 80% of similar setups resolve within 10 trading days. The only question: Which way?
Smart money’s betting on volatility returning with a vengeance. After all, when has crypto ever chosen boredom when drama was an option?
Ethereum Struggles Below $1,900 As Risk And Uncertainty Dominate
Ethereum is facing renewed pressure after failing to break above the $1,874 high set on May 1st, leaving bulls with the urgent task of reclaiming momentum before volatility takes over. The asset is currently trading NEAR critical support, unable to establish a clear direction as global markets remain fragile. With Ethereum still down more than 55% from its December highs, the bearish price structure remains intact, and any further weakness could trigger deeper downside.
Market volatility is being fueled by macroeconomic uncertainty, particularly as the U.S. and China continue to engage in high-stakes trade negotiations. Investors are cautious, and Ethereum’s inability to show strength amid a broader crypto recovery is raising concerns about its near-term outlook.
Adding to the complexity, Daan highlights that the ETH/BTC ratio is now at its lowest volatility level in over two years. While the ratio has been in a long-term downtrend, it has stalled for the past month, suggesting that a breakout (or breakdown) could be near.
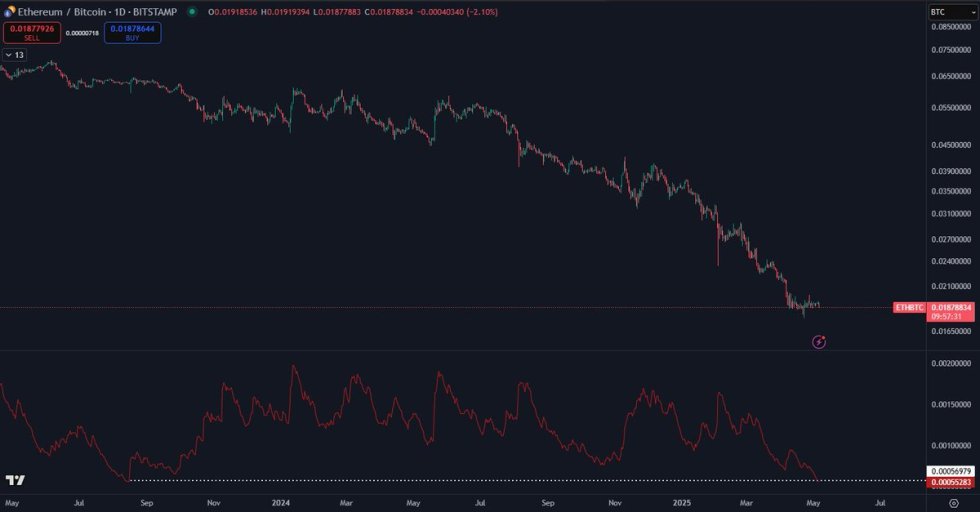
Historically, such compression periods often precede sharp moves. However, Daan notes that the low timeframe trend has not yet flipped bullish, and until it does, any rally should be treated with caution. For now, Ethereum remains stuck in limbo.
Price Action Details: ETH Testing
Ethereum is trading at $1,831, showing modest strength after bouncing from recent support near $1,780. On the 4-hour chart, ETH is attempting to establish a higher low and reclaim bullish momentum, but it still faces stiff resistance below the key $1,874 high from May 1st. Price is consolidating just above the 200-period EMA at $1,787 and the 200-period SMA at $1,699—two levels that have served as dynamic support and resistance zones throughout recent trading sessions.
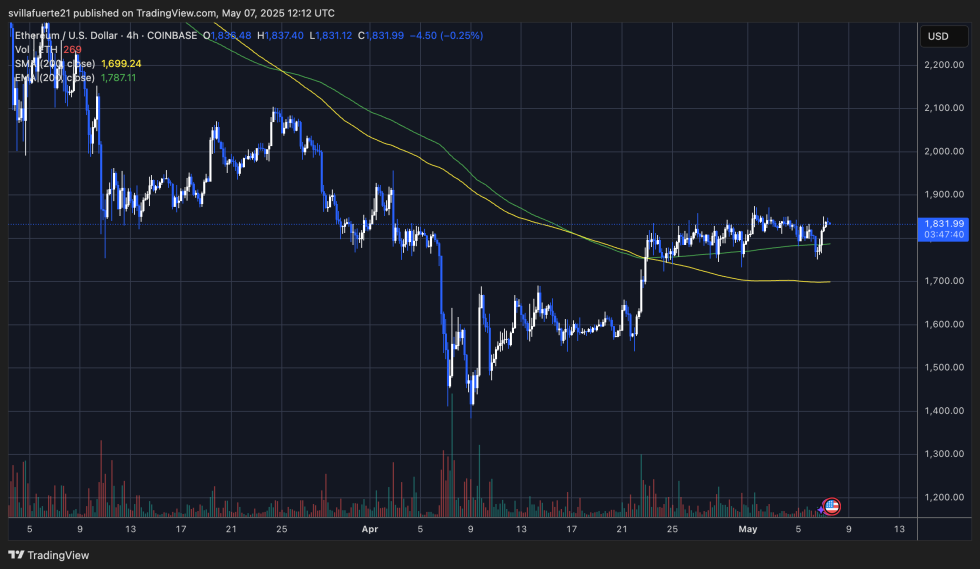
This sideways action highlights indecision as ETH struggles to break free from its range, with volatility compressing and volume remaining muted. A clean breakout above $1,874 could signal the start of a bullish leg targeting the psychological $2,000 mark. However, failure to hold above the $1,780–$1,750 region would likely invalidate the structure and open the door for further downside.
Technical indicators suggest that momentum is building, but not yet confirmed. Until Ethereum reclaims the $1,900–$2,000 range, the broader bearish trend remains in play. For now, ETH is in a critical zone where both bulls and bears have a case, making the next few sessions pivotal in determining whether Ethereum continues to recover or resumes its downtrend.
Featured image from Dall-E, chart from TradingView
