SHIB Enters ’Buy Zone’—Analysts Predict 1,700% Rally as Memecoin Nails Key Support

Dogecoin’s fiercest rival flashes its teeth again. After months of sideways action, Shiba Inu has plunged into what traders call the ’prime accumulation range’—a technical sweet spot that historically precedes explosive runs.
The setup? A textbook retest of SHIB’s 2024 breakout level at $0.000012, now acting as support. With Bitcoin stabilizing above $60K, altcoins are priming for their next leg up. And if history repeats, this meme-powered asset could leave its leash behind.
Just don’t tell the Wall Street suits—they’re still trying to explain how an asset with a dog logo outperformed their precious blue-chip stocks... again.
Shiba Inu Locked In Long-Term Bullish Structure, Targets $0.00023
According to the chart posted by CryptoELlTES, Shiba Inu is trading within a narrowing symmetrical triangle, a pattern often associated with explosive breakouts once price action compresses enough. This chart formation encapsulates Shiba Inu’s price action on a multi-year timeframe, starting from when it reached its current all-time high of $0.00008616 in October 2021.
Notably, the chart identifies multiple successful tests of the triangle’s support line, each marked by price rebounds that helped sustain the structure’s bullish integrity. These rebounds has been accompanied by lower highs over the years at a downward sloping resistance trendline, leading to the formation of a narrowing triangle.
The latest move was a bounce on the lower trendline of the triangle, and the next anticipated move is a push towards the apex of the triangle.
The technical setup outlined in the analysis suggests that if Shiba Inu can break above the triangle’s upper boundary, a 17X surge toward the $0.00023 price level could follow. Although the predicted move looks too bullish, it aligns with standard principles of technical analysis regarding breakout from symmetrical triangles.
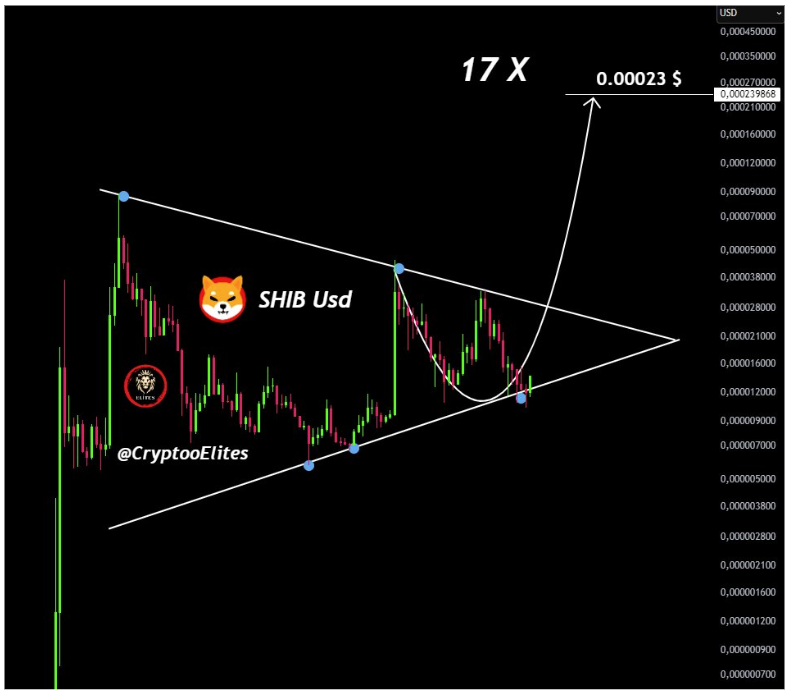
Image From X: CryptoELlTES
SHIB’s Current Price Action Points To Growing Momentum
Shiba Inu’s price has shown early signs of strength after bouncing off the lower trendline once again, showing the resilience of buying pressure around this support level. The pattern on the chart suggests that SHIB may be forming a cup within the larger triangle, which adds to the bullish outlook if a breakout does occur.
Building on this positive momentum, Shiba Inu’s recent price movements have tilted the monthly chart into a bullish stance, setting the stage for what could be a significant technical milestone. If the upward trajectory holds, Shiba Inu is on course to register its first positive monthly close in April after five consecutive months of negative closes.
At the time of writing, Shiba Inu is trading at $0.00001381, down by 5.5% over the past 24 hours. However, despite the short-term pullback, the meme coin is still up by approximately 11.5% from its opening price in April.
The question now is whether the broader crypto market will provide the momentum needed to trigger such a Shiba Inu price rally that breaks above the symmetrical trendline and sends it to $0.00023.
Featured image from Unsplash, chart from TradingView

Log in to Reply
Log in to comment your thoughtsComments
Related Articles
|Square
Get the BTCC app to start your crypto journey
Get started today Scan to join our 100M+ users