
Where and How to Buy Roaring Kitty (ROAR) in 2026
Roaring Kitty (ROAR) is more than simply a digital comm…
2026-04-03
A prominent crypto analyst warns that Ethereum's current price weakness represents the final stage of a multi-year accumulation cycle, setting the stage for a potential surge to $20,000. With ETH trading near $2,100—down 57% from its all-time high—technical analysis identifies this as the prime accumulation zone before a historic breakout.
The weekly ETH/USDT chart posted by Crypto Patel on X illustrates a structured price pattern that has been developing since 2024. The chart identifies a Selling Climax (SC) in early 2024, followed by an Automatic Rally (AR) to resistance within two months, and then a Secondary Test (ST) of the Selling Climax in mid-2024.
These are all terminologies of a Wyckoff blueprint, and this has created the sequence of price events that established the boundaries of the current trading range. There is a horizontal resistance line around $4,700 at the top of that range, while Support 1, at $1,549, represents the bottom.
There are also two notable downside wicks labeled as Spring 1 and Spring 2, both of which are situated around Support Spring 1, which occurred in mid-2025 and saw the Ethereum price fall below Support 1 very briefly before recovering and pushing back to a new all-time high just above the resistance line.
Since then, however, the Ethereum price has been on a downside path, and the current price action is labeled as Spring 2, which is just above Support 1. If Support 1 breaks down, the next intended buy zone is Support 2 at $1,065. It is within the projected fall to Support 2 where Crypto Patel identifies the $1,800 to $1,400 range as the best buying and accumulation zone.
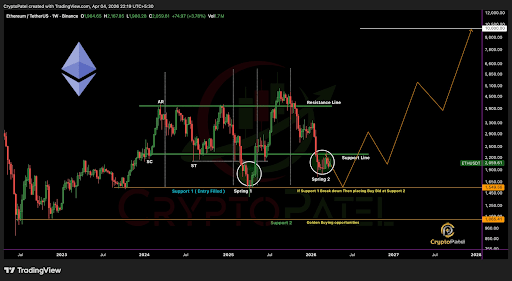
Ethereum Price Chart. Source: @CryptoPatel On X
The ETH accumulation map projects a price rally to as high as $20,000 after Ethereum breaks out of the accumulation zone. This rally is, however, contingent on a big resistance / breakout level around $4,700.
Crypto Patel’s projected targets ($10,000, $15,000, and $20,000) are plotted on the chart as a staged upside trajectory extending into late 2027 and 2028. The projected rally shows a rally from the current accumulation zone to $4,700, a pullback below $4,000 to consolidate the breakout, and then a parabolic extension to new all-time highs as high as $10,000 before continuing higher to $15,000 and $20,000.
A $20,000 price target for Ethereum would represent about a 10x return from the current price, which is trading at $2,135, up by 4.8% in the past 24 hours.


Log in to Reply
Log in to comment your thoughtsComments