XRP’s Stunning Correlation With Russell 2000 Revealed: Why This 2026 Pattern Is A Market Game-Changer

Forget isolated crypto charts—XRP is now moving in lockstep with the heartbeat of small-cap America.
The Mirror No One Saw Coming
It's not just a coincidence. The correlation between XRP's price action and the Russell 2000 index has tightened to near-perfect synchronicity. When small-cap stocks take a breath, XRP exhales. When they rally, the digital asset surges in tandem. This isn't about following Bitcoin anymore—it's about tracking traditional market sentiment in real-time.
Why This Connection Matters Now
Institutional money flows where it sees familiar patterns. The Russell 2000 represents the ambitious, growth-oriented segment of the traditional economy—the exact profile of companies most likely to adopt blockchain solutions. XRP's mirroring suggests the market now views it less as a speculative crypto play and more as a tech infrastructure bet, priced alongside its potential enterprise customers.
The Liquidity Lifeline
This correlation creates a dual-edged sword. On one hand, it provides a predictable liquidity anchor from traditional finance—something most cryptocurrencies desperately lack. On the other, it tethers XRP to the whims of Federal Reserve policy and economic cycles, dragging it into debates about interest rates and recessions. Welcome to the big leagues, where monetary policy statements matter more than Twitter hype.
What Traders Are Missing
Most crypto analysts still stare at blockchain metrics while ignoring the macroeconomic dashboard. The real signal now comes from small-cap earnings reports, manufacturing data, and jobs numbers—the same boring fundamentals that move every other asset class. The market has quietly decided XRP's value proposition aligns with real-world economic activity, not just crypto narratives.
The Institutional Green Light
This correlation acts as a risk management cheat sheet for traditional funds. Portfolio managers who understand small-cap volatility now have a framework for evaluating XRP—complete with hedging strategies and correlation matrices that compliance departments actually approve. It's the bridge crypto needed, built with spreadsheets instead of promises.
One cynical truth emerges: Wall Street only embraces innovation when it can be modeled in Excel. XRP's Russell 2000 mirroring provides that comfortable spreadsheet logic, wrapping blockchain disruption in the familiar language of beta coefficients and sector rotation—proving once again that finance will adopt any technology, provided it can be reduced to a quarterly report.
The takeaway? XRP isn't just chasing crypto trends anymore. It's being priced as the digital infrastructure for the next generation of small businesses—making its chart a proxy for Main Street ambition in a digital age. Watch the Russell if you want to know where XRP is heading next.
XRP Chart Mirrors Russell 2000 Index Trend
A new technical analysis by market analyst Austin compares XRP’s recent price action with historical price movements of the Russell 2000 index. In an X post, the analyst shared two parallel charts, explaining that in late 2021, the Russell 2000 underwent a massive rally followed by a lengthy period of accumulation and consolidation from 2022 through most of 2024.
When the small-cap index eventually retested its all-time highs in late 2024, it formed a sharp Elliott Wave ABC corrective pattern that shook out weak hands. Following this, the index staged a dramatic V-bottom reversal in early 2025 and broke out into full price discovery territory.
According to Austin’s analysis, XRP’s current chart appears to mirror a nearly identical blueprint to the Russell 2000 price action between 2021 and 2025. After its own massive pump and prolonged accumulation phase, XRP recently surged to retest its previous all-time high resistance NEAR the $3.30 level on the chart. Following that retest, the cryptocurrency entered a similar ABC correction, mirroring almost step by step the movements of the Russell 2000 before its explosive breakout.
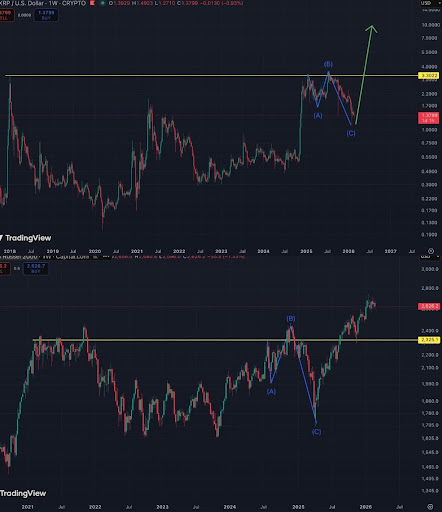
Notably, the chart reveals that the A and B waves of the corrective three-wave pattern have already completed, and the price is currently working through the C wave. The chart structure suggests a potential crash to the $1.00-$1.27 range before any meaningful reversal attempt. If this occurs, it WOULD represent a decline of roughly 5.22%- 25.37% from current levels of around $1.34.
The key question Austin is now asking is whether the token is on the verge of the same V-bottom inflection point that was observed in the Russell 2000 chart. If history repeats and structural parallel holds, the analyst suggests that the XRP correction currently unsettling holders could be the final shakeout before a launch into price discovery.
Analyst Shares Targets For Price Discovery
The most important aspect of the Russell 2000 analysis is the potential for XRP to enter price discovery mode and begin trading above its 2018 all-time high. The green arrow projection on the price chart points toward price discovery targets well above $5.
Once XRP completes its wave C correction, Austin predicts that the cryptocurrency could rapidly launch to the $7.5 to $10 range. With its price still hovering below $1.4, a breakout to $10 would represent a staggering increase of more than 645%.
