Capital Rotation Intensifies: Bitcoin Lags Behind Gold and US Equities in 2026’s Great Reallocation

Money's on the move—and digital gold is getting left in the dust.
The great capital rotation of 2026 is picking up speed, with traditional safe havens and equity markets siphoning flows away from the crypto pioneer. While Bitcoin's narrative once promised an uncorrelated digital fortress, recent price action tells a different story: one of relative stagnation as other asset classes sprint ahead.
The Flight to Familiar Shores
Investors aren't just chasing yield; they're chasing certainty. Gold's timeless allure has resurfaced with a vengeance, acting as a pressure valve for macroeconomic anxiety. Meanwhile, US equities continue their relentless climb, fueled by AI breakthroughs and corporate efficiency drives that, for now, look more tangible than promises of a decentralized future.
Bitcoin's Liquidity Paradox
Here's the cynical finance jab: nothing makes a hedge fund manager reconsider their 'long-term HODL' stance like seeing better quarterly bonuses in someone else's portfolio. The very liquidity that makes crypto tradable also makes it abandonable when shiny objects appear elsewhere. Capital is loyal only to performance.
The rotation underscores a brutal truth in modern markets: everything is a trade. Bitcoin's test isn't just technological adoption; it's the weekly, daily, and hourly battle for attention and allocation in an ocean of alternatives. The king of crypto isn't being dethroned—it's being temporarily ignored for louder, faster-moving rivals.
Will this lag prove to be a buying opportunity or a sign of a maturing—and less explosive—asset class? The market's vote, measured in pure capital flow, is currently clear.
Institutional Exodus and Shrinking Liquidity Pressure
The report points to a clear institutional retreat that is weighing heavily on Bitcoin’s market structure. The Coinbase Premium Index, a key proxy for US institutional demand, remains deeply negative and recently reached a periodic low of -0.169%. This signals that selling pressure during US trading hours is materially stronger than the global average.
Notably, the index has turned positive only twice throughout January, reinforcing the view that institutions and high-net-worth participants are actively deleveraging rather than accumulating exposure. Historically, sustained negative premiums of this magnitude tend to coincide with phases of distribution, not early-stage recoveries.

Compounding this weakness is the evaporation of market “dry powder.” The combined market capitalization of the top 12 stablecoins has contracted by $2.24 billion recently, extending a peak-to-trough decline of roughly $5.6 billion.
This behavior differs from the typical rotation into stablecoins seen ahead of dip-buying phases. Instead, it reflects a more concerning dynamic: capital exiting the crypto ecosystem entirely and moving back into fiat. Without sidelined liquidity ready to re-enter, upside reactions become structurally weaker and short-lived.
Caught between institutional selling and shrinking liquidity, Bitcoin’s near-term bias remains skewed to the downside. In a bearish scenario, key levels to monitor include the True Mean Price NEAR $81,000, the 2024 high around $70,000, and ultimately the 200-week moving average near $58,000.
Conversely, a bullish outcome WOULD likely require an extended period of sideways consolidation, allowing overhead supply to be absorbed while stablecoin inflows recover and fresh capital gradually returns.
Bitcoin Remains Trapped Below Key Moving Averages
Bitcoin continues to trade under pressure, with the price hovering near the $88,000 area after failing to reclaim higher resistance levels. The chart shows a clear sequence of lower highs since the October peak near $125,000, confirming that the broader structure has shifted from trend continuation to distribution and consolidation. Each recovery attempt has been capped below descending moving averages, reinforcing the loss of upside momentum.
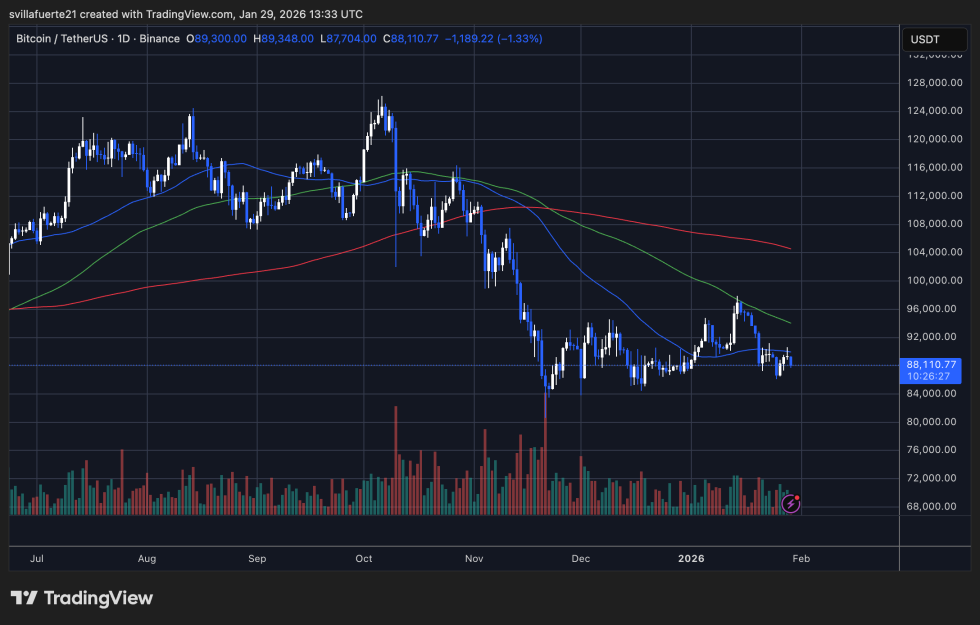
Price remains below the 50-day and 100-day moving averages, both of which are now sloping downward and acting as dynamic resistance around the $95,000–$98,000 zone. The 200-day moving average sits higher, near the $105,000 area, and continues to define the long-term trend boundary. As long as BTC trades below these levels, rallies are likely to be corrective rather than impulsive.
On the downside, the $85,000–$87,000 region has emerged as an important short-term support, coinciding with recent consolidation lows. The sharp sell-off in November, followed by a high-volume bounce, suggests forced deleveraging rather than organic accumulation. Since then, volume has steadily declined, pointing to reduced participation and a lack of strong directional conviction.
Bitcoin appears locked in a compression phase. Without a decisive reclaim of the mid-range moving averages, the risk remains skewed toward further downside tests. Conversely, sustained acceptance above $95,000 would be required to shift the short-term bias back toward stabilization rather than continuation of the corrective trend.
Featured image from ChatGPT, chart from TradingView.com
