Bitcoin On-Chain Signals Delay Bull Thesis: MVRV Model Projects Recovery Next Cycle

Bitcoin's on-chain metrics flash caution—the bull run hits pause. Key indicators suggest the market needs another cycle to reset.
Decoding the MVRV Signal
The Market Value to Realized Value ratio—a favorite among chain analysts—paints a sobering picture. It tracks whether Bitcoin trades above or below its 'fair value' based on historical acquisition prices. Right now, it whispers 'not yet.'
Why the Delay?
Previous cycles saw parabolic moves fueled by retail frenzy and leveraged speculation. This time, the data shows a more measured, almost reluctant, accumulation phase. Large holders aren't dumping, but they're not aggressively buying either—creating a holding pattern that frustrates momentum traders.
The Next Cycle Playbook
History doesn't repeat, but it often rhymes. The model projects a reset, where undervalued conditions typically precede the next major leg up. It's a waiting game that separates patient capital from the hot money chasing quick flips—the latter being the same crowd that thinks 'diversification' means holding three different meme coins.
For now, the blockchain ledger suggests sitting tight. The real move, according to the math, is still on the horizon.
Bitcoin MVRV Spread Signals a Deep Bear Phase
Adler’s analysis highlights one of the clearest structural indicators pointing toward sustained bearish conditions: the bitcoin MVRV Z-Score Bull vs. Bear Market model. Specifically, he notes that the 30-day to 365-day MVRV spread is deeply negative and continues to deteriorate.
This spread measures the difference in profitability between short-term and long-term holders, and when the short-term cohort is underperforming significantly, it traditionally signals risk aversion, exhaustion, and weakening demand.
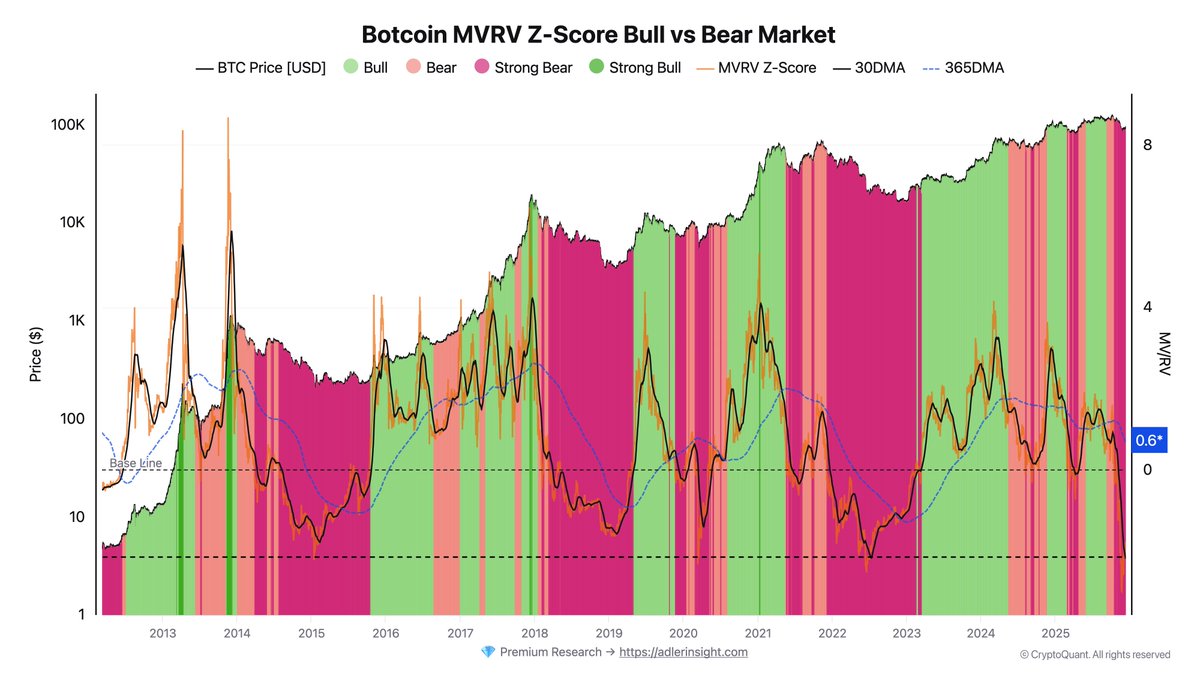
A crossover—when the 30-day MVRV rises above the 365-day metric—has historically marked the transition from bear markets into new bullish phases. However, Adler stresses that such a crossover does not appear imminent under current conditions. The spread remains far below the threshold required for a structural reversal, reinforcing the view that Bitcoin is still entrenched in a DEEP bear phase within this model’s framework.
Cycle analogs further support this interpretation. Reviewing past market cycles, Adler estimates that the next likely window for a meaningful crossover sits in the second half of 2026. This implies that even if short-term rallies occur, they are more likely to be counter-trend bounces rather than the early stages of a sustainable bull market. Until the MVRV structure improves, broader sentiment may remain decisively bearish.
Price Struggles to Recover Momentum
Bitcoin continues to move sideways, reflecting a market that remains indecisive and structurally weak. The chart shows BTC trading NEAR $92,000 after its sharp decline from the $120,000 region, with recent candles forming a tight consolidation range. This behavior typically signals a temporary stabilization phase rather than a confirmed reversal, especially given the broader bearish context highlighted by on-chain and macro indicators.
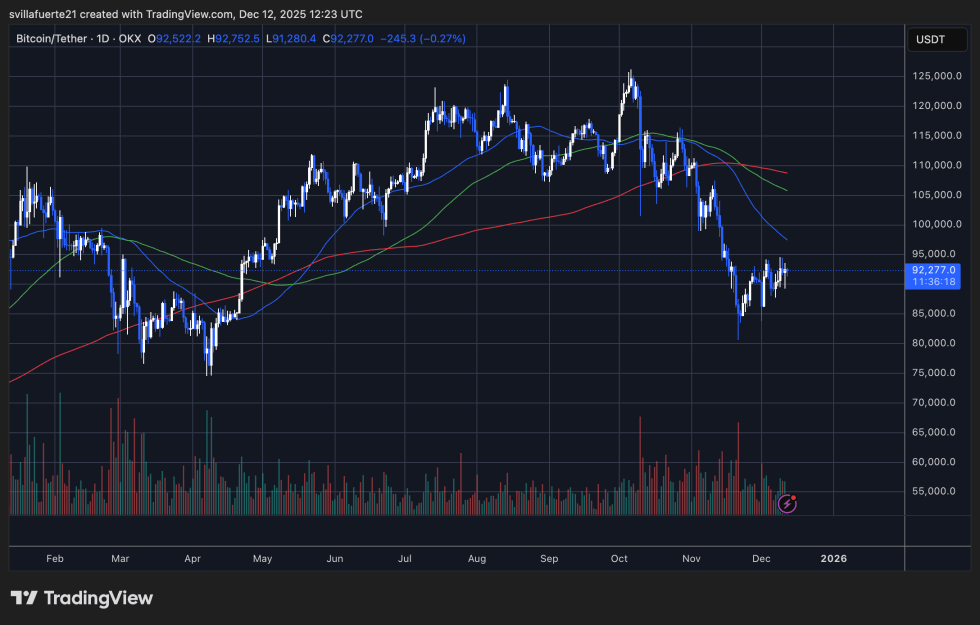
The 50-day moving average sits well above the current price, acting as dynamic resistance and indicating that short-term momentum remains firmly bearish. Likewise, the 100-day and 200-day moving averages trend downward, creating a compression zone that BTC has yet to challenge. Until Bitcoin can reclaim these levels with conviction, rallies may continue to be faded by sellers.
Despite the small rebound from sub-$90,000 levels, buying activity remains muted compared to the heavy sell volume that drove the initial breakdown. This suggests that demand is insufficient to absorb higher-timeframe selling pressure.
Structurally, Bitcoin is forming lower highs and lower lows across the daily timeframe, reinforcing a downtrend. A decisive break below $90,000 WOULD expose deeper liquidity zones near $86,000–$84,000. Conversely, reclaiming $96,000 would be the first sign of strength—but current price action shows no such momentum yet.
Featured image from ChatGPT, chart from TradingView.com
