Ethereum Net Taker Volume Bottoms Rise: A Repeat Of The 2025 Pre-Rally Setup?

Ethereum's net taker volume just bottomed. Again. The charts whisper what traders already feel—deja vu from the last setup before everything went vertical.
The Signal in the Noise
Forget the daily noise. This metric cuts through it. Net taker volume tracks the aggressive buyers versus the desperate sellers. When it climbs from the depths, it doesn't signal a gentle shift. It screams that conviction is returning, that big money is placing its bets before the crowd even notices.
History Doesn't Repeat, But It Rhymes
The pattern from the last cycle is the ghost in this machine. A similar crawl off the lows preceded a run that left skeptics scrambling. It wasn't magic—it was simple market mechanics. Capitulation ends. Accumulation begins. The smart money moves first, often while the headlines are still screaming about the latest regulatory hiccup or some CEO's dubious NFT purchase.
Why This Time Could Be Different (Or Brutally the Same)
The ecosystem isn't static. Layer-2 networks now handle the coffee purchases, freeing the main chain for the serious business. Staking dynamics have reshaped supply. Each cycle writes its own rules on a more complex ledger. But human psychology? That code hasn't been forked. Greed and fear still compile the same executable.
The setup is there. The volume hints at a turn. Whether it triggers another historic leg up or just another head-fake for the over-leveraged remains the multi-billion dollar question. One thing's certain: in crypto, the only thing more predictable than a boom is a chorus of finance bros claiming they saw it coming all along—right after their stop-losses get liquidated.
Net Taker Volume Signals a Potential Structural Shift
According to CryptoQuant’s CoinCare, ethereum may once again be approaching a pivotal turning point. The report highlights that a similar Net Taker Volume structure appeared earlier this year. After forming a clear bottom in January 2025, the metric began to trend upward—even while remaining in the negative zone—indicating that aggressive sellers were gradually losing strength.

By April, Net Taker Volume flipped decisively into positive territory. From that exact moment, Ethereum entered one of its strongest rallies of the cycle, surging more than 3x and printing a new all-time high.
Current conditions echo that same pattern. Since the peak of selling pressure in September, the market has continuously absorbed sell flows for nearly three months. Each negative low in Net Taker Volume has formed higher than the previous one, revealing improving market resilience despite the broader downtrend. If this trajectory holds, CoinCare estimates that a positive flip in Net Taker Volume may be only about a month away.
Historically, this transition from negative to positive has marked the beginning of Ethereum’s most explosive breakout phases. A confirmed move into positive territory WOULD represent a high-probability trigger for the next expansion toward new all-time highs, signaling that momentum is quietly rebuilding beneath the surface.
ETH Weekly Structure Attempts a Recovery
Ethereum’s weekly chart shows the market attempting to stabilize after several weeks of volatility, with price currently trading NEAR $3,195 following a strong rebound from the $2,800 zone. This area acted as a key demand region in mid-2024 and has once again provided support, preventing a deeper breakdown. The recent weekly candle reflects renewed buying interest, closing firmly above the 50-week moving average, a level that often defines medium-term trend direction.
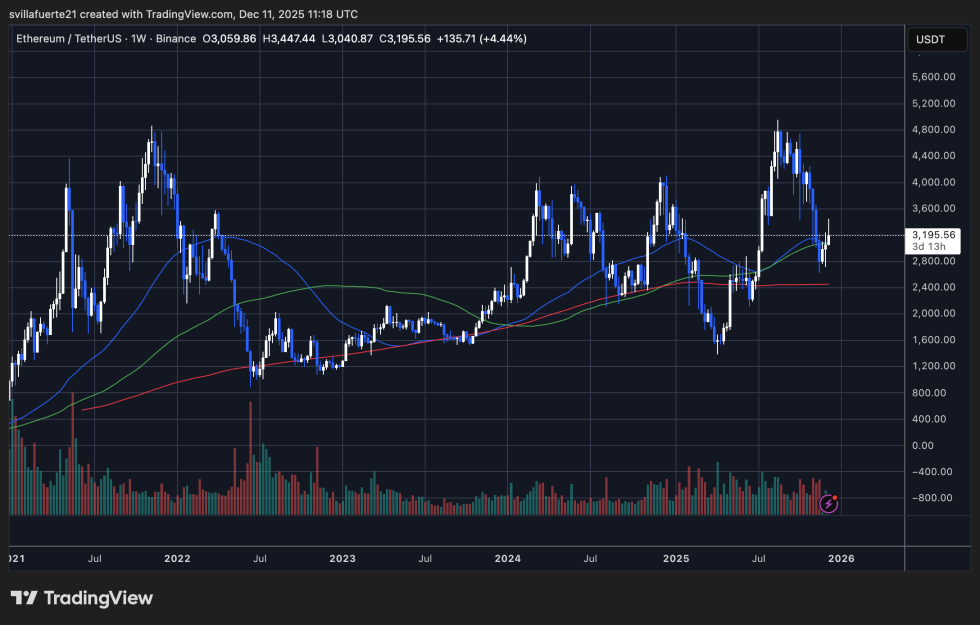
Despite this rebound, ETH still faces structural challenges. The 100-week moving average — now overhead — has acted as resistance throughout the current downtrend, and the price rejected it again on the latest push toward $3,447. Until Ethereum can reclaim this dynamic resistance with conviction, the broader trend remains neutral to slightly bearish.
Volume also shows a notable shift: sell-side activity has been declining over the past month, while buyers are beginning to step in more aggressively at key support levels. This aligns with the improvement in on-chain metrics, suggesting weakening selling pressure.
For bulls, the next major objective is a weekly close above $3,400, which would signal a potential trend reversal. A failure to break this level, however, risks another retest of $2,900–$2,800, where market sentiment would again be tested.
Featured image from ChatGPT, chart from TradingView.com
