FOMC Week Playbook: Bitcoin’s Pattern Repeats Twice—Will It Happen Again?

Bitcoin faces its Federal Reserve stress test—again.
The digital asset has mirrored its own price action around the last two Federal Open Market Committee meetings with uncanny precision. Each time, anticipation built, volatility spiked, and a clear directional move followed the policy announcement. Now, as traders brace for another round of central bank speak, the question isn't just about interest rates—it's whether crypto's flagship asset will stick to its recently established script.
The Setup: A Predictable Dance
Forget complex models. The recent pattern is straightforward: a pre-meeting consolidation, a knee-jerk reaction to the Fed's statement, and a sustained trend that emerges in the days after. It's a cycle that has played out with enough consistency to turn heads from crypto Twitter to Wall Street trading desks. The mechanics are familiar to any market veteran, though watching a decentralized asset respond so neatly to centralized policy still delivers a dose of irony.
Why This Time Could Be Different
Markets are learning machines, and patterns that become obvious tend to break. The sheer awareness of this 'FOMC playbook' might alter the behavior of algorithmic and human traders alike. Furthermore, the macroeconomic backdrop isn't static—each meeting occurs in a new context of inflation data, employment figures, and global liquidity shifts. Relying solely on historical precedent is a classic trap, often favored by analysts who'd rather backtest than forecast.
The Trading Floor Verdict
Watch for the deviation, not the repetition. If Bitcoin adheres to the pattern, it confirms a growing maturity in its correlation to macro liquidity events. If it breaks form, it signals a decoupling or a shift in the dominant market driver. Either outcome provides critical intelligence. The only losing move is assuming the past guarantees the future—a belief as reliably profitable as a Wall Street analyst's year-end target price.
Place your bets. The Fed speaks, and the market will answer. Whether Bitcoin follows its recent playbook or tears it up will reveal more about its character than any press conference ever could.
Market Positioning Meets Macro Reality
Rather than simply repeating past rate-cut reactions, the current setup requires placing Bitcoin’s behavior in the broader macroeconomic landscape—a landscape that looks very different from previous cycles. While XWIN Research highlights the historical “up first, down later” pattern around FOMC cuts, the real story lies in how today’s liquidity conditions interact with on-chain signals.
Stablecoin exchange reserves now reflect not just crypto sentiment but the macro backdrop. With the US nearing the end of quantitative tightening and global liquidity subtly improving, rising stablecoin reserves would confirm that investors are preparing to deploy capital into risk assets.
If reserves remain flat or decline, it may indicate hesitation tied to uncertainty over inflation persistence or concerns about policy missteps.
Funding rates, meanwhile, must be interpreted through the lens of a market recalibrating after a 36% correction while still operating in a high-rate environment. Excessive long leverage during a macro turning point—especially if the Fed cuts earlier than expected—creates the perfect setup for volatility spikes.
Neutral or mildly positive funding, however, would suggest traders are not overextended, allowing bitcoin to absorb macro news more smoothly.

Ultimately, Bitcoin’s reaction to the FOMC will depend on the interplay between improving macro liquidity conditions and the internal positioning of the market. This cycle’s environment is more complex—and potentially more supportive—than prior rate-cut events, making risk-managed positioning more crucial than prediction.
Weekly Chart Shows Stabilization But Trend Still Vulnerable
Bitcoin’s weekly chart shows the market attempting to stabilize after a sharp multi-week correction, with price hovering around $91,800. The current candle is printing a modest rebound, signaling that buyers are stepping in NEAR the green 100-week moving average, a level that has acted as a cyclical support zone in past downturns. This reaction suggests that long-term participants are defending the structure, even as momentum remains weak.
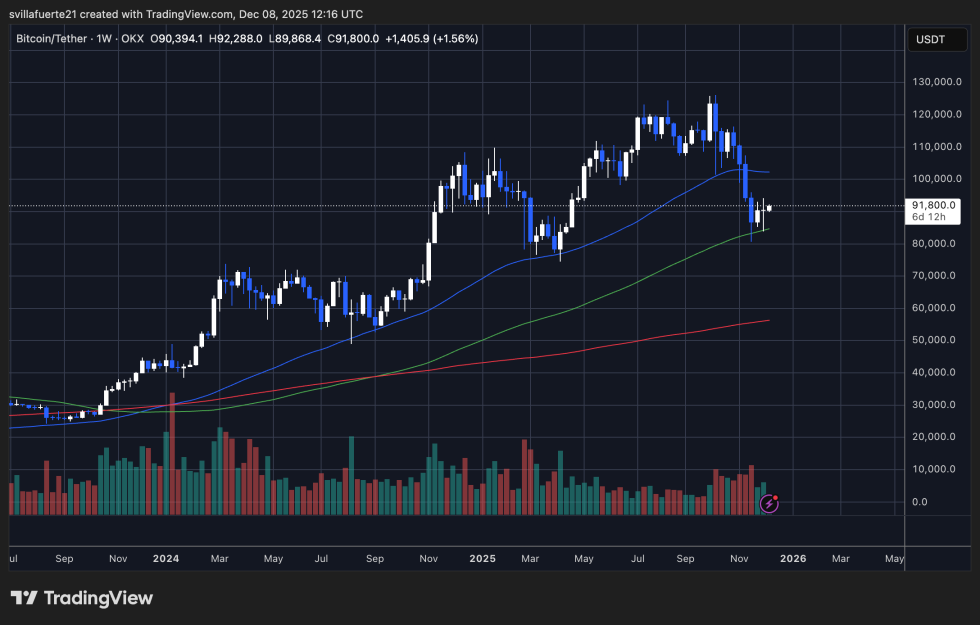
Despite the bounce, BTC continues to trade well below the 50-week moving average, which has curled downward—evidence that medium-term trend pressure still leans bearish. The breakdown from the $110K–$100K region triggered a decisive shift in sentiment, and the latest consolidation under $95K reflects a market still searching for direction rather than forming a clear recovery trend.
Volume also tells an important story: selling spikes in recent weeks have been met with noticeably softer buy-side volume, indicating that bulls are present but not yet aggressive. Until a sustained surge in demand appears, rallies near the 50-week MA are likely to face resistance.
If Bitcoin holds the 100-week MA and forms higher weekly lows, a recovery phase could build. Failure to maintain this zone, however, WOULD expose deeper downside levels and confirm a broader trend reversal.
Featured image from ChatGPT, chart from TradingView.com
