XRP Capitulation: Investors Bleeding $75 Million Daily - But Smart Money Sees Opportunity

XRP holders face brutal reality check as panic selling accelerates
The Great Unwinding
Digital asset markets witness one of the most dramatic capitulation events of the year. XRP investors collectively realize $75 million in losses every single day - a staggering figure that underscores the depth of current market pessimism.
Blood in the Streets
While mainstream headlines focus on the carnage, seasoned crypto veterans recognize this classic fear pattern. Mass liquidation events often precede major trend reversals. The very panic driving current selling pressure typically exhausts itself, creating fertile ground for the next rally.
Silver Linings Playbook
History doesn't repeat but it often rhymes. Previous crypto winters saw similar mass capitulation before explosive recoveries. Current losses represent forced selling rather than fundamental deterioration - a crucial distinction that separates temporary pain from permanent impairment.
Wall Street's oldest adage applies perfectly here: the time to buy is when there's blood in the streets, even if some of it is your own. Though traditional finance types will undoubtedly use this as another 'I told you so' moment about crypto volatility.
XRP Blockchain Is Going Through A Capitulation Event
In a new post on X, on-chain analytics firm Glassnode has discussed about the latest trend in the Realized Loss for XRP. This indicator measures, as its name suggests, the total amount of loss that traders on the XRP network as a whole are “realizing” through their transactions.
The metric works by going through the transaction history of each token being sold to see what price it was moved at prior to this. If the last transaction price for any coin was more than the value that it’s now being moved at, then the token’s sale is realizing some net loss.
The exact amount of loss harvested in the transfer is naturally equal to the difference between the two prices. The Realized Loss sums up this value for transactions across the network to find the total situation.
Like the Realized Loss, there is also an indicator called the Realized Profit, keeping track of the transactions of the opposite type. That is, it accounts for the sales involving a cost basis lower than the latest price.
Now, here is the chart shared by Glassnode that shows the trend in the 30-day exponential moving average (EMA) XRP Realized Loss over the last few years:
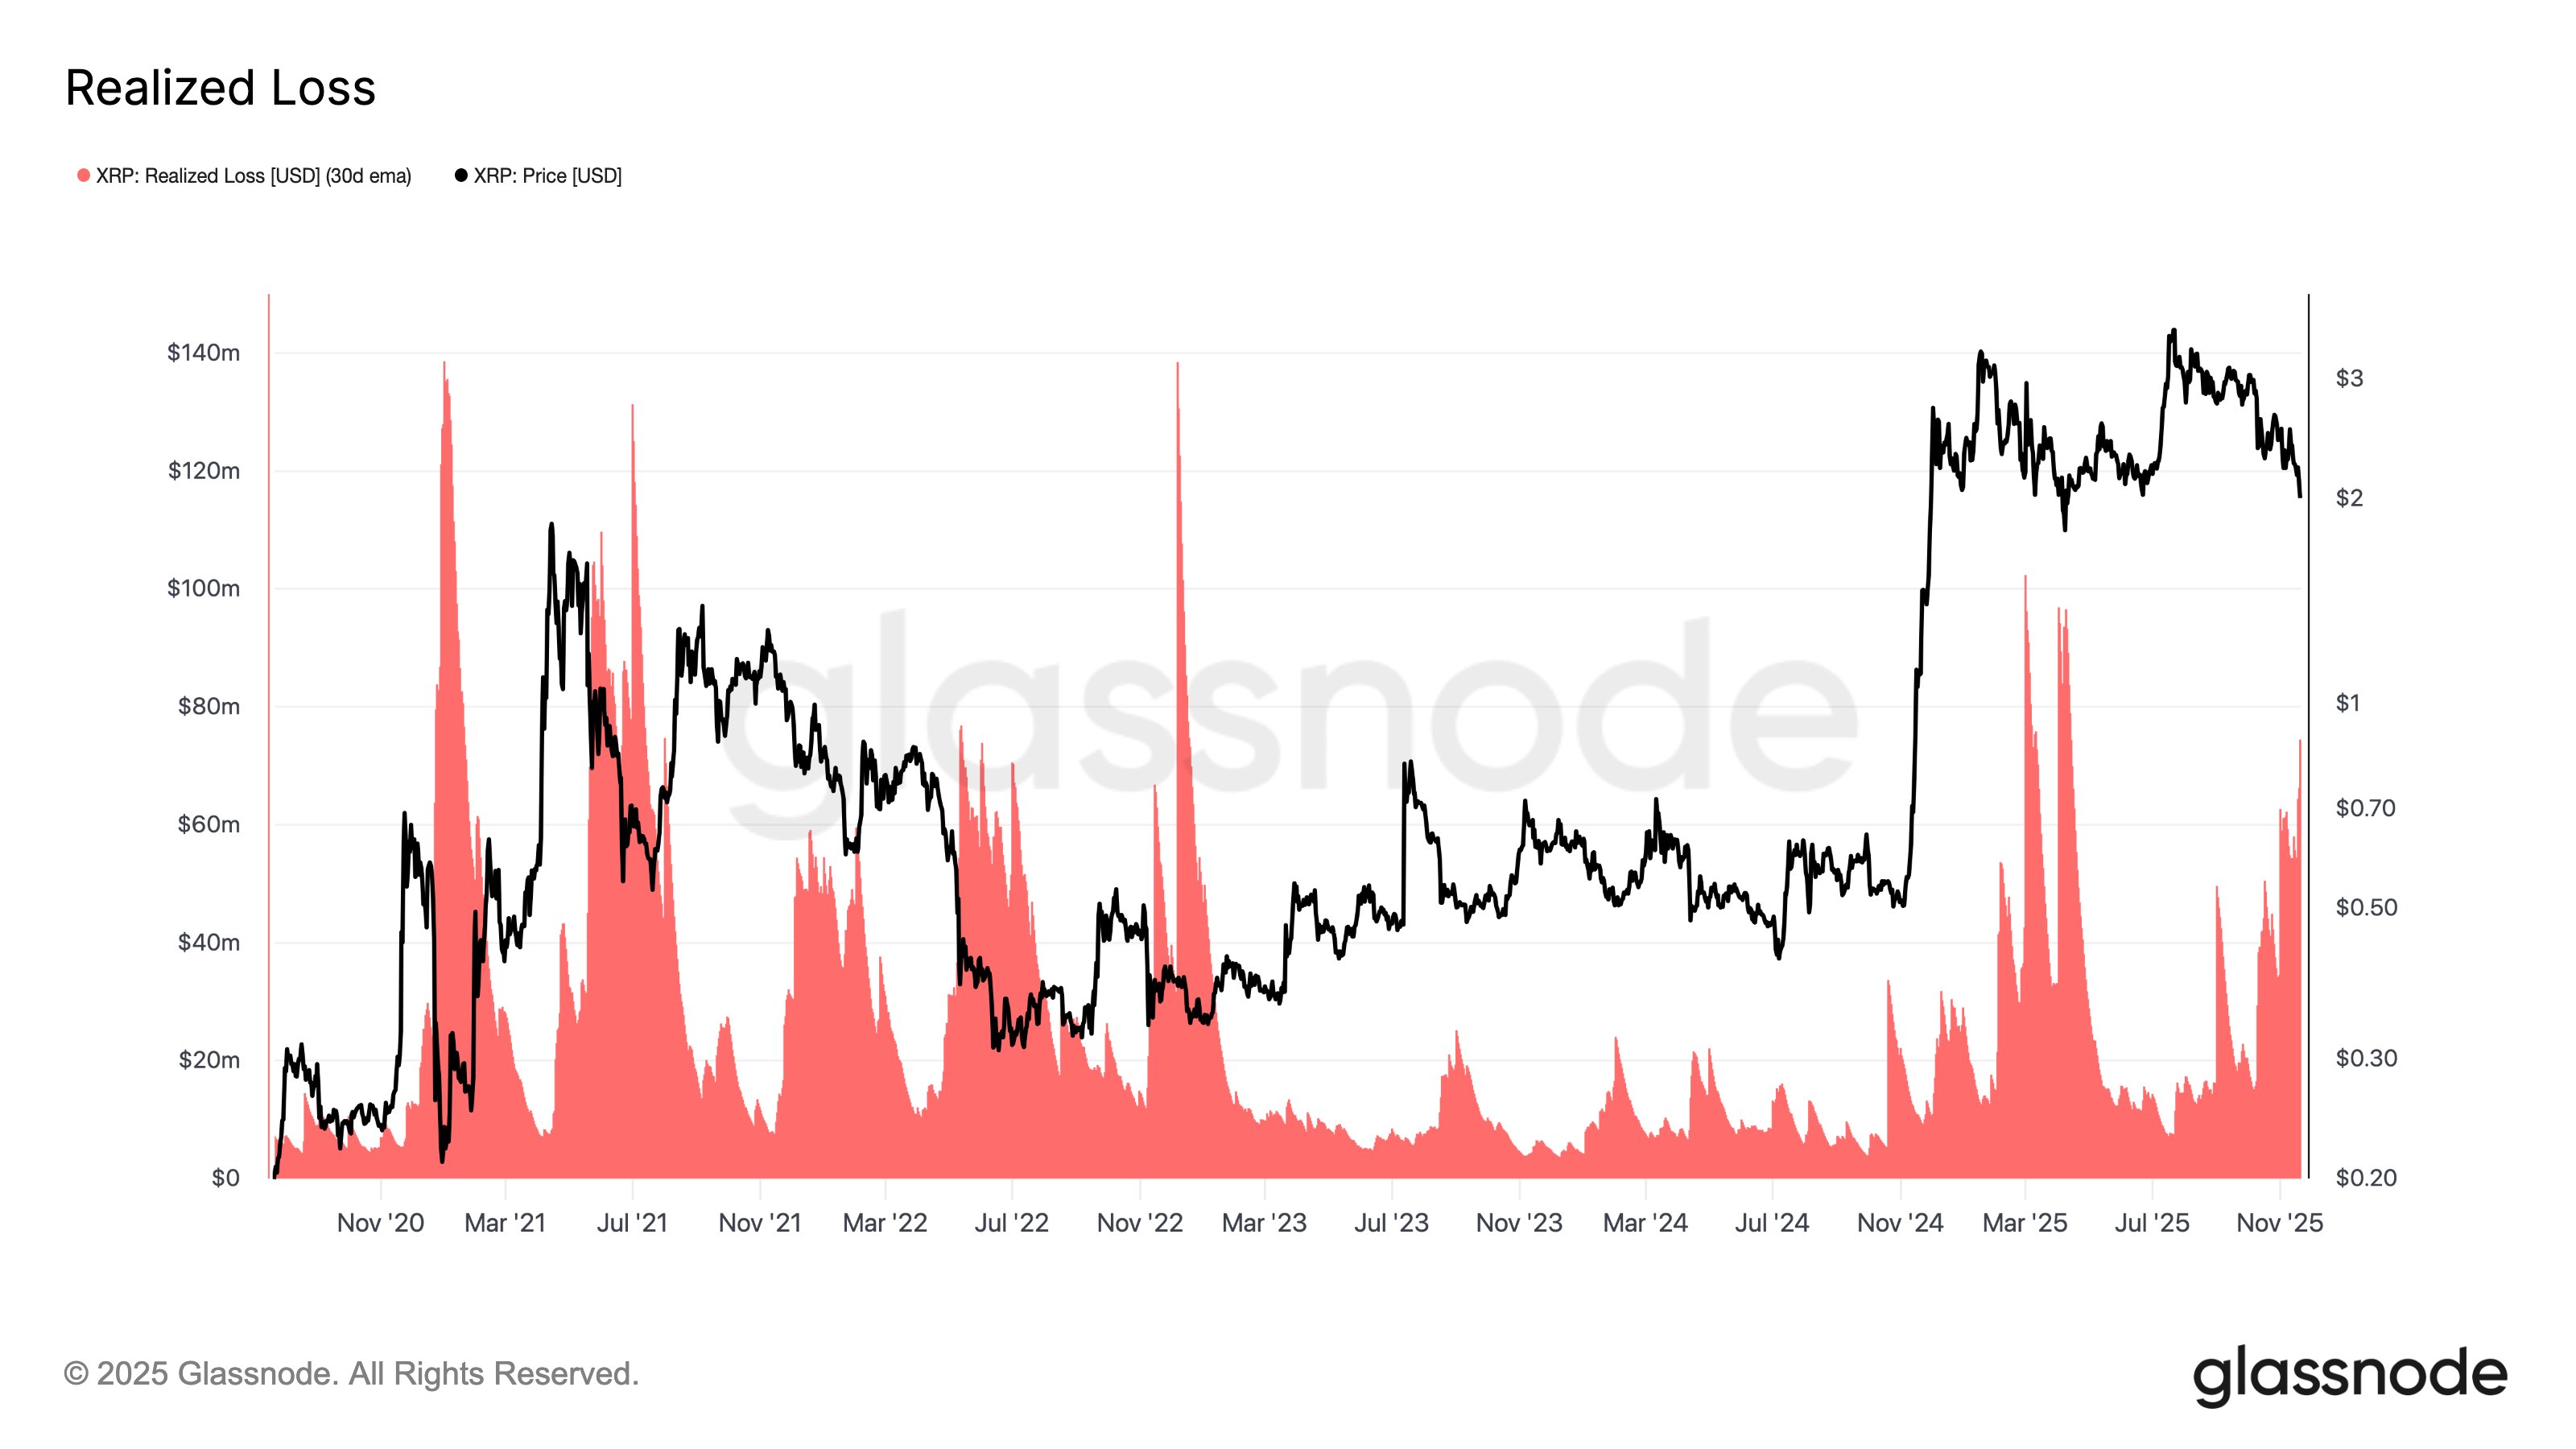
As displayed in the above graph, the XRP Realized Loss has witnessed a strong surge recently, indicating investors have ramped up loss taking. This trend has emerged as the cryptocurrency’s price has gone through its crash.
The indicator’s 30-day EMA value is now sitting at around $75 million, which is the highest that it has been since April 2025. Back then, the spike in loss realization led to a bottom for the asset.
Historically, this same pattern has often appeared, with spikes in the Realized Loss coinciding with or forming NEAR price lows. The explanation behind the pattern could be that such capitulation events result in coins moving from weak hands to more resolute entities, who hold off on selling, allowing the bearish trend to reach a state of exhaustion.
For now, the metric is still notably under the highs from earlier in the year, so it only remains to be seen whether XRP investor capitulation has been of a sufficient degree to force at least a local bottom or not.
XRP Price
Bearish momentum has continued in the cryptocurrency sector during the past day, and XRP has been no exception as its price has plummeted to the $1.89 mark. In fact, the coin has been among the worst weekly performers, sitting 17.5% down, better than only Cardano’s return among the top 20 coins by market cap.
