Bitcoin’s $30K Question: Bearish Signal Warns of Potential 70% Plunge

Bitcoin faces its moment of truth as technical indicators flash red across trading screens.
The $30,000 psychological barrier looms large while analysts point to disturbing patterns suggesting a massive correction could be brewing.
Technical Breakdown
That ominous bearish indicator everyone's whispering about? It's pointing toward a potential 70% decline from current levels. Market veterans are dusting off their 2018 playbooks as volatility returns with a vengeance.
Meanwhile, institutional money remains cautious—apparently Wall Street still needs coffee before jumping into crypto's wild ride. The smart money's watching for whether Bitcoin can hold key support levels or if we're about to witness another classic crypto rollercoaster drop.
Because nothing says 'stable store of value' like the possibility of losing two-thirds of your investment overnight.
BTC Price At Risk Of 70% Correction: Analyst
In an October 24 post on the social media platform X, crypto analyst Ali Martinez put forward a bearish outlook for the price of Bitcoin. The online pundit revealed that the market leader might have returned to a familiar position that has often led to significant losses (approximately 70%) in the past.
This bearish prediction is based on the changes in the Moving Average Convergence/Divergence (MACD) indicator, which shows the relationship between moving averages of an asset’s price (the Bitcoin price, in this context). Typically, a cross of the MACD line above the signal line is a bullish sign for the asset’s price.
Meanwhile, when the MACD line crosses beneath the signal line, it indicates that the asset might be taking a bearish structure. As seen in the highlighted chart, the Bitcoin MACD line just crossed below the signal line on the monthly timeframe, which means that the flagship cryptocurrency could be gearing up for an extended period of downward price movement.
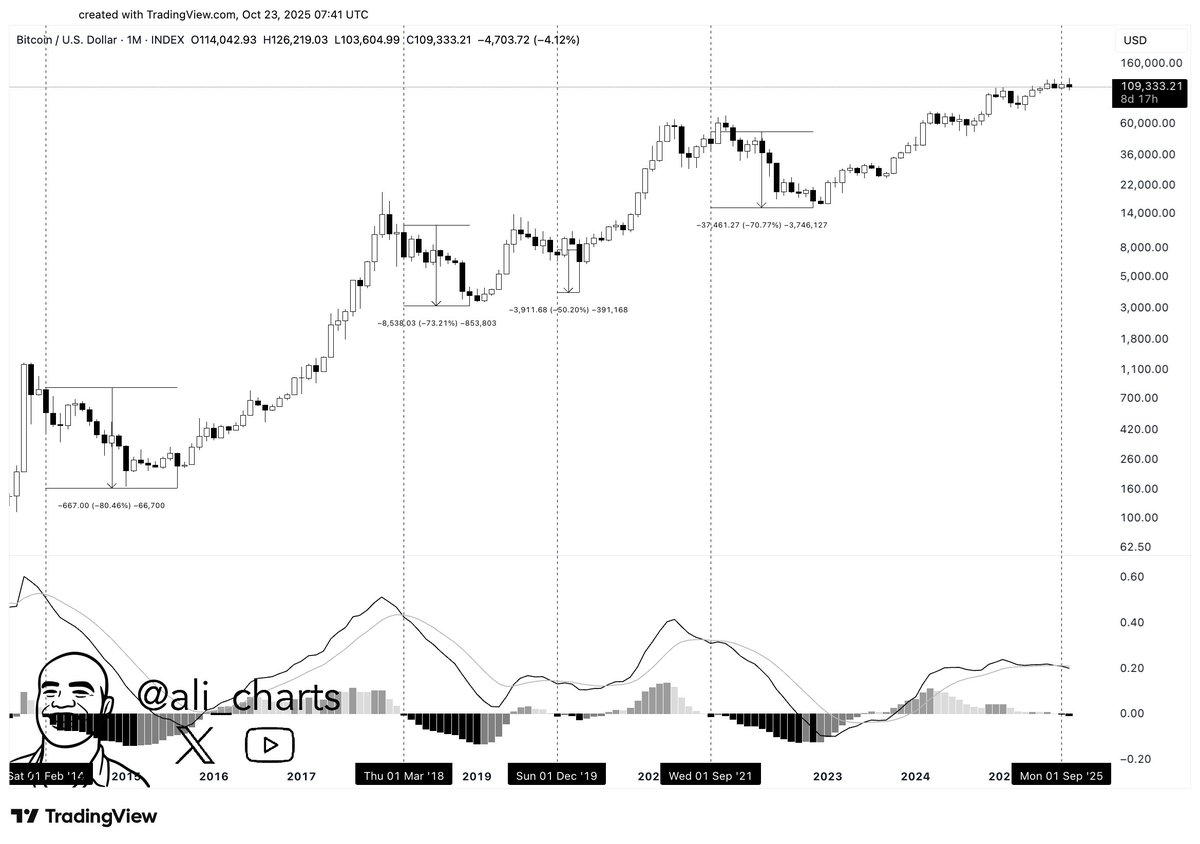
What’s more striking is the historical performance of the bitcoin price whenever this MACD crossover occurs. According to Martinez, the price of BTC has seen an average drop of 70% in the last four occasions this indicator flipped to negative.
The last time the Moving Average Convergence/Divergence indicator turned bearish was in September 2021, starting the eventual descent of the market leader to around $16,000 mark in November 2022. As shown in the chart, the Bitcoin price fell by more than 70% in this period.
If history is to go by, this means that the price of BTC is at risk of a 70% decline over the next few months, putting the target at around $33,000 from the current price point.
Bitcoin Price At A Glance
As of this writing, the price of BTC stands at around $110,540, reflecting no significant change in the past 24 hours.
