Bitcoin Coin Days Destroyed Plummets 50% As Prices Stagnate - Here’s The Real Significance

Bitcoin's hidden metric screams louder than price charts ever could.
The Coin Days Destroyed Phenomenon
That 50% plunge in Coin Days Destroyed isn't just another statistic—it's the crypto equivalent of watching whales go into hibernation. Long-term holders are digging in, refusing to sell despite the market's sideways shuffle. Their coins gather digital dust while weak hands panic over every percentage point drop.
Market Psychology Unmasked
When veteran Bitcoiners stop moving their stacks, they're telegraphing one message: this isn't the top. They've seen this movie before—the boring middle act where retail investors get bored and Wall Street analysts suddenly become crypto experts. Meanwhile, the real accumulation happens in silence.
The Institutional Waiting Game
Traditional finance keeps waiting for Bitcoin to behave like a proper stock—it's like watching a fish expert complain that birds don't swim properly. The 50% CDD drop proves Bitcoin's supply dynamics remain fundamentally different from anything in legacy markets. No CEO can issue more Bitcoin during earnings calls.
Price stability isn't boring—it's accumulation in plain sight. While traders chase the next shiny meme coin, Bitcoin's foundation grows stronger through periods exactly like this. The real money isn't made during the frenzy, but during the quiet moments when everyone else is looking elsewhere.
HODL Wave Intensifies As Bitcoin CDD Falls
Bitcoin’s price continues to struggle with volatility, but on-chain metrics are flashing signs of renewed resilience. The newfound resilience is indicated by the BTC Coin Days Destroyed (CDD) metric, a key indicator of long-term holder activity, which has declined strongly in recent market trends.
Darkfost, a market expert and author, reported the decline in Coin Days Destroyed in a recent post on the social media platform X. This sharp drop implies that more experienced investors are retaining more coins rather than spending them, as evidenced by the fact that they are moving fewer coins.
Specifically, CDD is a highly pertinent metric to gauge the “firepower” of LTHs, as the metric takes into consideration the holding days of recently transferred BTC. According to Darkfost, CDD signals this at the exact moment of movement, providing an opportunity to predict selling pressure. It’s a powerful early indicator because when long-term holders MOVE their coins, they frequently do so with the intention of selling.
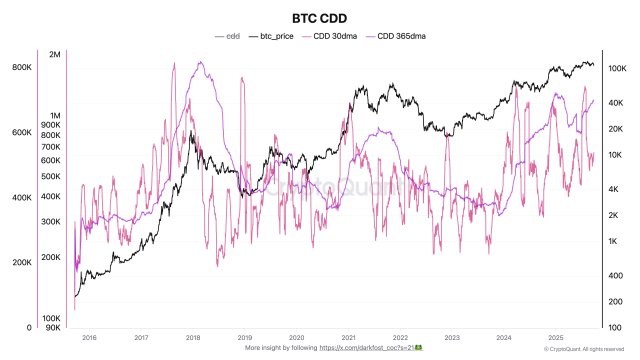
Looking at what’s going on with CDD, Darkfost highlighted that the activity on the LTH side finally appears to have slowed down. Historically, such developments have been linked to consolidation periods preceding new uptrends. Therefore, this change may be an indication of increased market confidence in Bitcoin’s long-term direction.
After reaching a monthly average record of almost 1.3 million BTC, the key CDD metric has now been cut in half to around 650,000 BTC. With the 50% decline, the metric is now back below the yearly average, which remains elevated.
BTC Long-Term Holders SOPR Exhibiting Weakness
In addition to the report, Darkfost has revealed a worrying trend in the Bitcoin Long-Term Holders Spent Output Profit Ratio (SOPR). Presently, long-term BTC holders seem to be showing subtle signs of fatigue, as their SOPR has weakened.
This indicator, which monitors whether coins moved on-chain are being sold for a profit or a loss, frequently captures more profound changes in the opinion of experienced investors. According to the expert, the major metric is now located at 1.26, marking its lowest level since February 2024.
On a monthly average basis, it has also experienced a significant decline, currently standing at 1.70, indicating a 70% average profit, following a peak of 3. Darkfost noted that the drop indicates that there is less selling pressure on LTH. Although the industry has changed, the analyst notes that the activity of long-term holders remains important to monitor due to their influence on the market.
