Why MemeCore’s ATH Might Signal the Start of Its Next Downtrend

MemeCore hits all-time high—traders brace for impact as euphoria meets reality.
The Peak Paradox
Every crypto surge carries the seeds of its own correction. MemeCore's recent ATH celebration masks underlying volatility that could trigger a sharp reversal. Retail investors pile in just as whales eye exit strategies.
Technical indicators flash overbought signals while trading volume shows deceptive strength. History repeats: remember how other meme coins cratered after similar rallies? This isn't different—just louder.
Market psychology shifts faster than blockchain confirmations. When everyone's boasting gains on social media, smart money already positions for the drop. The only thing rising faster than MemeCore's price? Leveraged long positions begging for liquidation.
Regulatory hawks circle trendy tokens, and let's be honest—most 'fundamental analysis' of meme coins is just hopium disguised as spreadsheet work. True value? That’s the real meme here.
Will MemeCore defy gravity or succumb to crypto's brutal cycles? The charts suggest a classic pump narrative—but narratives, like fortunes, can reverse in a single tweet.
MemeCore’s Rally Faces Exhaustion
Despite the HYPE surrounding M’s recent rally, in-chain data points to mounting sell pressure beneath the surface.
According to Coinglass, spot exchange inflows have rocketed to multi-week highs, indicating that investors have increasingly moved tokens onto exchanges to cash out from M’s rally to a new peak.
: Want more token insights like this? Sign up for Editor Harsh Notariya’s Daily crypto Newsletter here.
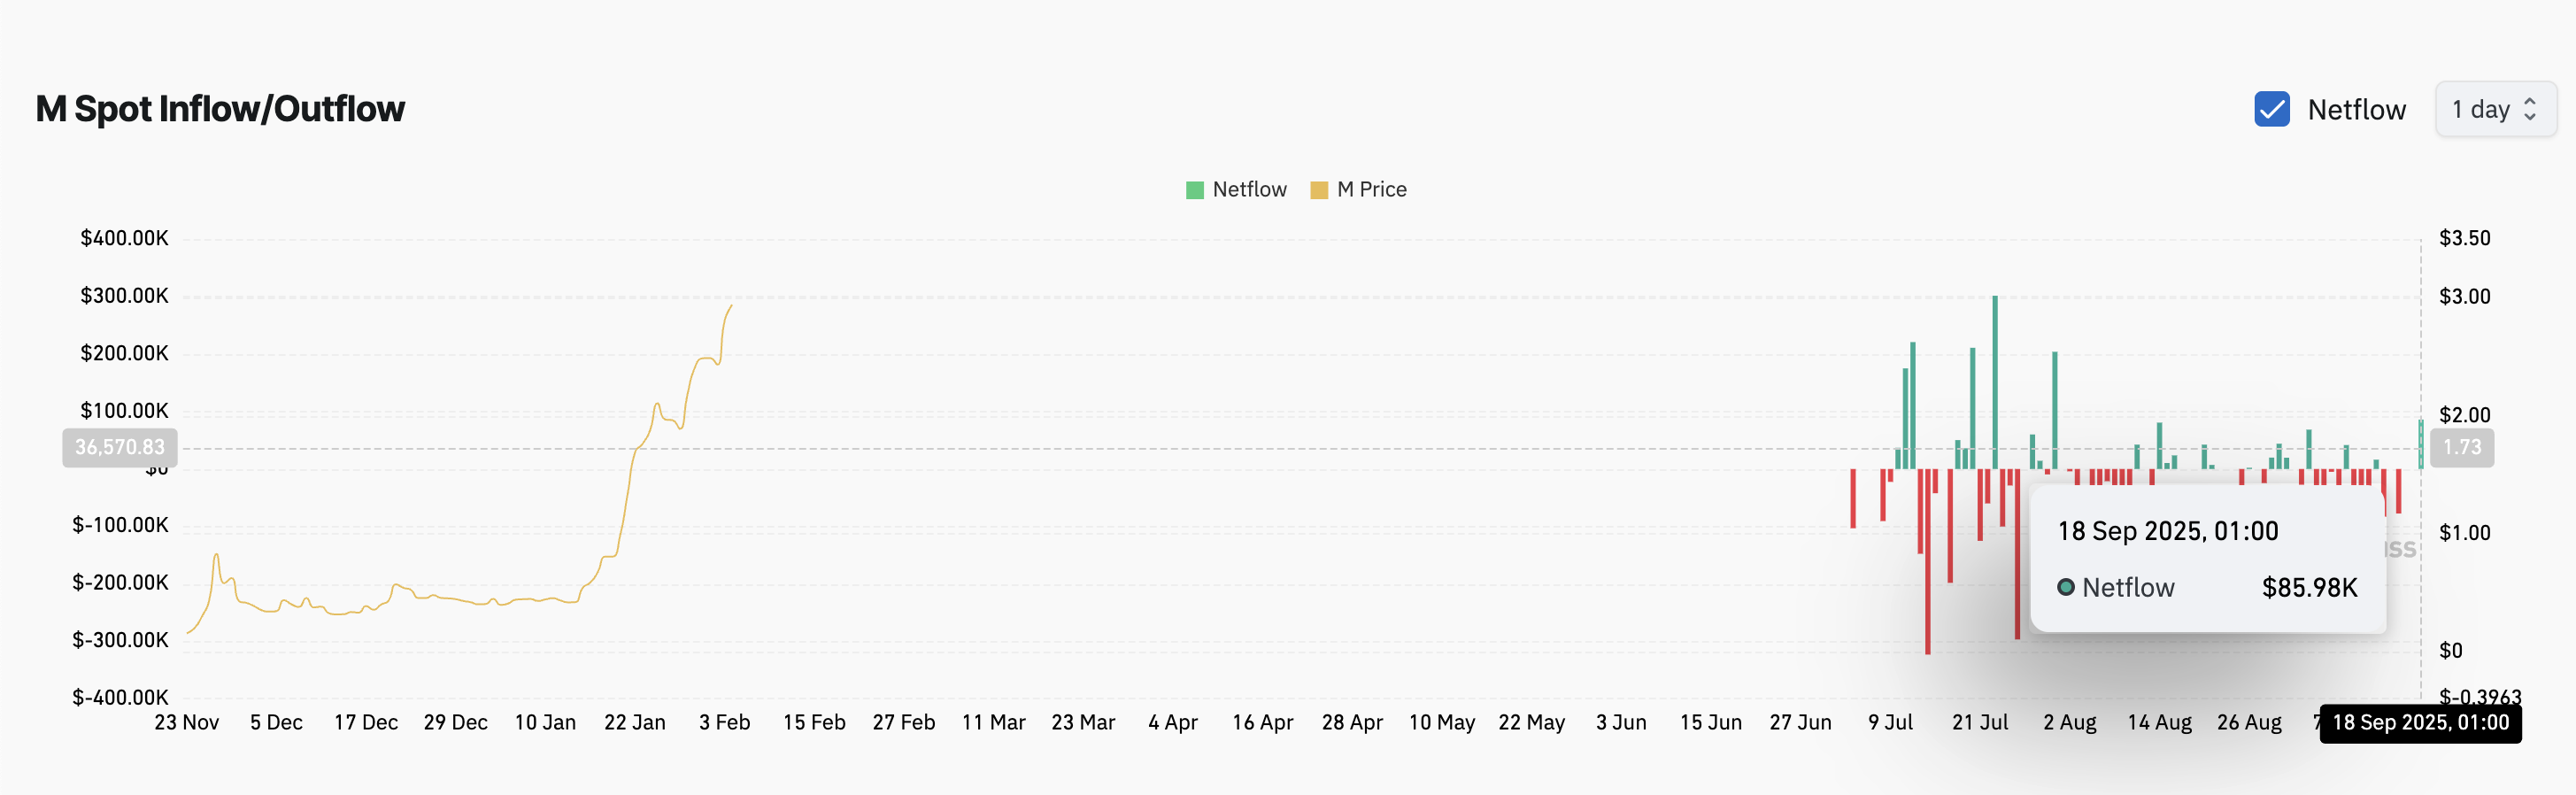
Typically, when an asset sees a rise in spot exchange inflows, it reflects a shift in sentiment from accumulation to distribution. Rather than holding tokens in private wallets, traders are depositing them on exchanges in preparation to sell.
This behavior signals that M’s bullish momentum is close to exhaustion and could give way to near-term weakness.
Furthermore, M’s Chaikin Money FLOW (CMF) has trended downward since September 16, gradually forming a bearish divergence with the token’s climbing price.
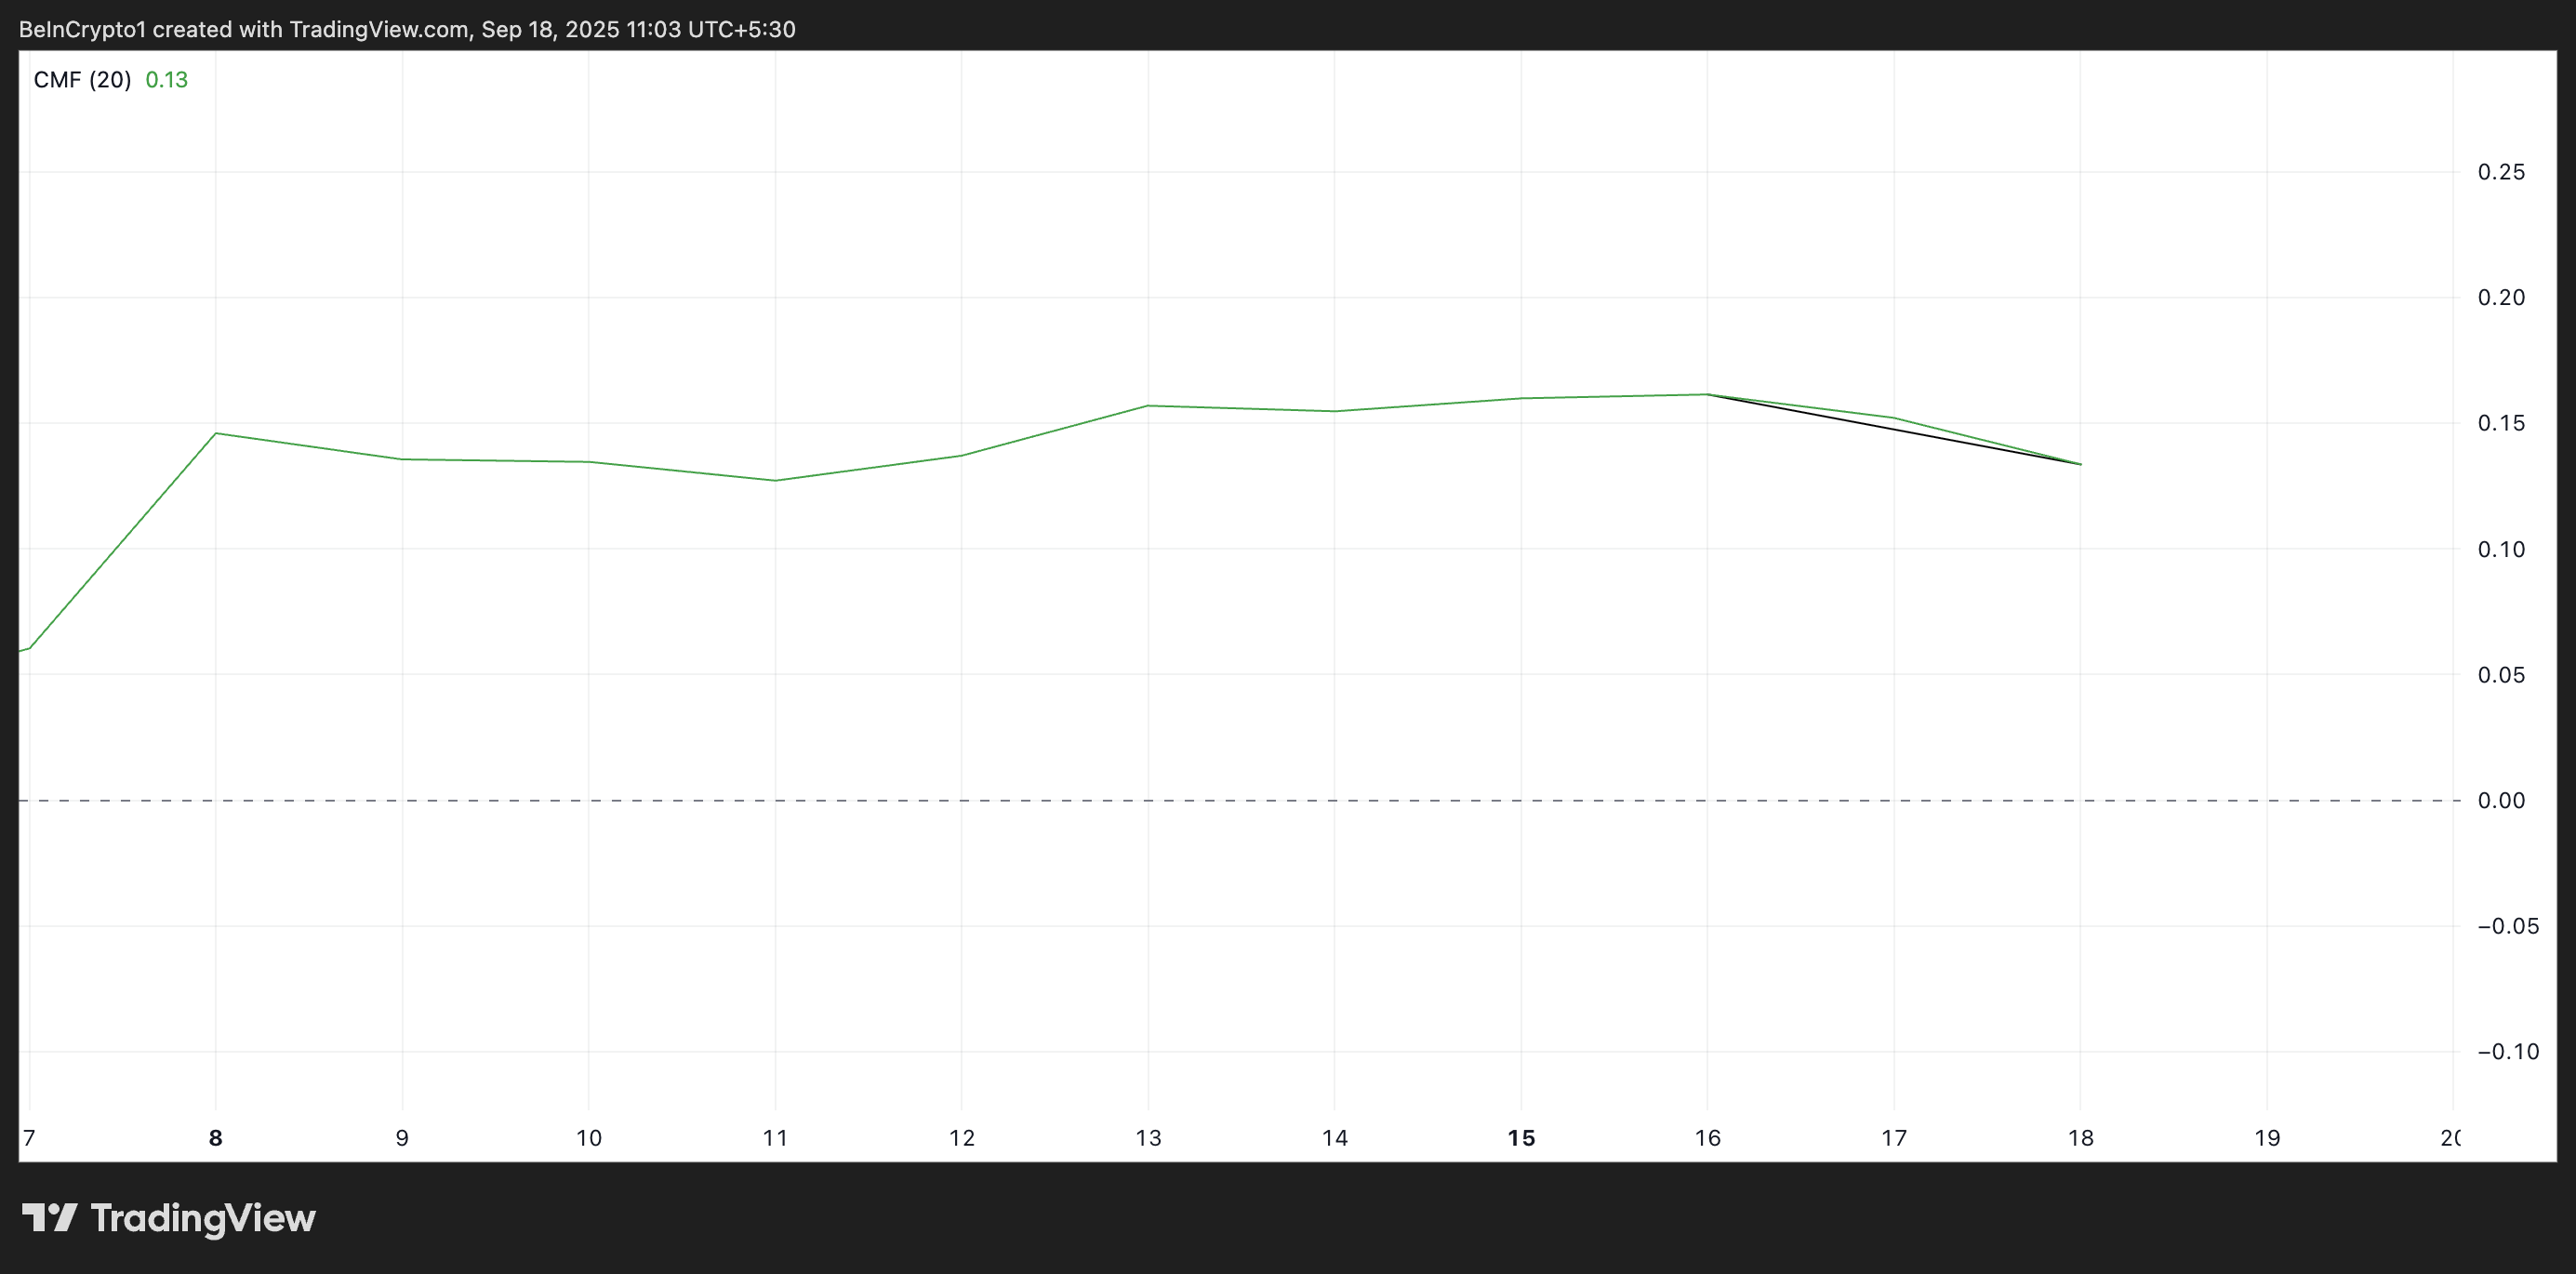
The CMF measures the Flow of capital into and out of an asset by combining price action with trading volume. It forms a bearish divergence when its value trends lower while an asset’s price continues to climb.
Historically, such divergences precede slowdowns and price reversals, as they reveal that although buyers are still pushing the price higher, capital inflow into the asset is declining steadily.
This puts M’s rally at risk of stalling in the near term.
MemeCore Stalls Below ATH as $2.99 Wall Strengthens
At press time, M trades at $2.94, just shy of its all-time high at $2.99, which has now formed a key resistance wall.
If the underlying bearish momentum continues to build, this barrier will only strengthen, forcing M to retreat toward support at $2.35. A breakdown below that level could worsen losses and drag the token to $2.35.
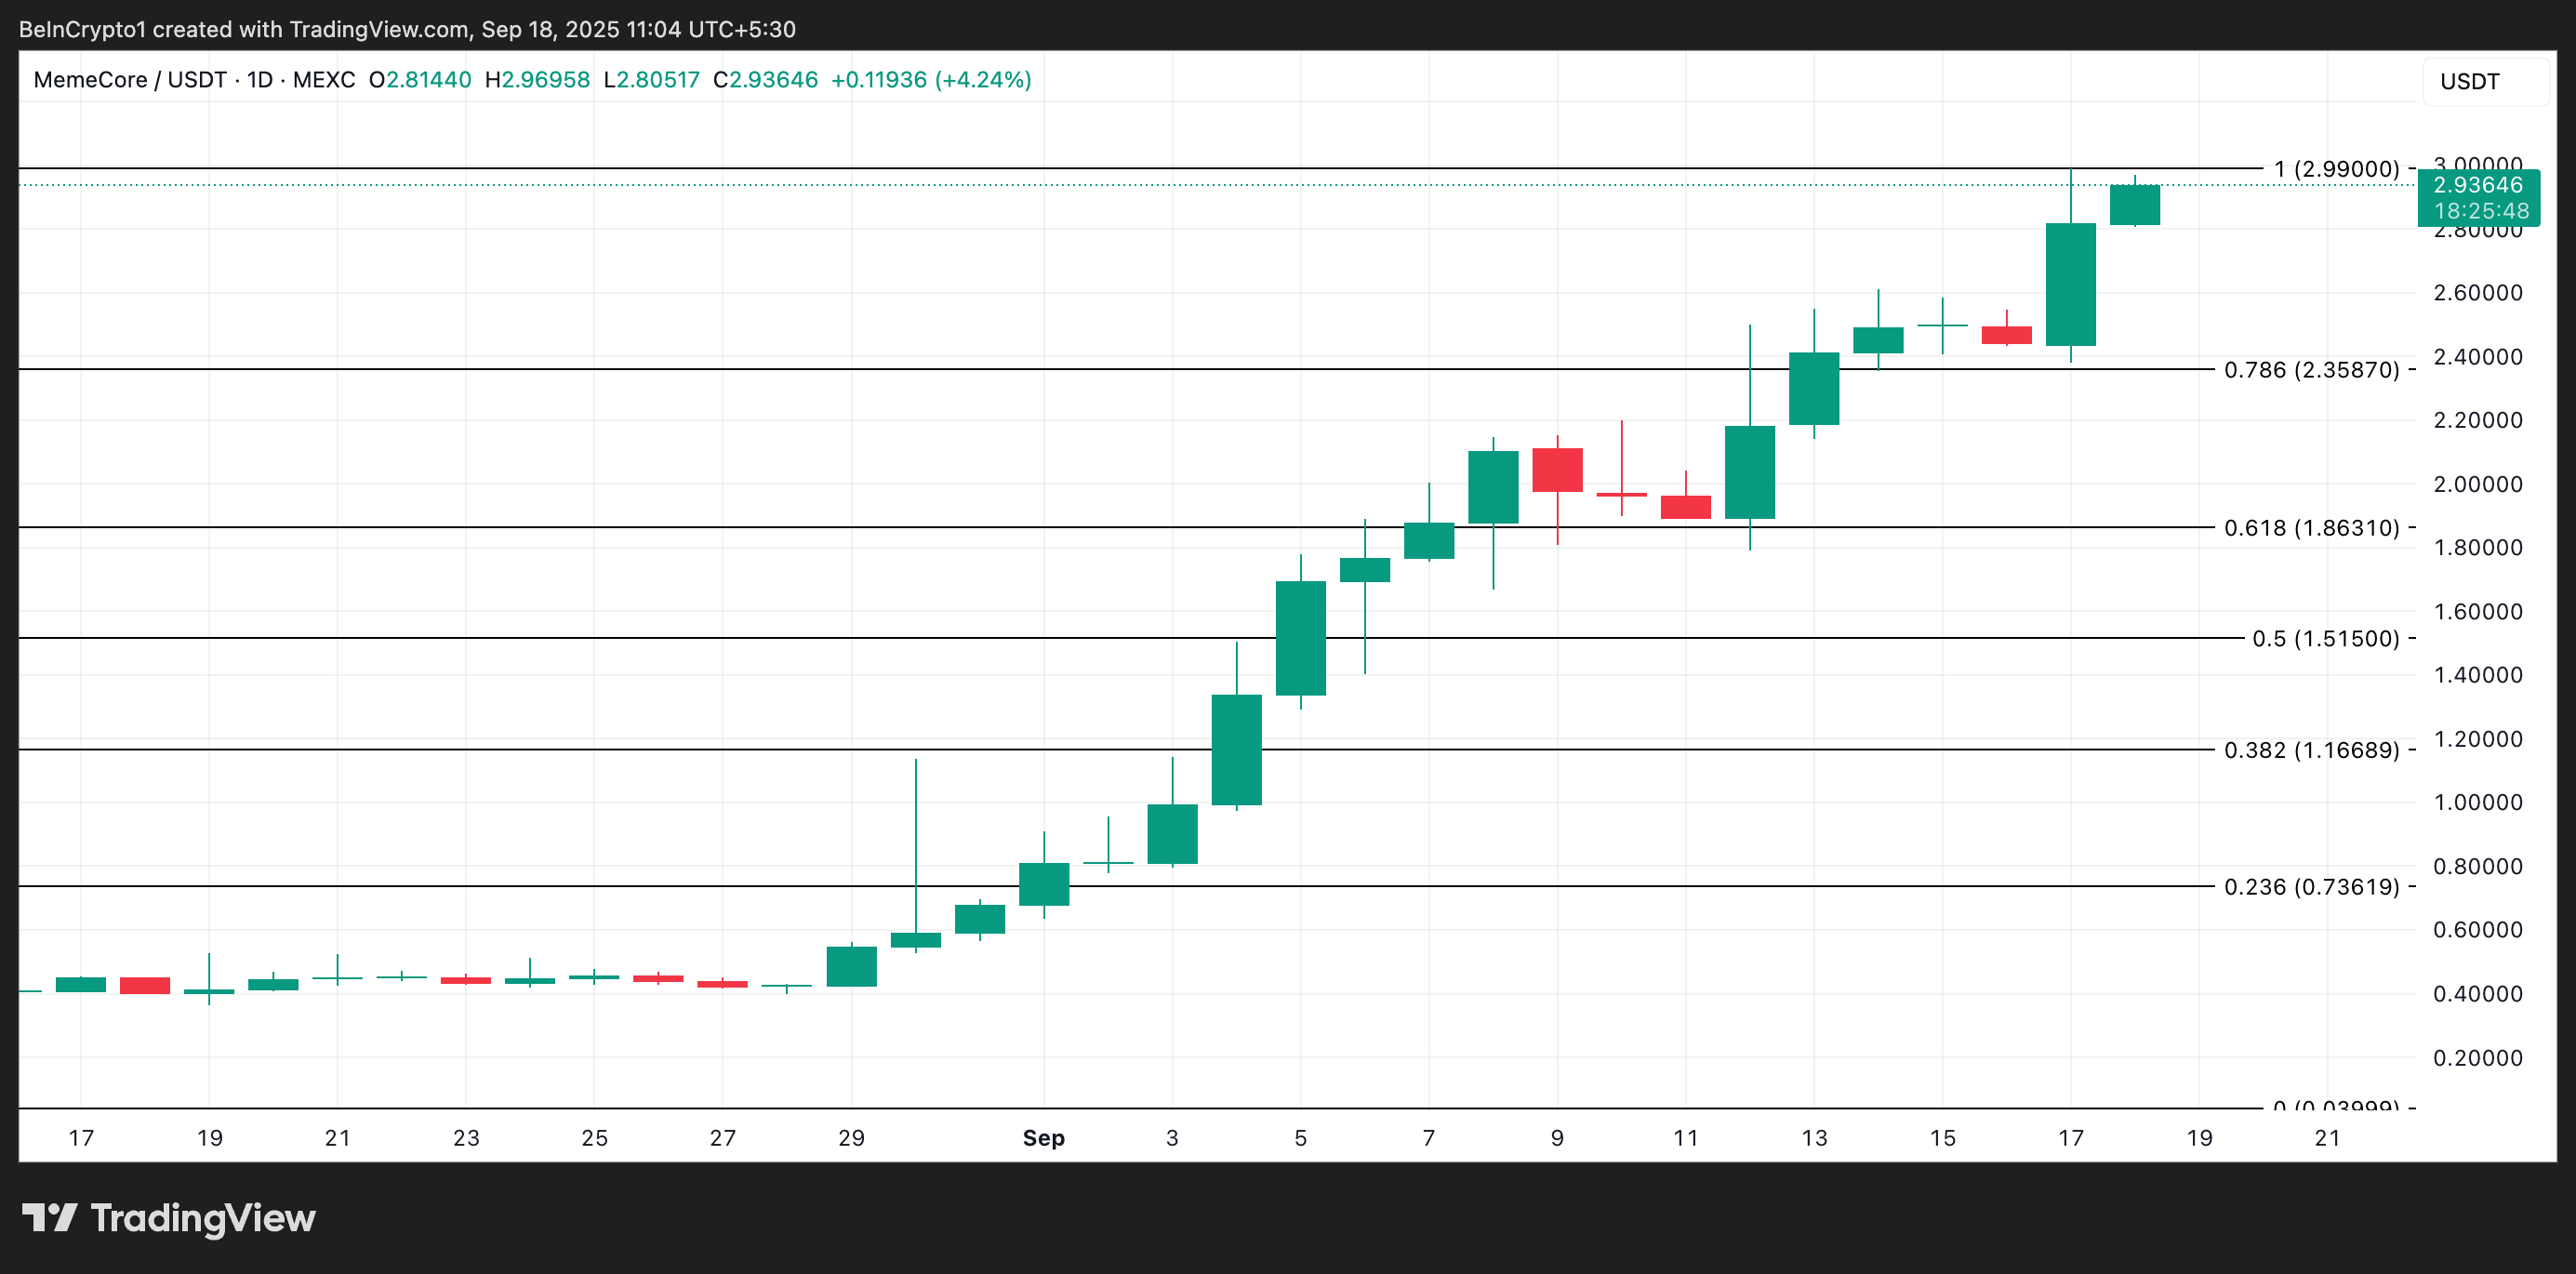
Conversely, if renewed demand surges, M could reclaim its all-time high and open the door to fresh price peaks, extending its bullish streak.
