PUMP Explodes 80% in Epic Rally—But Overheated Signals Flash Red Alert for Imminent Correction

PUMP token defies gravity with an 80% surge—traders cheer while technicals scream overbought.
Reading the Tea Leaves
Momentum indicators hit extreme levels not seen since last cycle's mania phase. The RSI kisses 85—a zone where even the most bullish charts catch their breath.
Volume tells the real story: retail FOMO pours in as smart money quietly scales out. Classic pump-and-hold behavior? Maybe—but who's counting when green candles feel this good.
Correction Incoming?
Support levels look thin below current price. A 20-30% pullback wouldn't just be healthy—it'd be necessary. Remember: trees don't grow to the sky, not even in crypto—where 'fundamentals' sometimes mean a meme and a dream.
Timing the dip beats chasing the tip. Always does.
PUMP’s Record Rally Meets Warning Signs
PUMP’s Relative Strength Index (RSI) has entered overbought territory, a signal that buying pressure may be peaking. As of this writing, this momentum indicator stands at 83.95.
The RSI indicator measures an asset’s overbought and oversold market conditions. It ranges between 0 and 100, with values above 70 suggesting that the asset is overbought and due for a price decline. Conversely, values under 30 indicate that the asset is oversold and may witness a rebound.
: Want more token insights like this? Sign up for Editor Harsh Notariya’s Daily crypto Newsletter here.
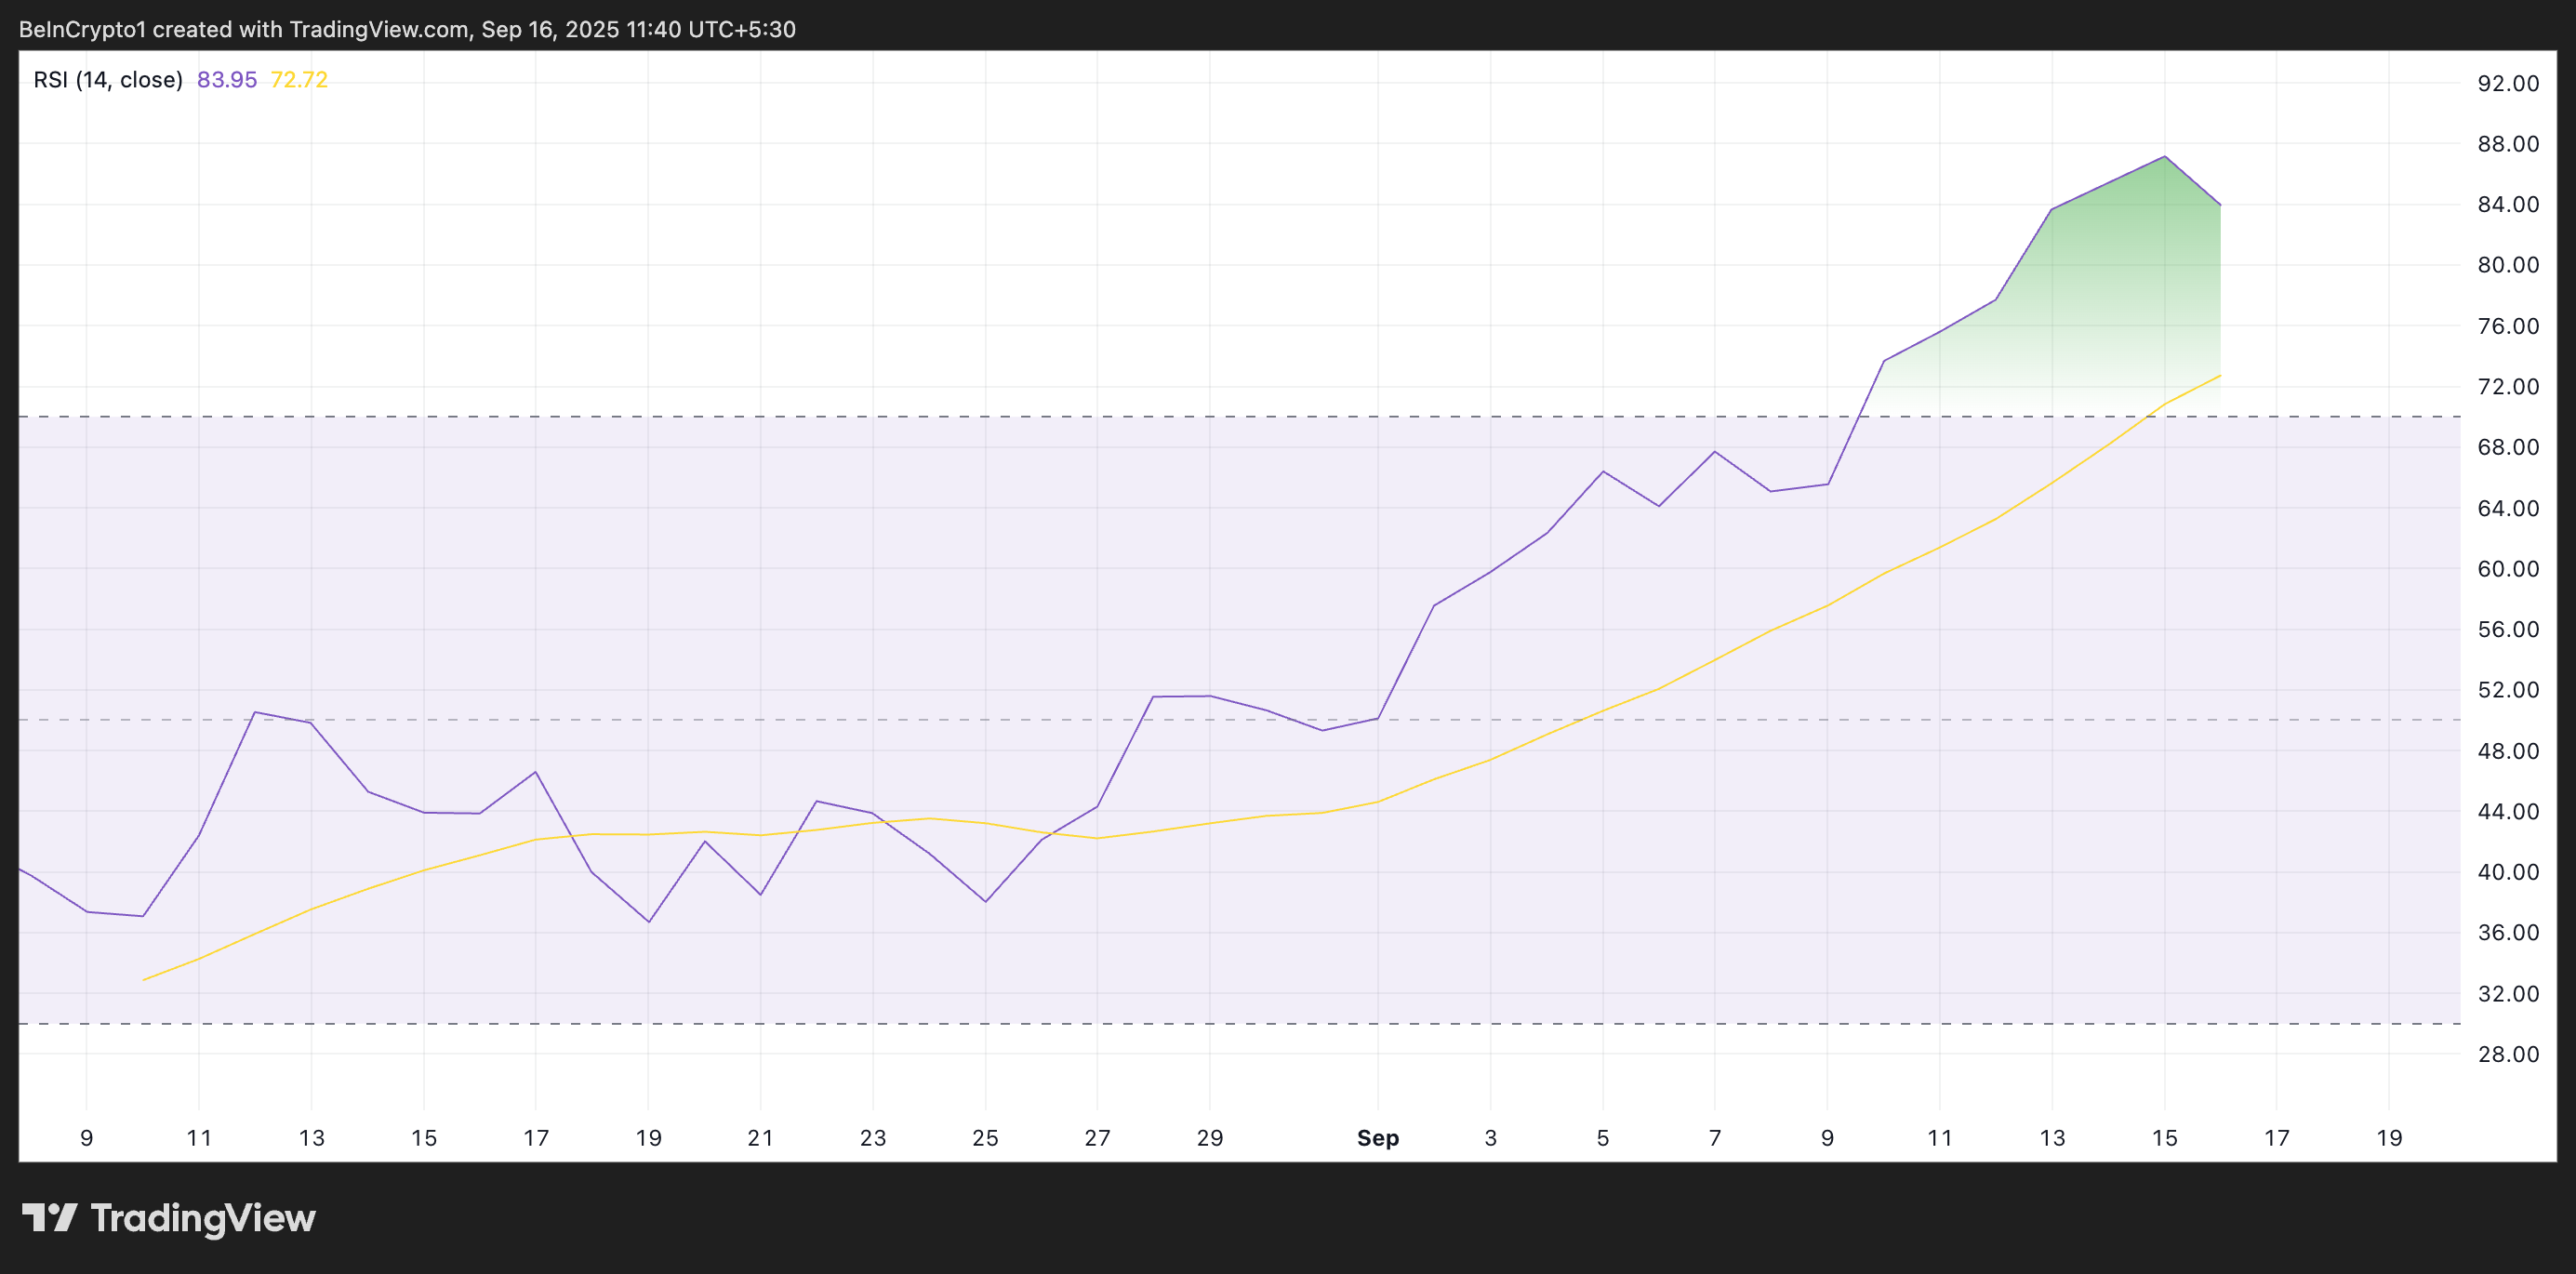
At 83.95, PUMP’s RSI signals that the token is deeply overbought, amplifying the risk of a near-term correction. Such an elevated level suggests bullish momentum has reached unsustainable extremes, exposing the market to a pullback.
Furthermore, the setup of PUMP’s Bollinger Bands reflects the overheated nature of its spot markets. On the daily chart, the gap between the upper and lower Bollinger Bands has widened significantly since the start of the month. With PUMP’s price hovering NEAR the upper band, the setup signals heightened volatility and overbought conditions.
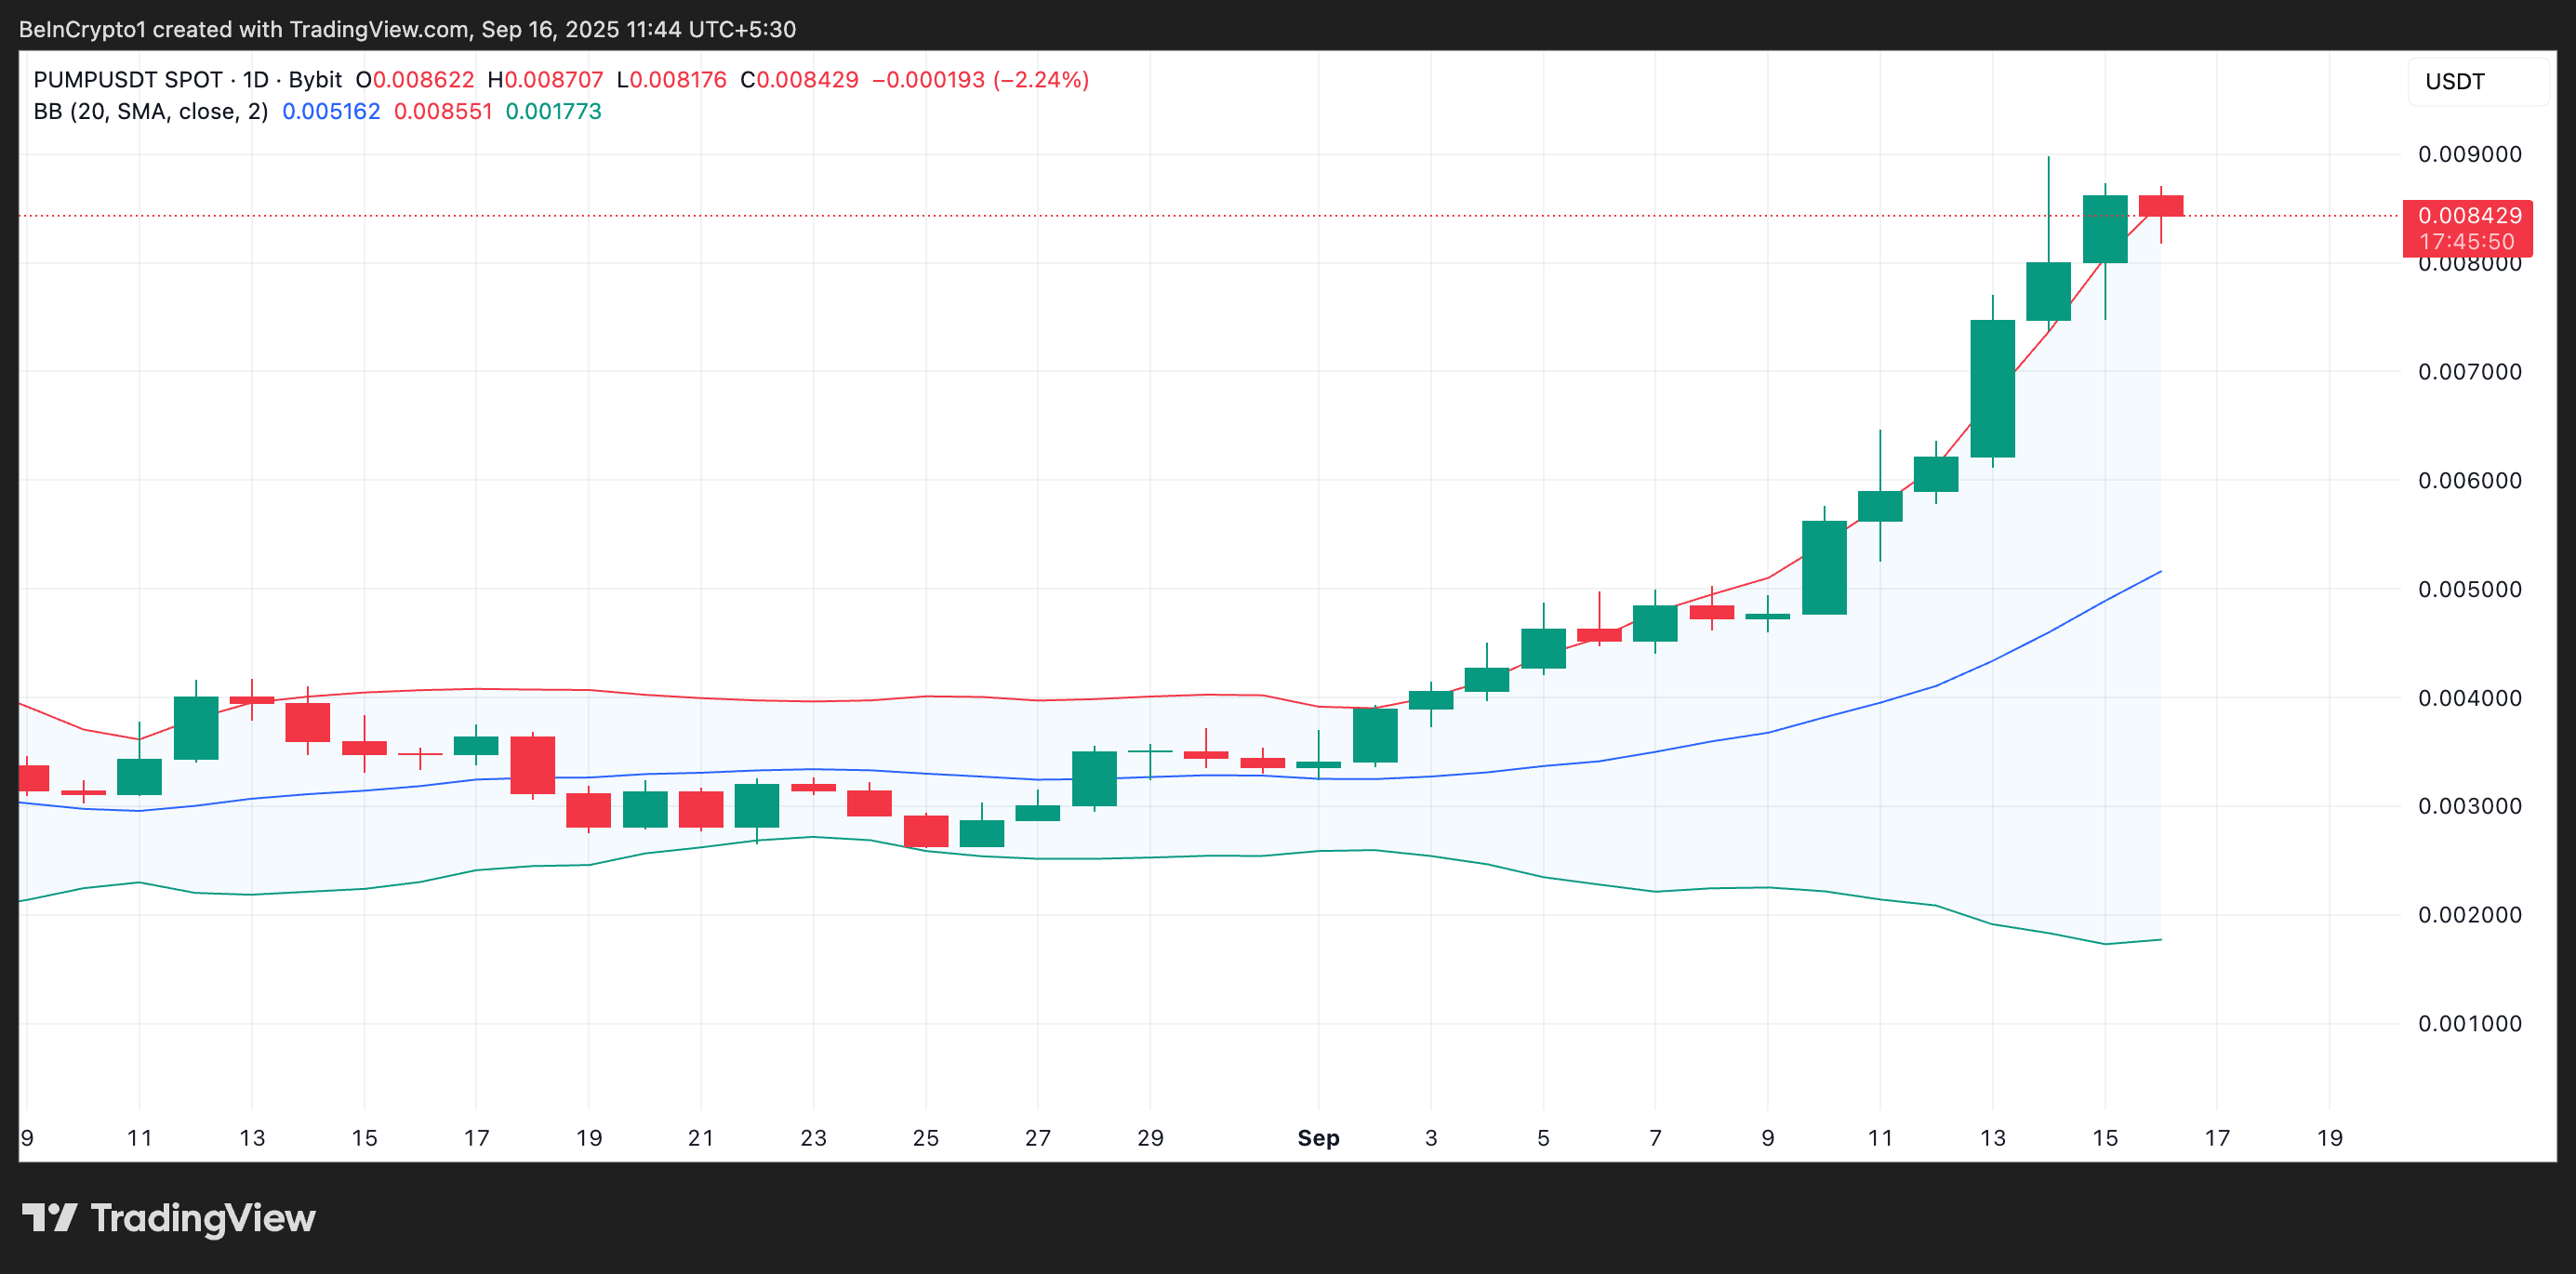
Bollinger Bands measure market volatility and identify potential overbought or oversold conditions. The indicator consists of a simple moving average (SMA) in the middle, and an upper and lower band that expand or contract based on price fluctuations.
When an asset’s price consistently moves toward the upper band, it may be trading in overbought territory. As of this writing, PUMP trades close to this line, indicating that the token is stretched well above its average trading range.
This suggests that recent bullish momentum has pushed the market to overheated levels, where profit-taking could soon emerge.
Will Bulls Defend $0.0075 or Bears Drive It Lower?
If sellers capitalize on this overheated setup, PUMP could retreat toward $0.007550. A breach of this key support floor could trigger a decline to $0.006428.
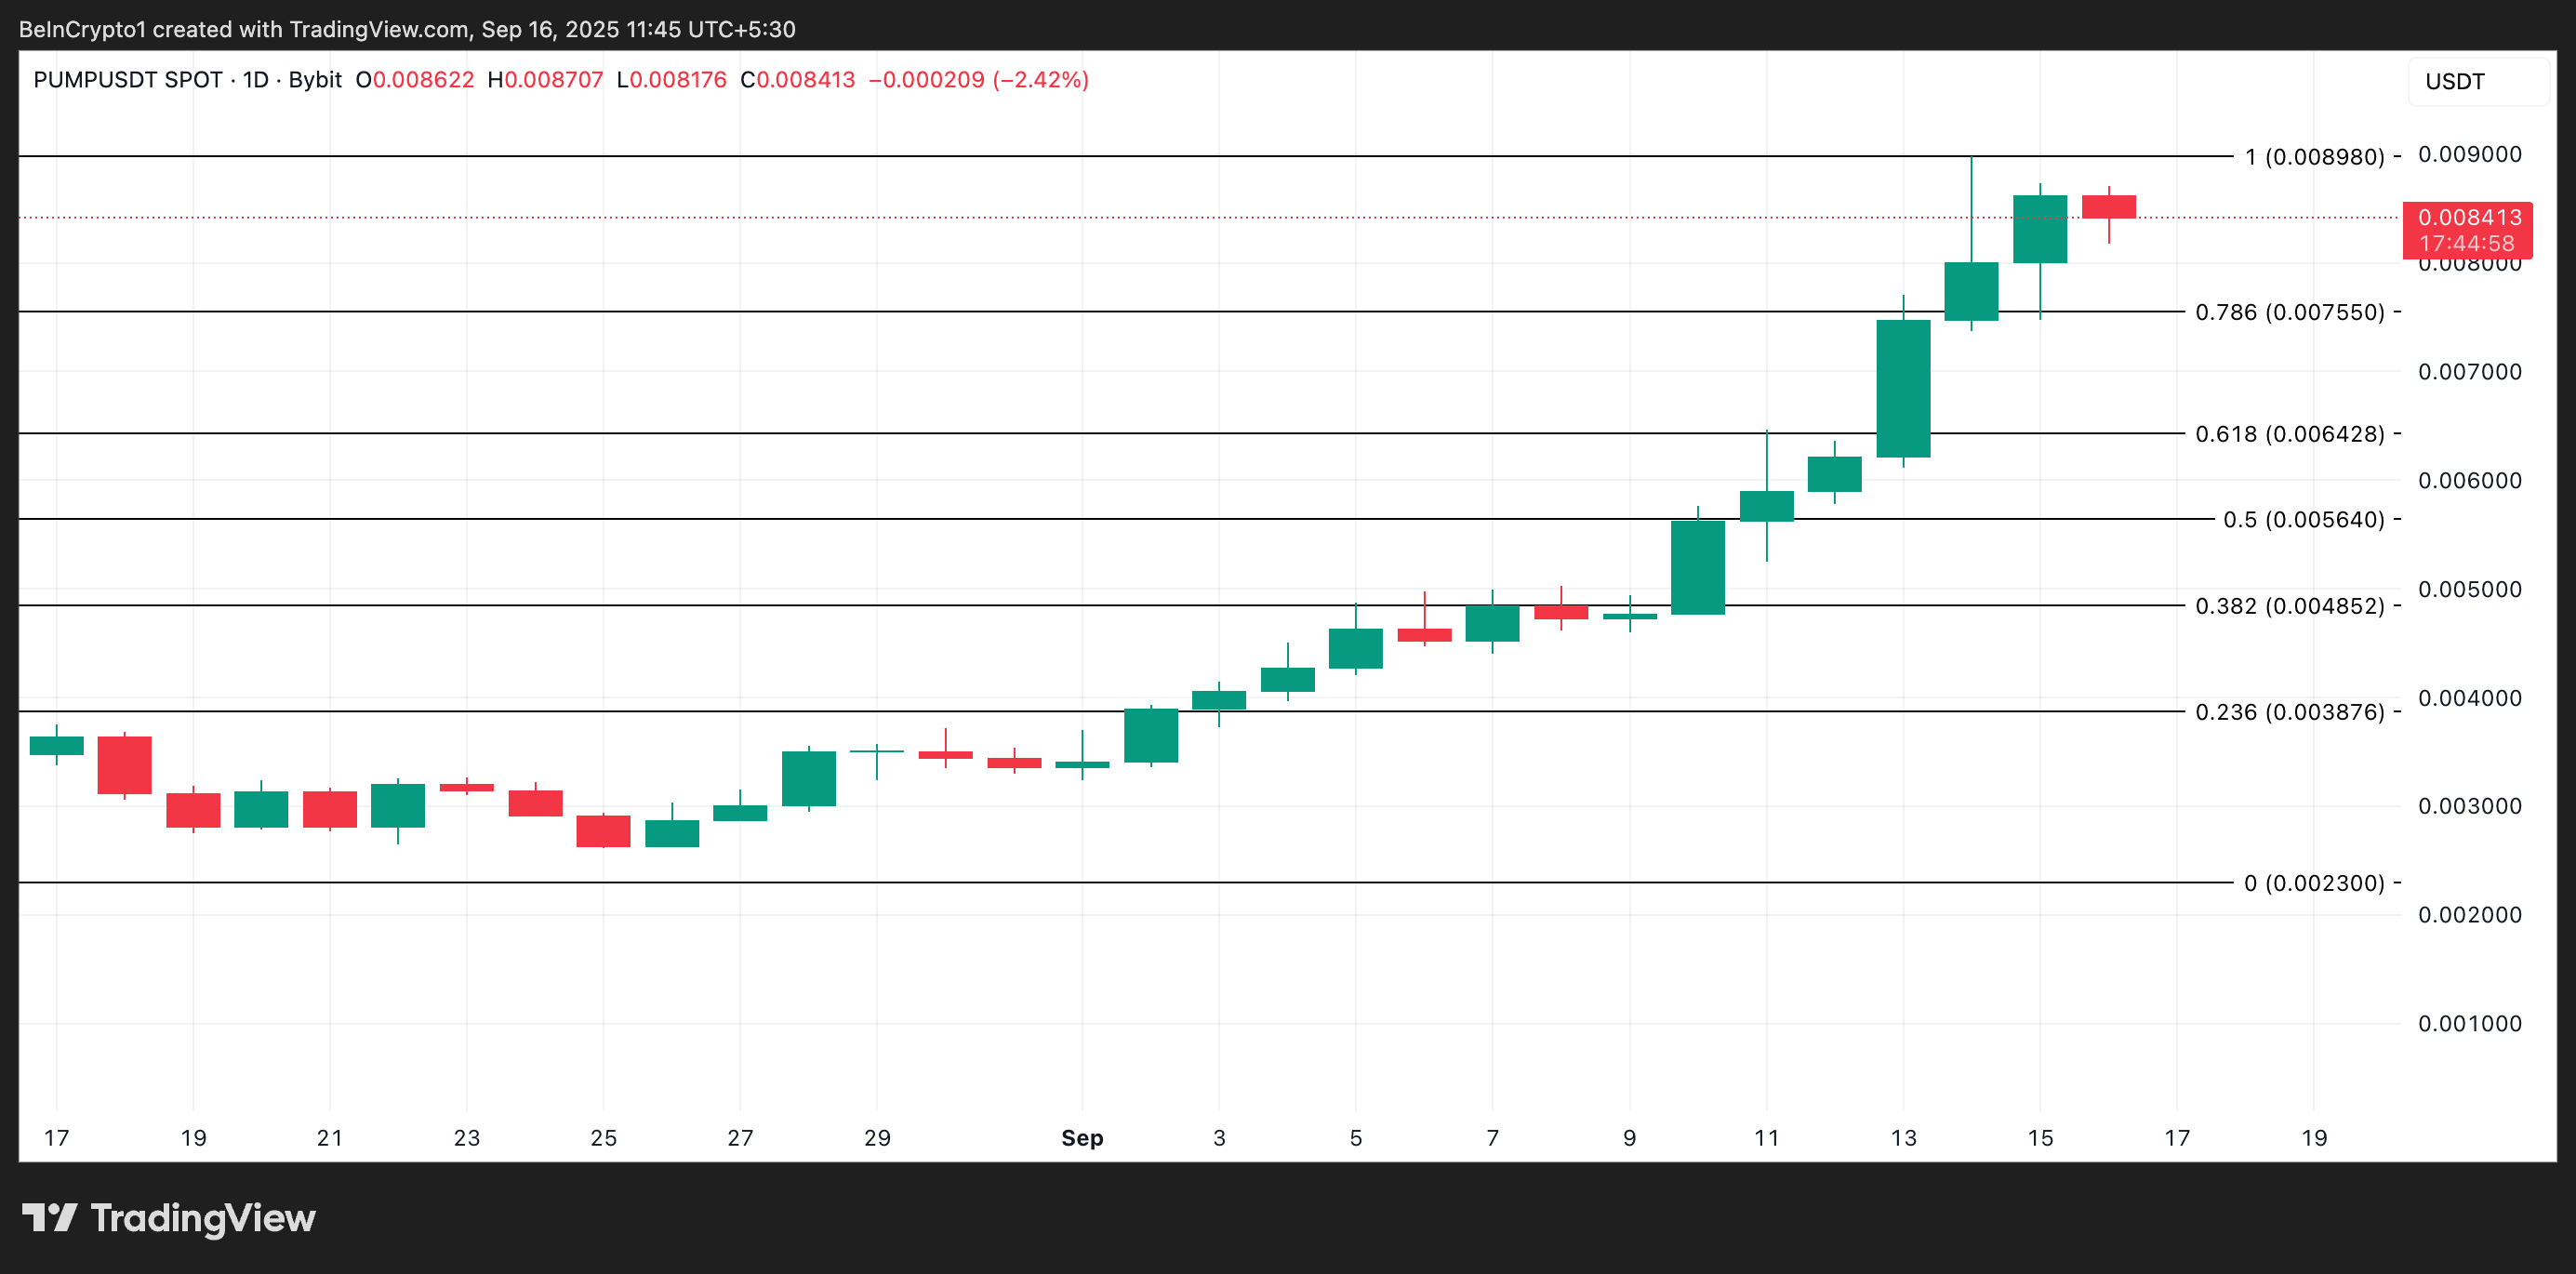
However, if strong bullish sentiment persists, the token may attempt to consolidate near current highs before deciding its next major move. If demand rockets, PUMP could reclaim its all-time high of $0.008980 and try to record new price peaks.
