Ethereum Confronts September’s Ghost: Profit-Taking Surges & Chart Alarms Flash

Ethereum bulls hit the brakes as September's seasonal curse looms—traders cash out gains while technical patterns scream caution.
Profit-taking pressure mounts
Whales and retail alike dump holdings, locking in profits before any potential downturn. Historical September weakness adds fuel to the fire—nobody wants to be the last one holding the bag.
Chart warnings turn critical
Key support levels tremble as resistance stiffens. Technical indicators flash oversold signals, but momentum traders aren't buying the dip—yet.
Market sentiment shifts
The 'buy everything' frenzy cools as reality bites. Traders suddenly remember that crypto winters exist—almost like they forgot markets can go down too. Typical.
September's ghost haunts ETH
Historical data doesn't lie—this month traditionally bruises crypto portfolios. Whether Ethereum breaks the pattern or bows to seasonal pressure remains the billion-dollar question. Literally.
Profit-Taking Signs Emerge as Derivatives Flows Show Weakness
One of the clearest signs of stress comes from the percentage of supply in profit. This metric tracks how much of ETH’s circulating supply is currently held at a profit.
On September 12, it touched 99.68%, the second-highest level in a month. Even after pulling back slightly to 98.14%, the metric still sits in what can be called “overheated territory.”
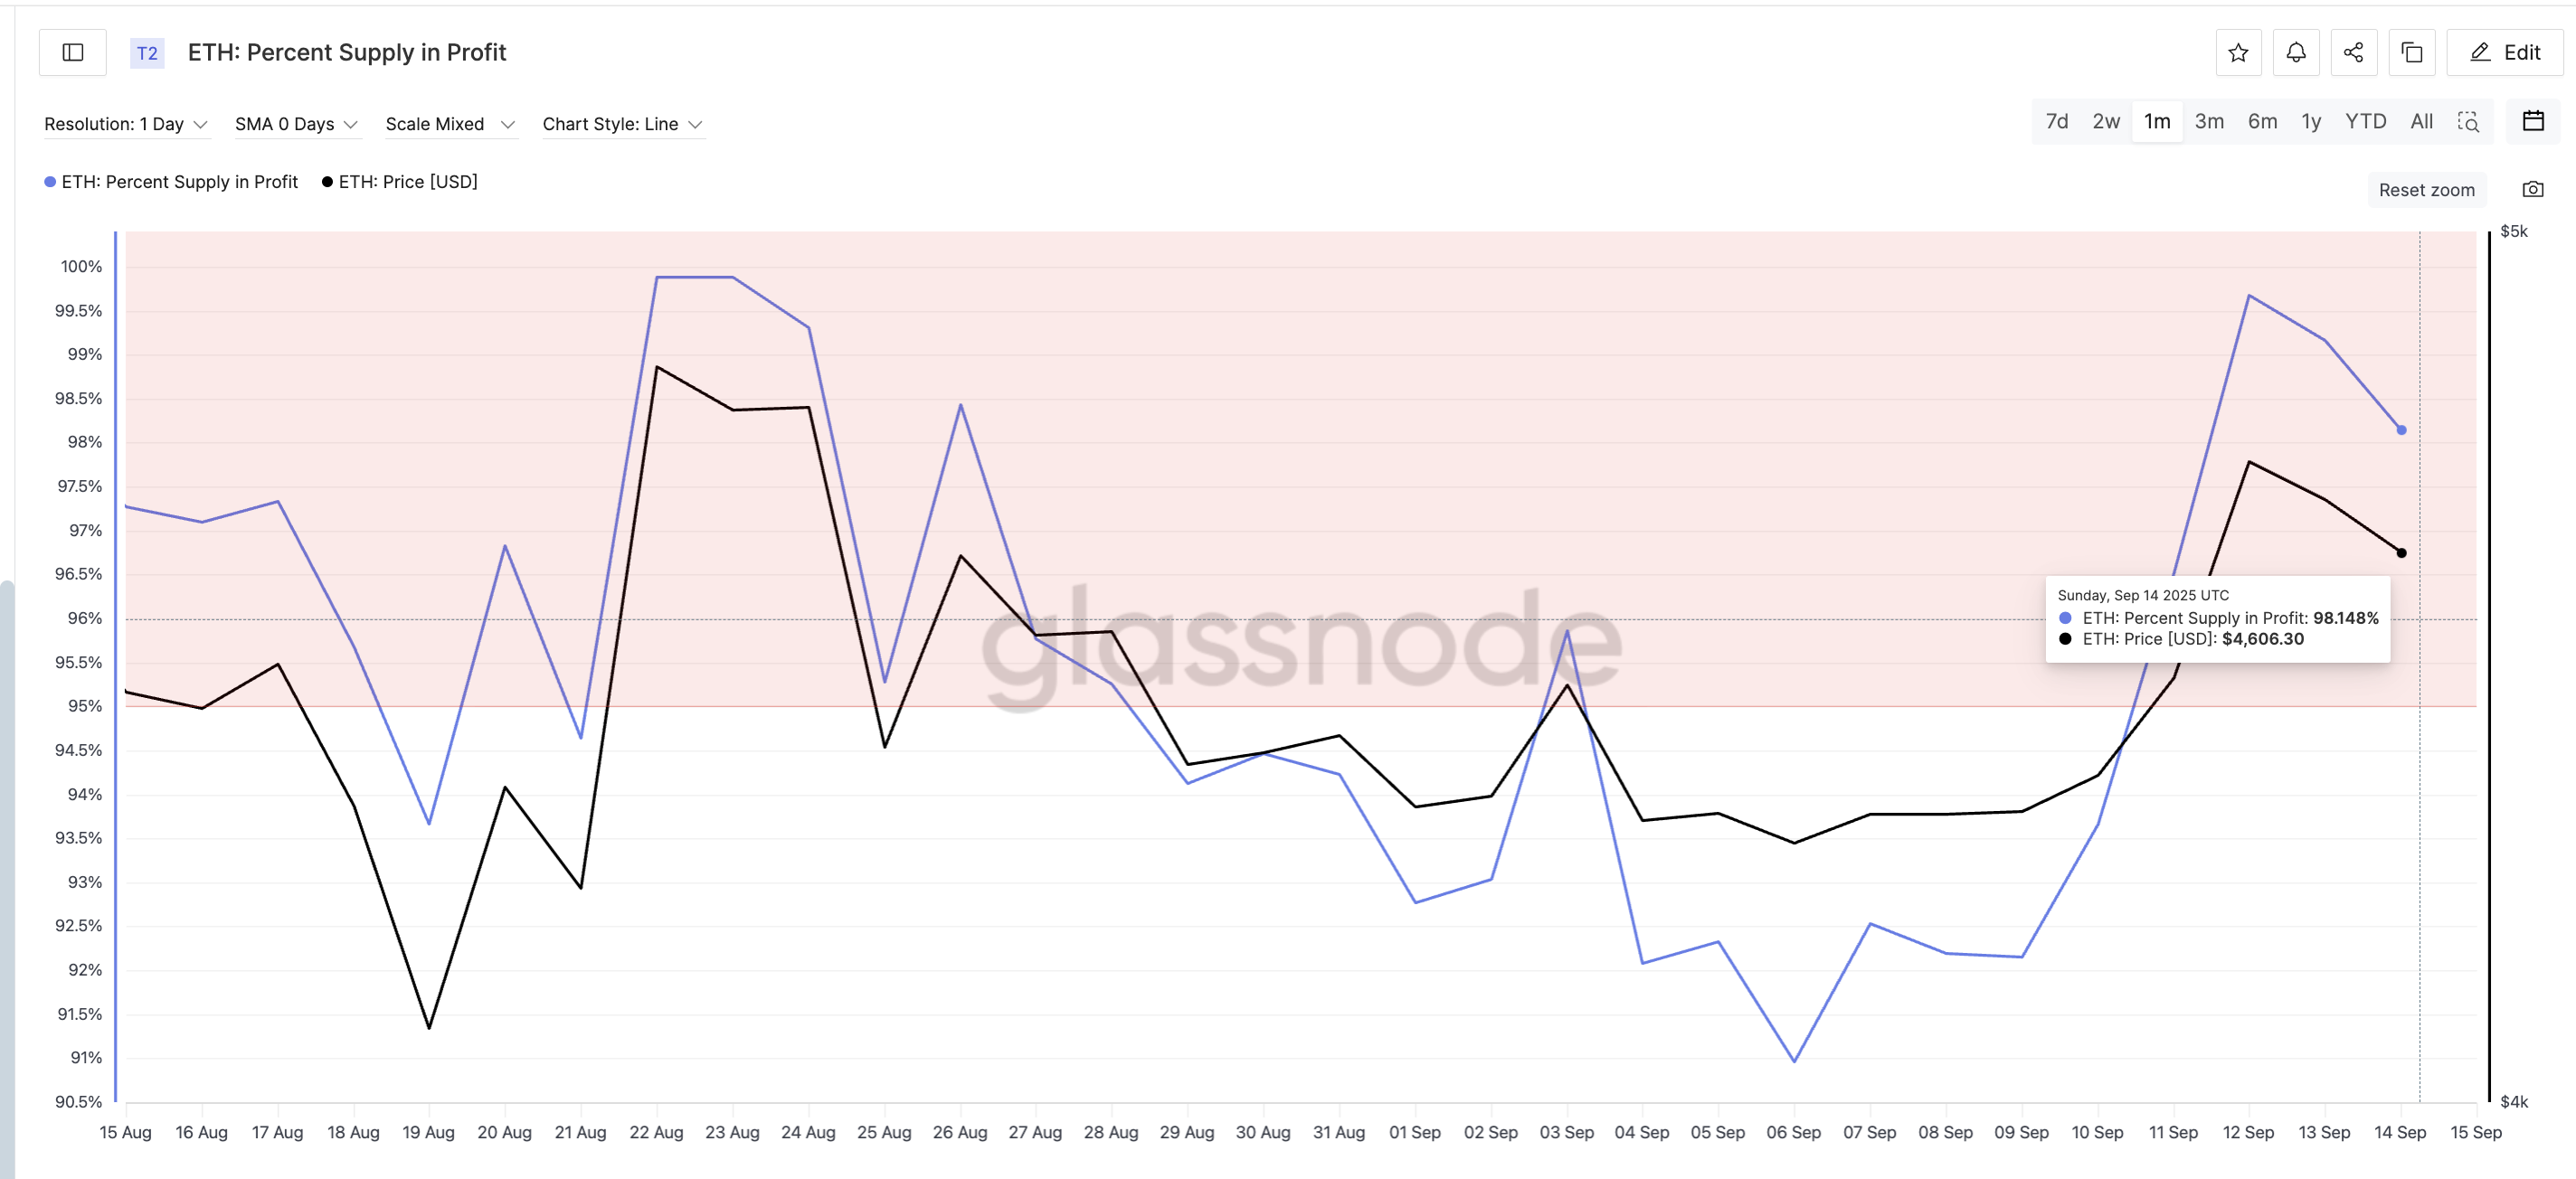
Each time ETH has hit these local peaks, corrections followed. For example, on August 22, profit supply hit 99.88% when ETH traded near $4,829. Within days, the ethereum price slid to $4,380, a drop of about 9%.
? Sign up for Editor Harsh Notariya’s Daily crypto Newsletter here.
Meanwhile, the taker buy-sell ratio adds weight to the bearish setup. This ratio compares aggressive buyers to aggressive sellers in the futures market.
A value above 1 signals bullishness, while a value below 1 means the sentiment is turning bearish. But that’s not the only way to analyze it.
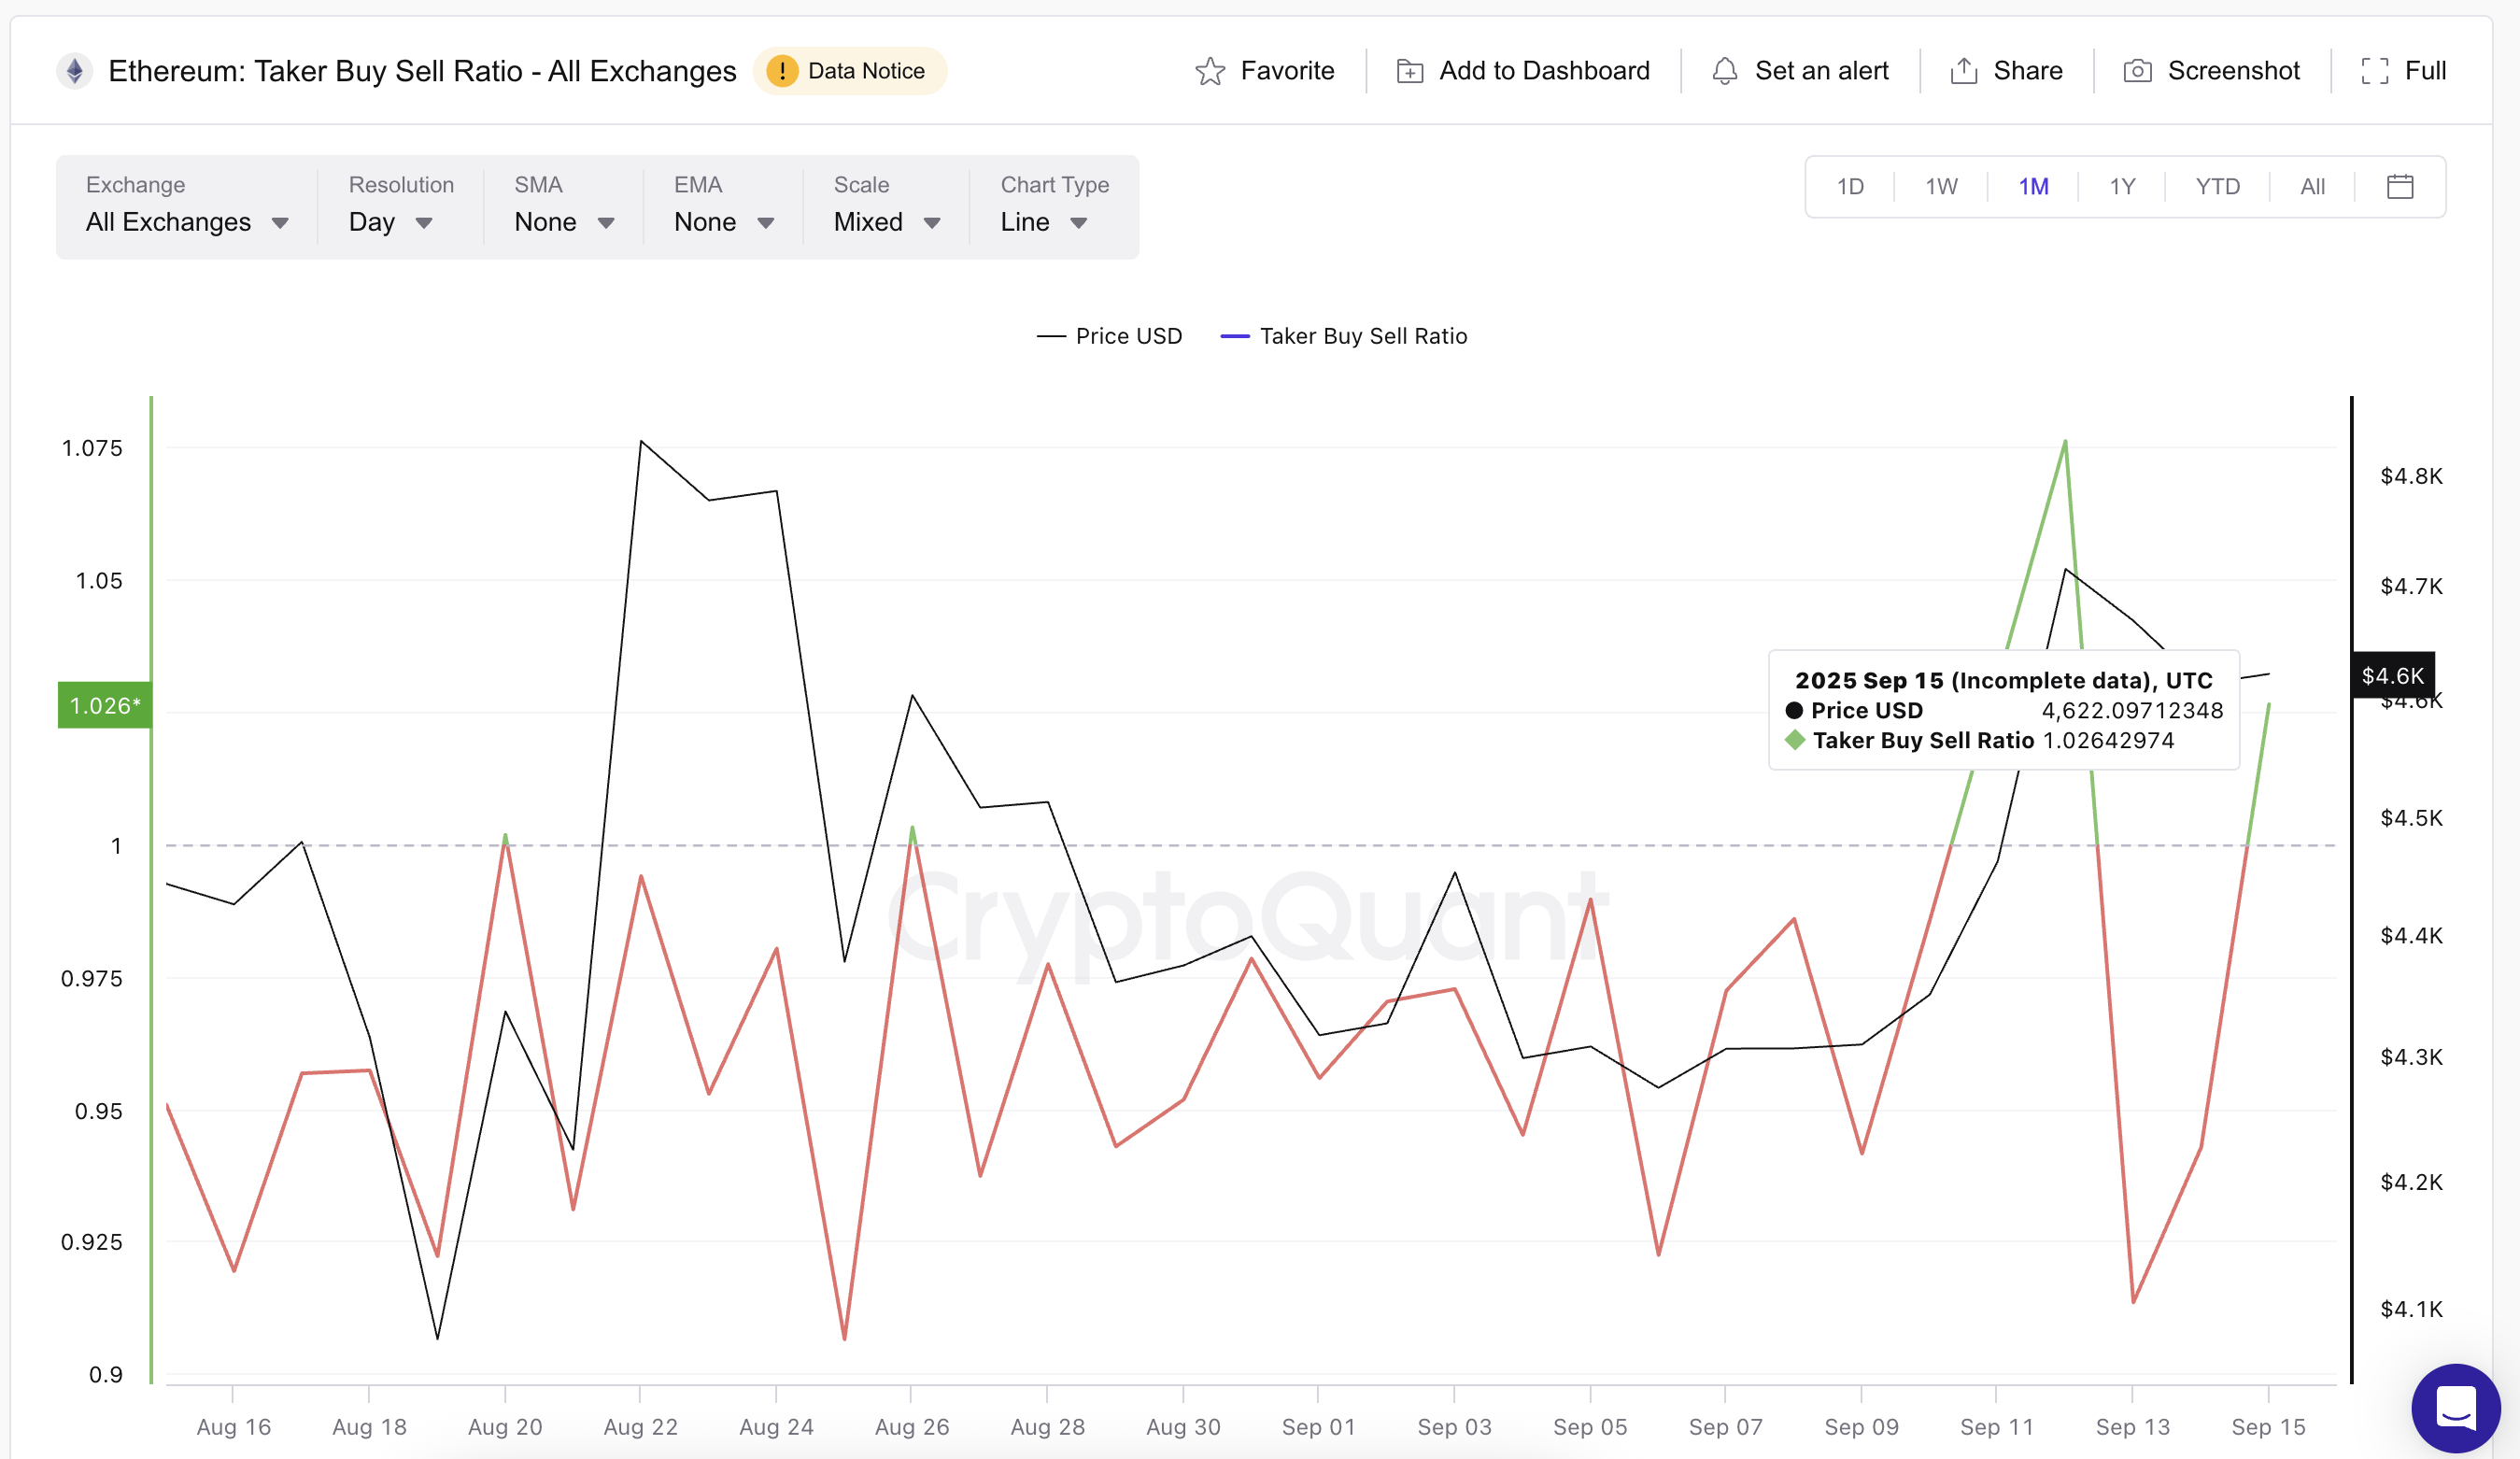
On September 13, the ratio fell to 0.91, its second-lowest level in a month. The drop shows bearish sentiment building.
Normally, when the ratio forms such local bottoms, the Ethereum price bounces, an important bit of causality. But this time was different — prices dipped, and then flatlined. A similar setup happened on August 23, when ETH failed to respond and later dropped from $4,776 to $4,376, a nearly 8% slide.
Even though the ratio was above 1 at press time, it is still early in the day, and it is expected to cool down.
Together, the profit supply peaks and the taker ratio pattern echo the weakness ethereum often faces in September.
Quick Correction Risks Surface on Ethereum Price Chart
Technical charts back up the on-chain warnings. On the 4-hour chart, ETH shows hidden bearish divergence. This happens when the price makes a lower high, but the RSI (Relative Strength Index) makes a higher high.
RSI measures market momentum, and such divergences often warn of continuation to the downside.
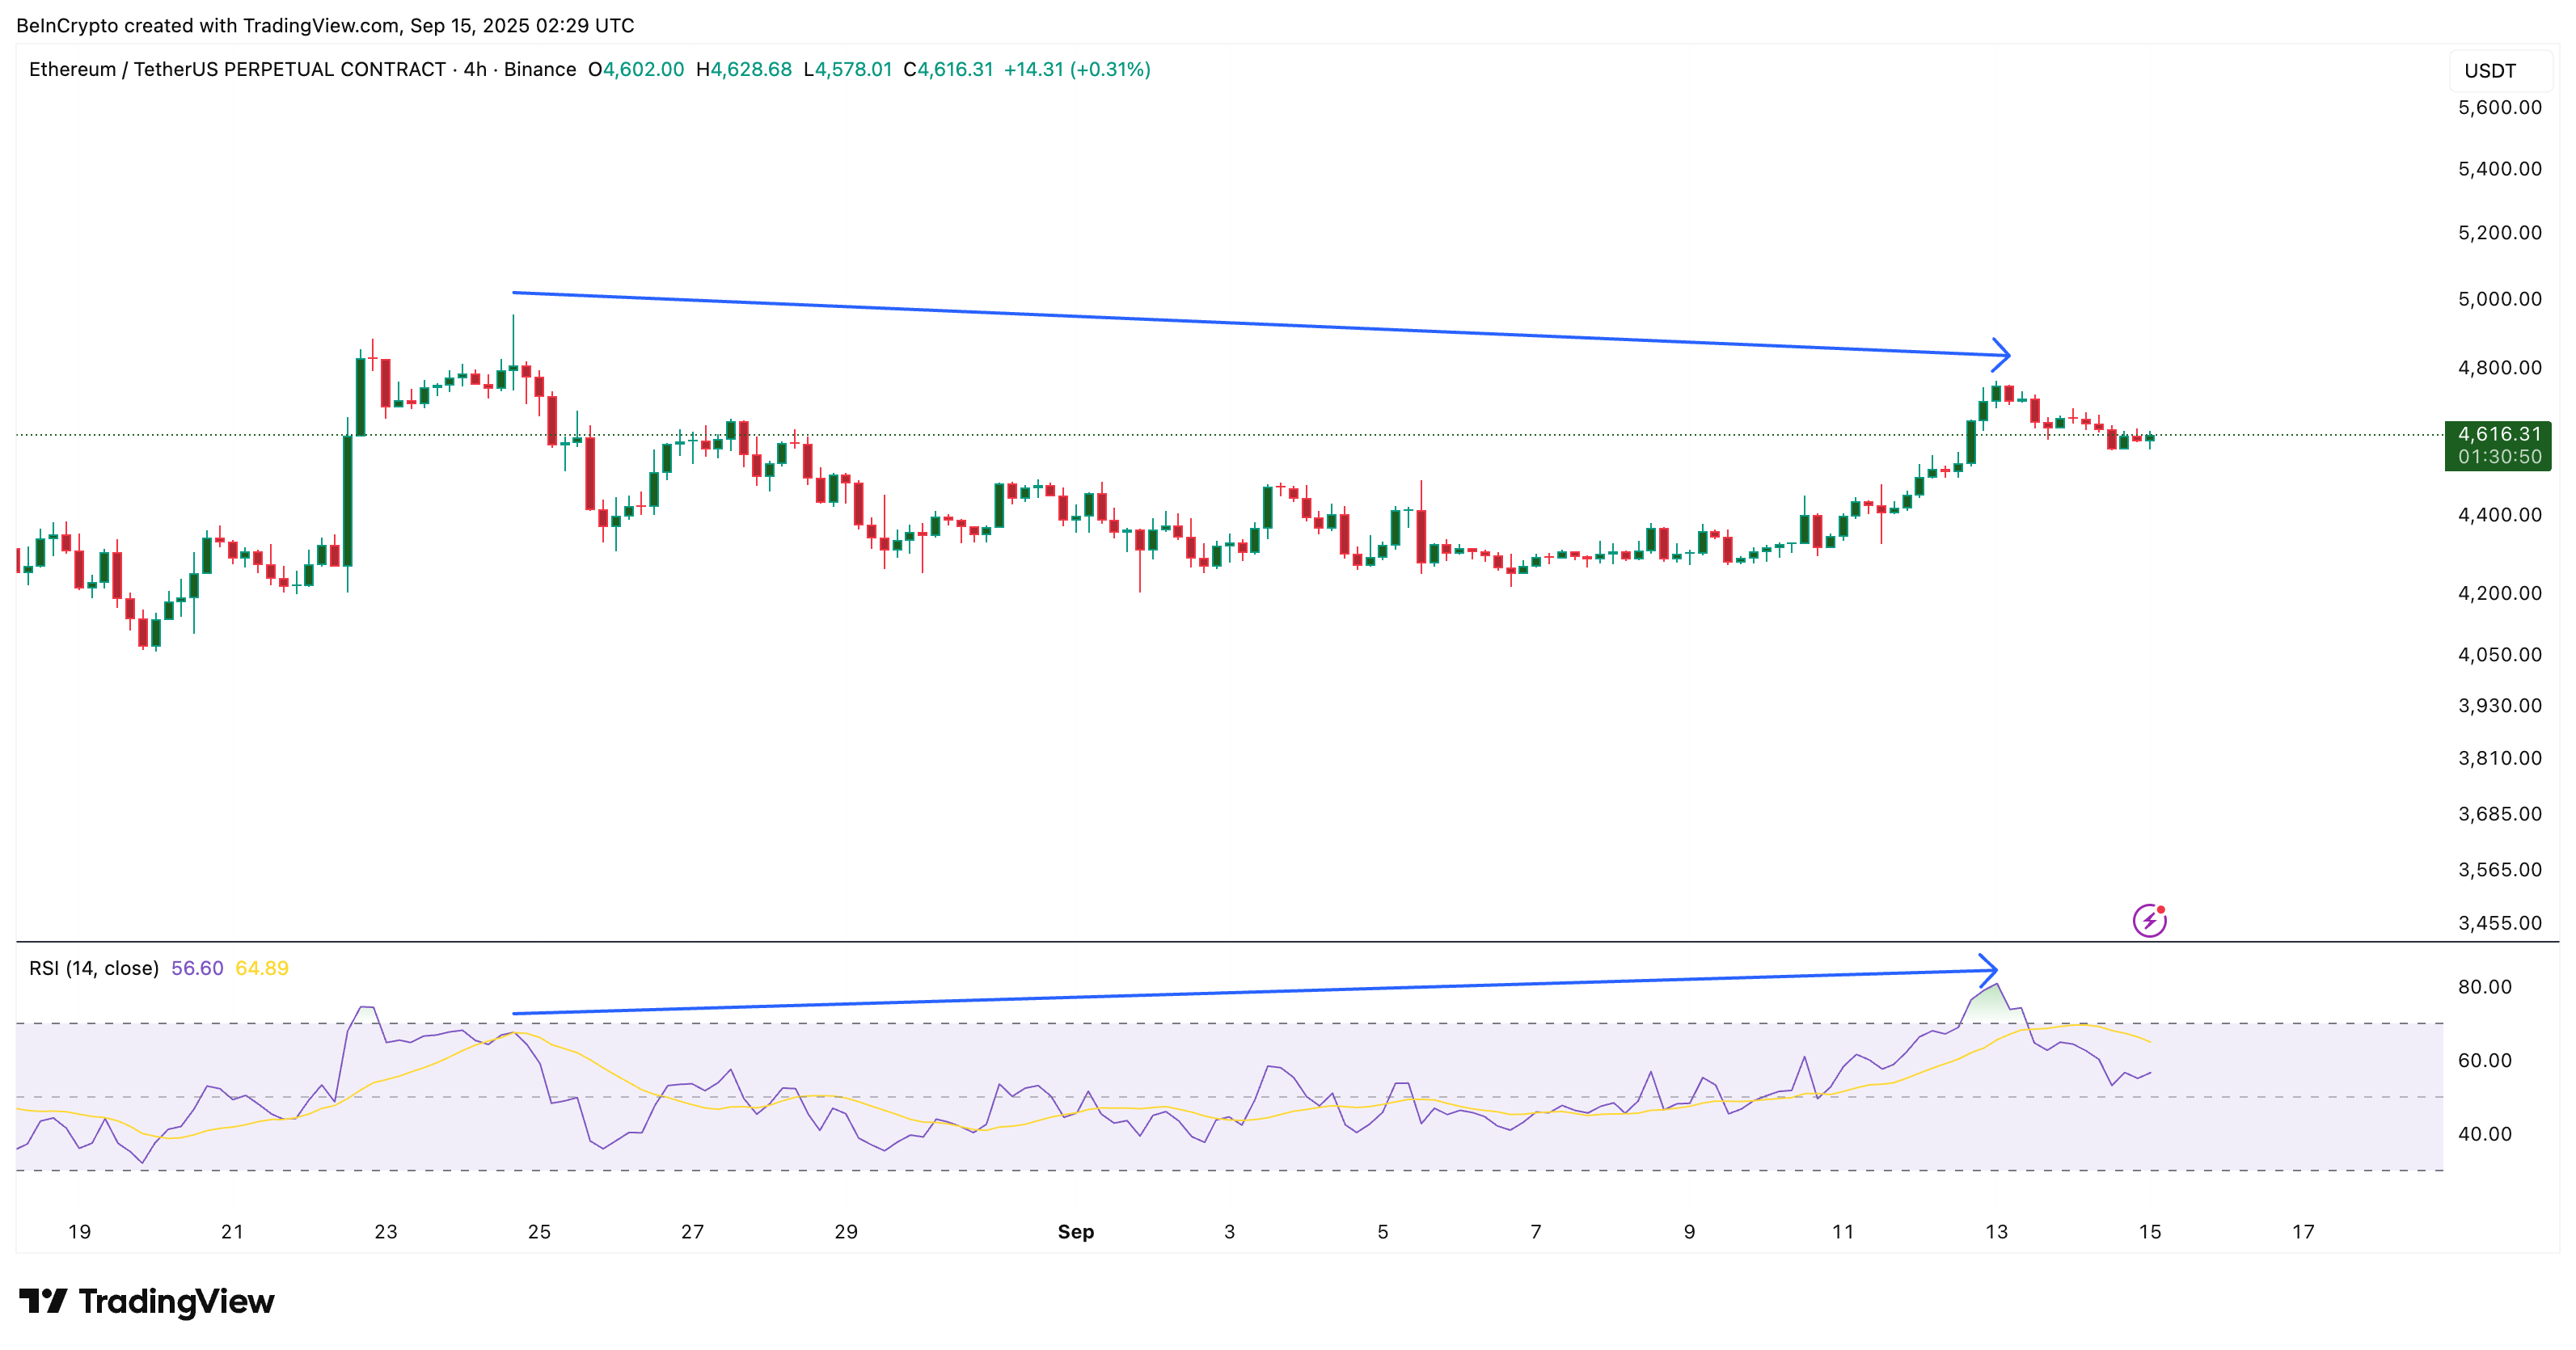
In ETH’s case, the divergence spans from August 24 to September 13, aligning with ETH’s failure to break higher despite repeated attempts.
On the daily chart, the setup looks even more pressing. ETH trades inside a rising wedge pattern, which is generally bearish. A rising wedge forms when prices rise, but the slope of the highs and lows narrows, hinting at fading strength.
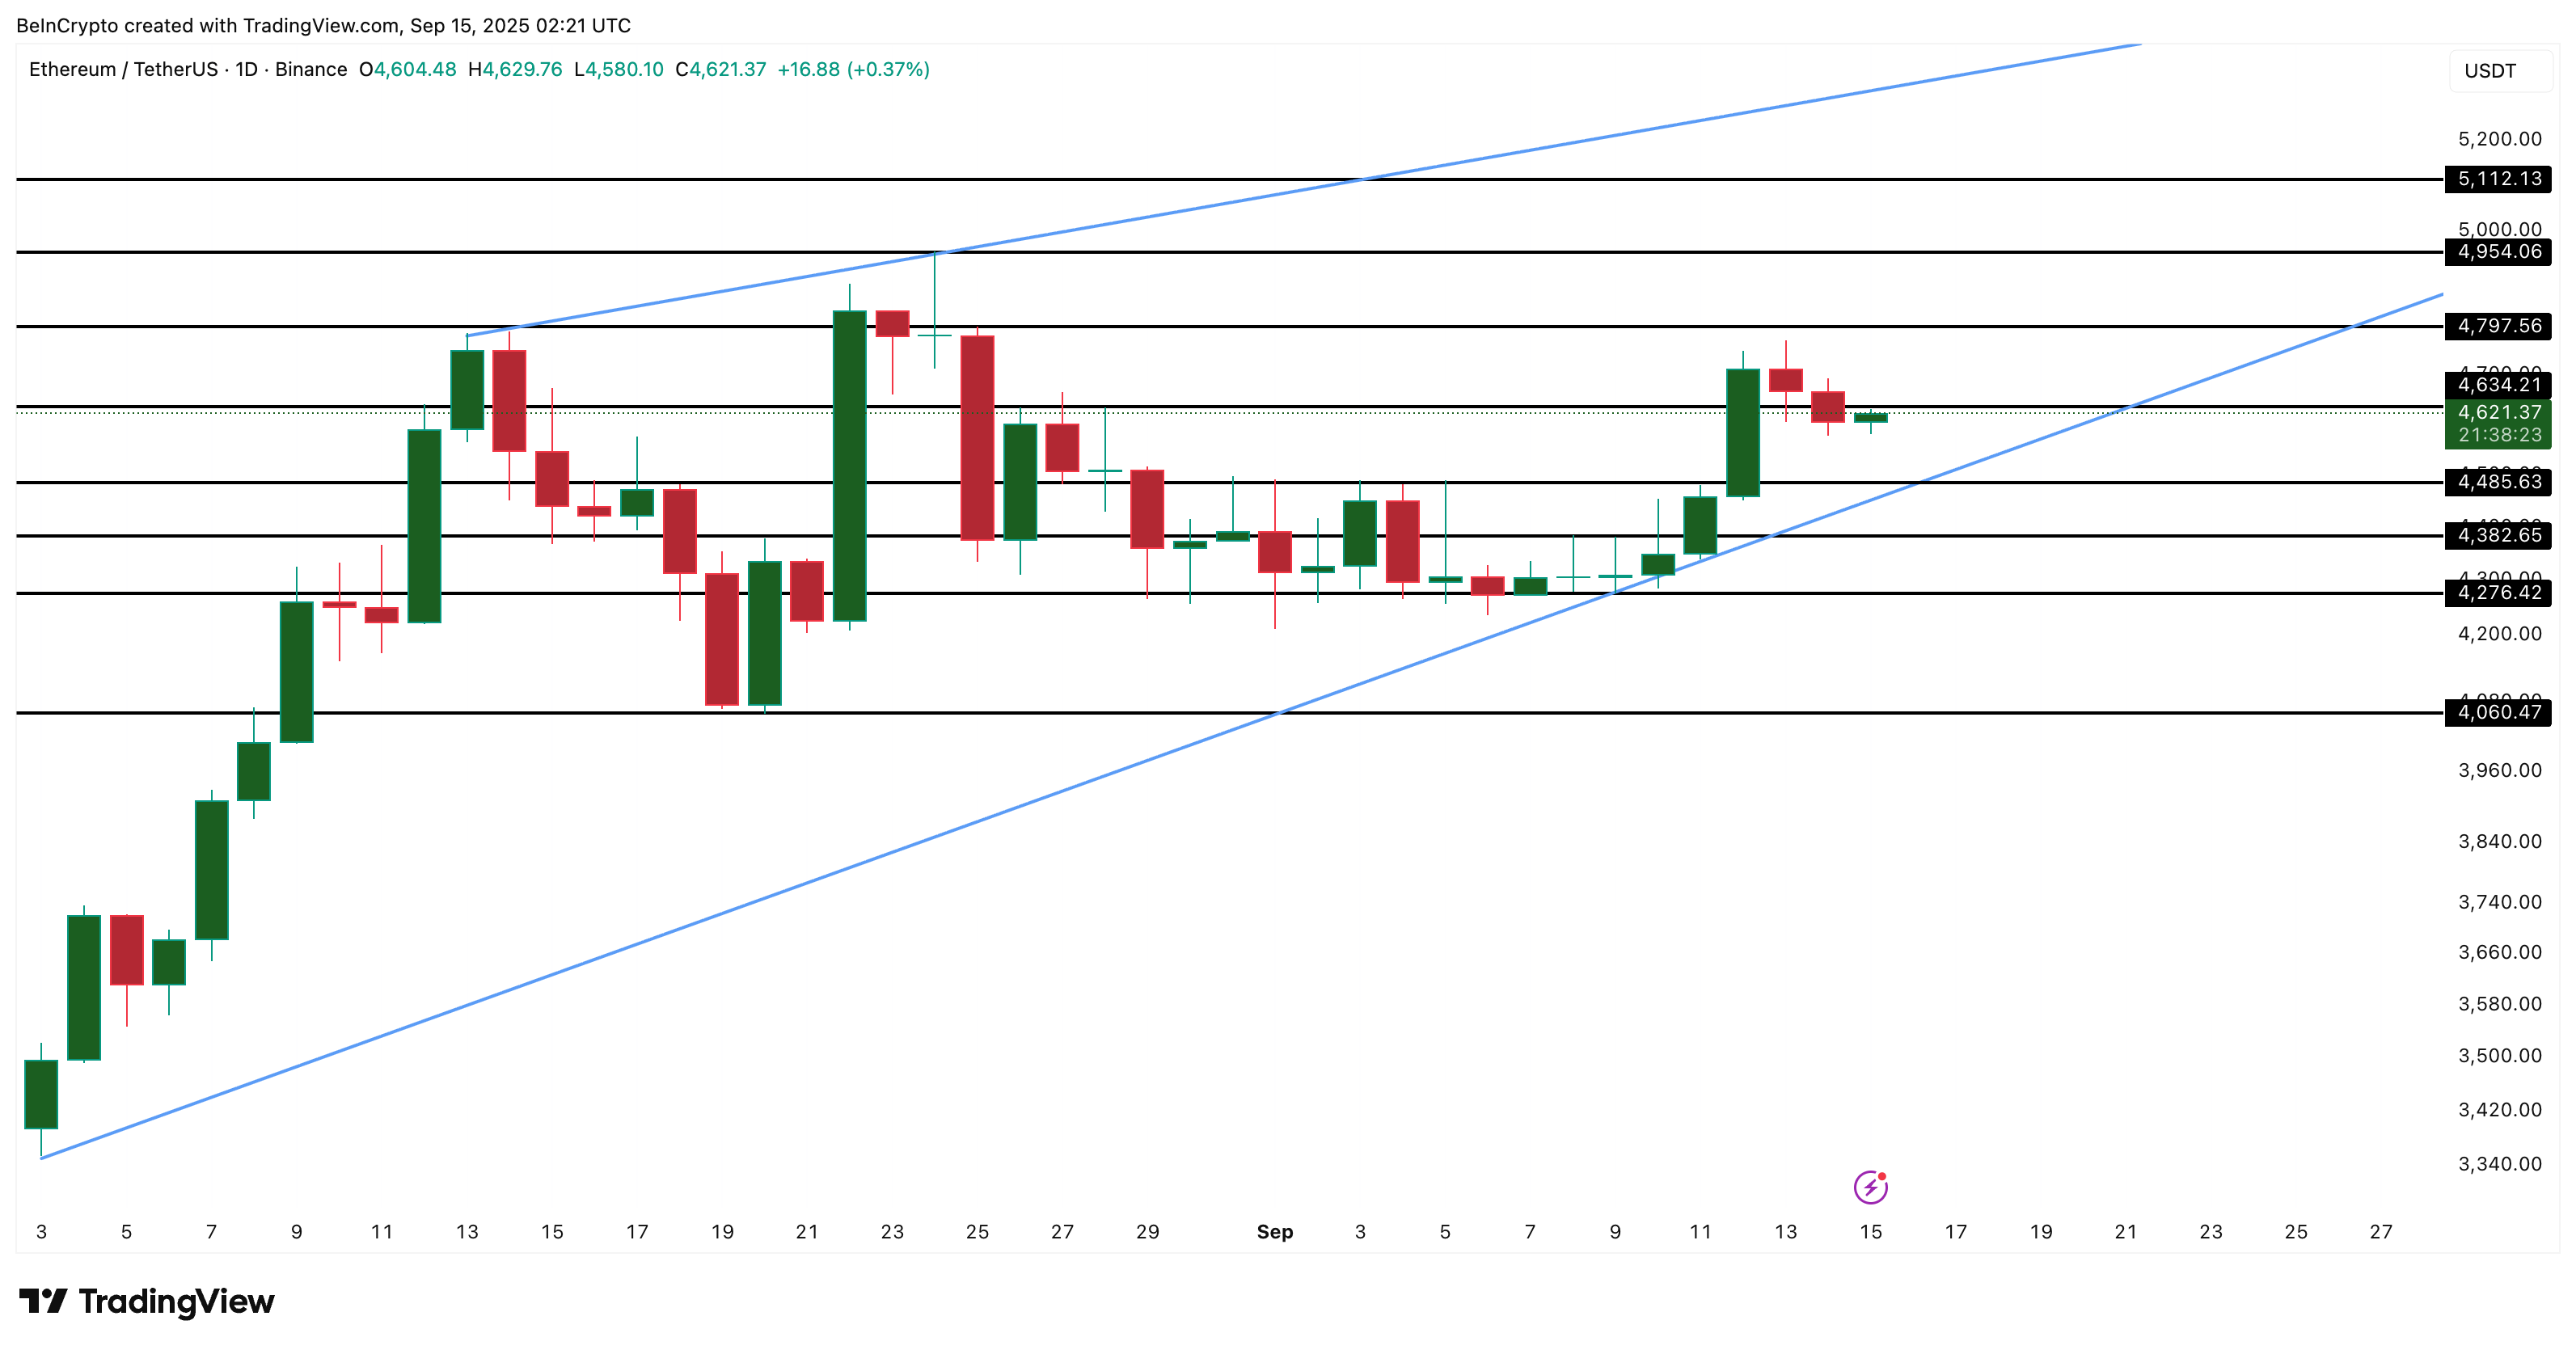
ETH already slipped under $4,634 support and is now holding at $4,620, close to the lower wedge trendline. If that line breaks, supports at $4,485 and $4,382 come into play. If selling accelerates, a deeper drop to $4,276 or even $4,060 WOULD be possible.
While the 4-hour signals suggest a modest correction, the daily wedge threatens something bigger if its lower boundary fails.
With September’s track record, this setup cannot be ignored. Yet, if the Ethereum price manages to reclaim $4,634 with a daily candle close above it, then it’s not just a breakout; the short-term bearish outlook will weaken. Things will turn bullish again if the ETH price reclaims $4,797.
