MemeCore Soars to Stunning All-Time High—But Ominous Market Signals Flash Crash Warnings

MemeCore isn’t just climbing—it’s exploding. The token just smashed through its previous records, hitting a breathtaking all-time high that’s got the crypto world buzzing. Retail traders are piling in, influencers are hyping it, and for a moment, it feels like easy money. But look closer.
Behind the Euphoria
Market signals are whispering what the crowd is ignoring. Rising sell pressure from early whales, declining momentum in key trading pairs, and leveraged long positions reaching dangerous levels. Sound familiar? It should. This isn’t innovation—it’s speculation in its purest, most fragile form.
Timing the Tumble
Every pump has its dump. History doesn’t just rhyme; it remixes. When tokens like this go parabolic, corrections aren’t just likely—they’re inevitable. The only question is who gets out before the music stops. Smart money is already trimming exposure, while the rest are left hoping their exit liquidity isn’t, well… theirs.
Another day, another crypto asset acting like it’s exempt from gravity—until it isn’t. Trade carefully.
Traders Brace for Correction Despite Price Surge
Readings from the M/USD one-day chart show its Relative Strength Index (RSI) flashing overbought conditions, indicating bullish momentum could be losing steam. As of this writing, this key indicator is 87.04 and remains in an uptrend.
: Want more token insights like this? Sign up for Editor Harsh Notariya’s Daily crypto Newsletter here.
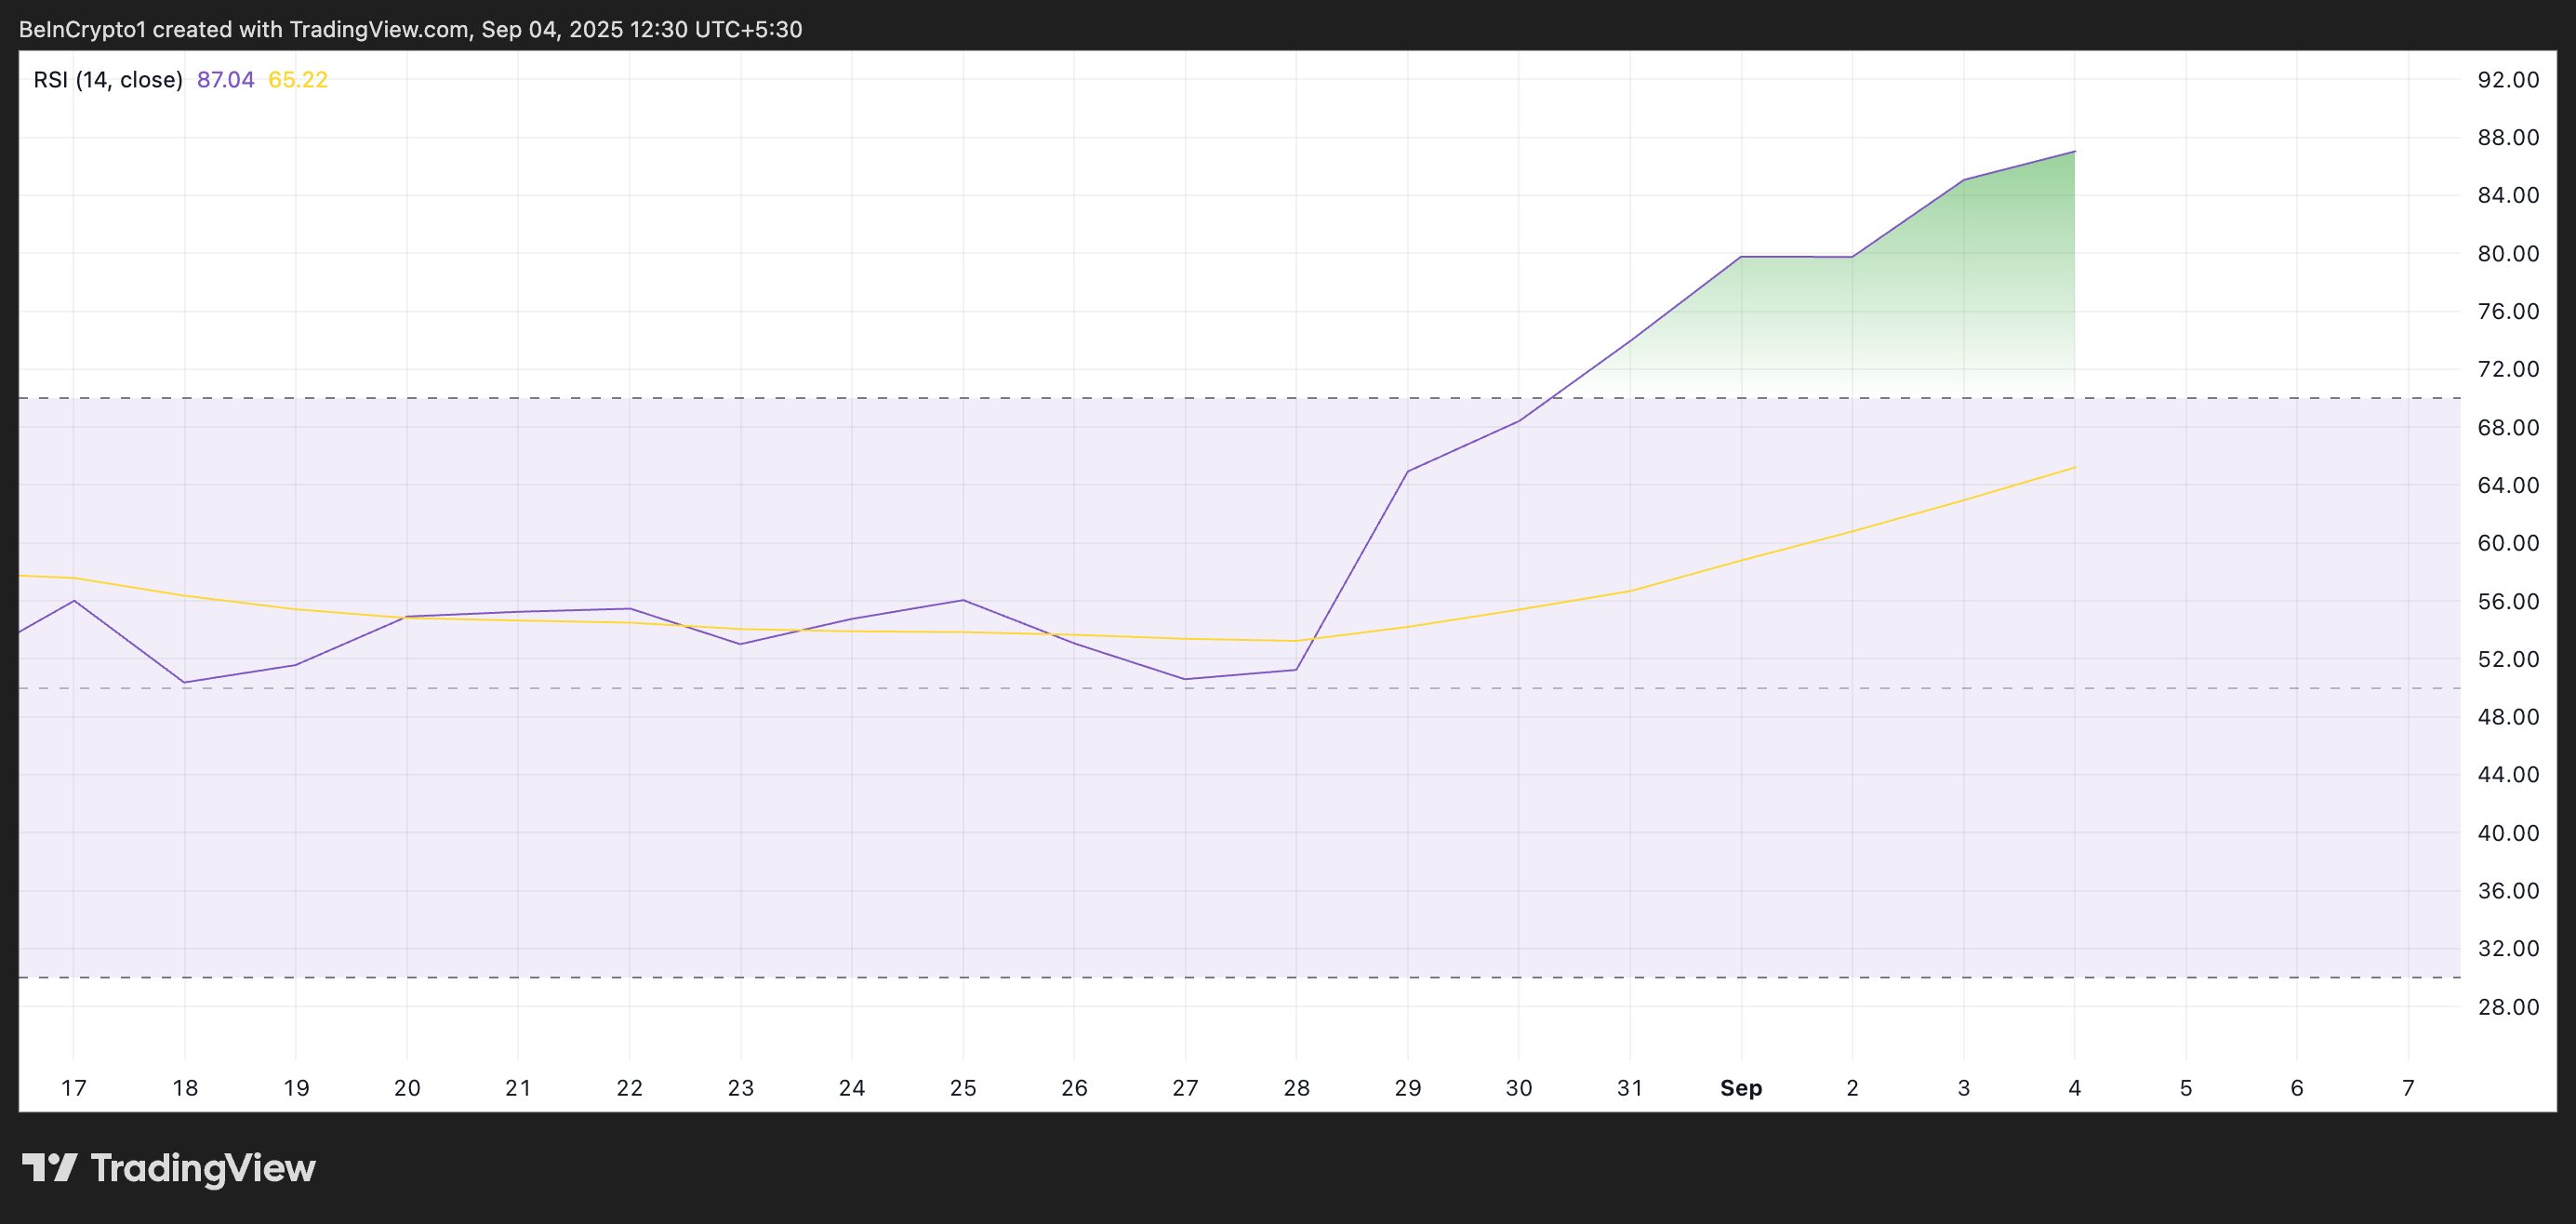
The RSI indicator measures an asset’s overbought and oversold market conditions. It ranges between 0 and 100. Values above 70 suggest that the asset is overbought and due for a price decline, while values under 30 indicate that the asset is oversold and may witness a rebound.
M’s current RSI of 87.04 places it DEEP into the overbought zone. Such extreme readings usually precede profit-taking by traders, which can trigger price pullbacks. If selling pressure builds, M may struggle to hold on to its recent gains, raising the possibility of a short-term correction.
Additionally, M’s funding rate across the derivatives markets has remained significantly negative, reflecting that traders are still heavily positioned against the asset. At press time, per Coinglass data, this stands at 0.094%.
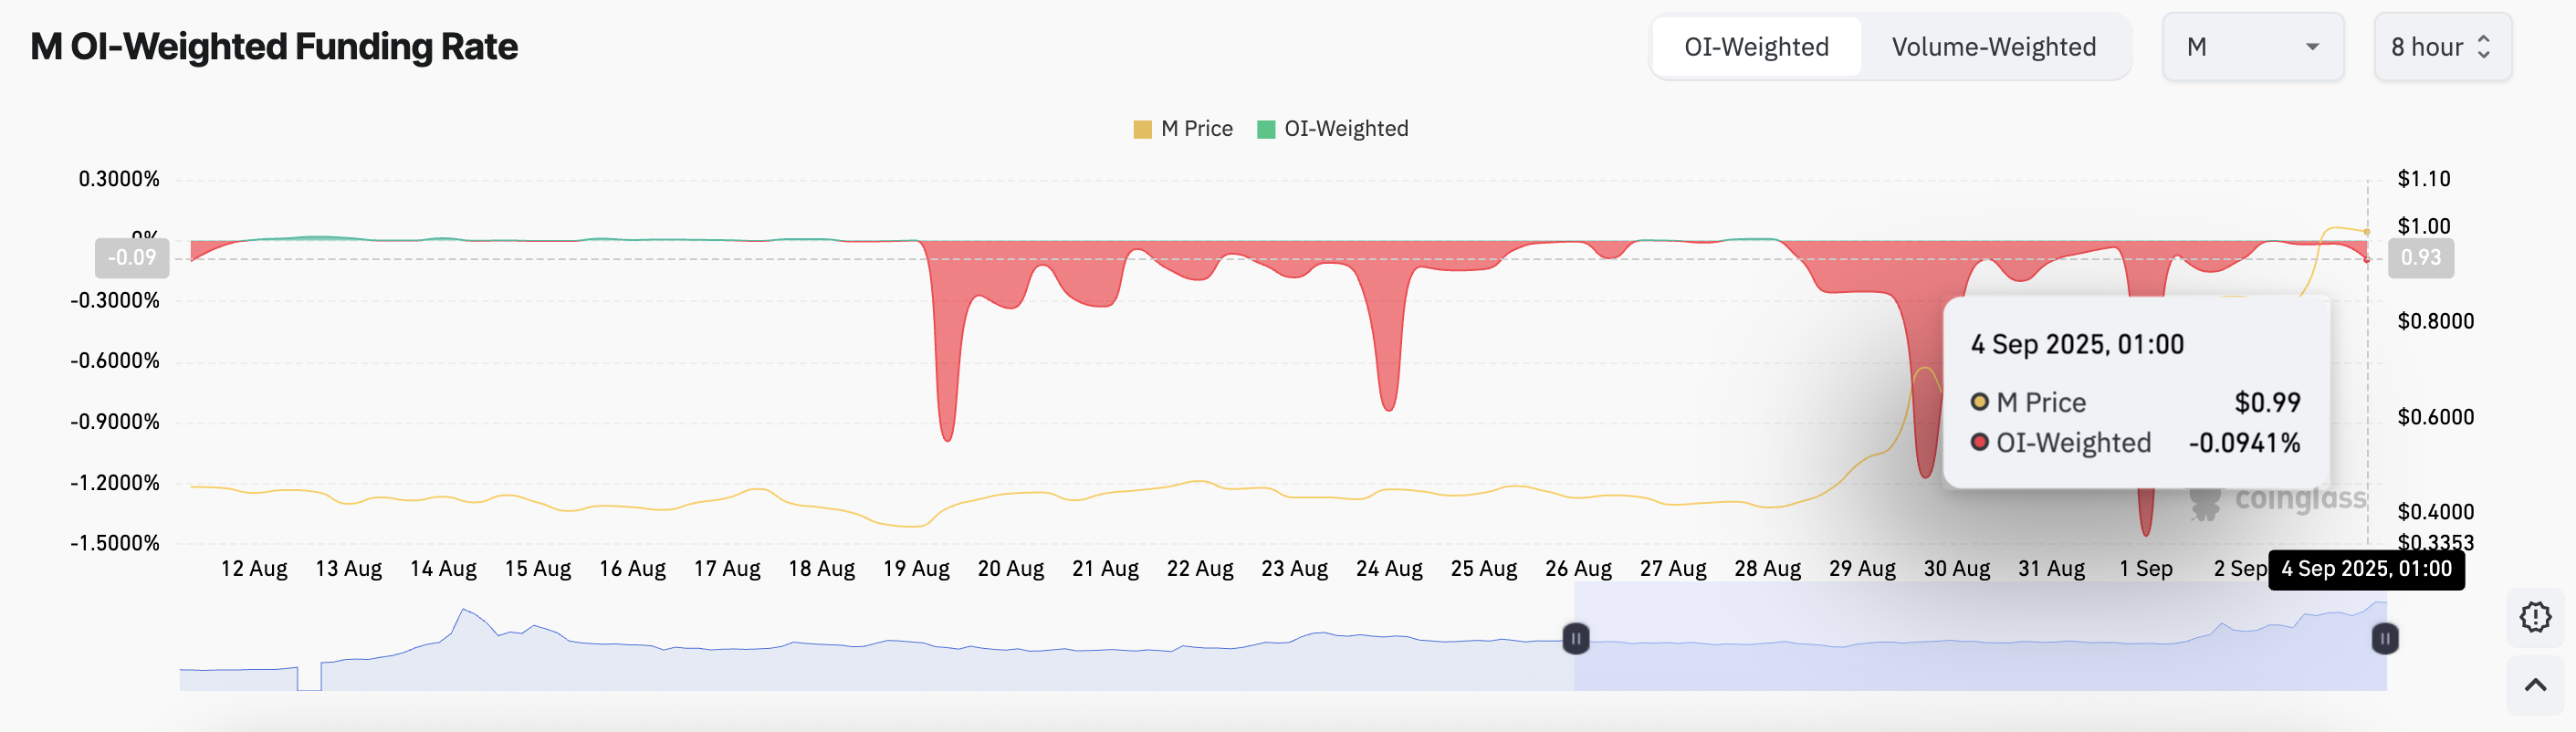
The funding rate is used in perpetual futures contracts to keep the contract price aligned with the spot price. When the rate turns negative, short traders dominate and are paid by long traders to maintain their positions.
M’s persistently poor funding rate highlights the strong bearish bias against it in the derivatives market. Despite its price rally over the past week, its futures traders continue overwhelmingly positioning for a downside move, showing a lack of confidence.
M Could Rally to $1.17 or Slide Toward $0.74
At press time, M hovers above the support formed at $0.93. Once buyers’ exhaustion sets in, M may attempt to test this support floor. The bulls’ failure to defend this price level could trigger a decline toward $0.74.
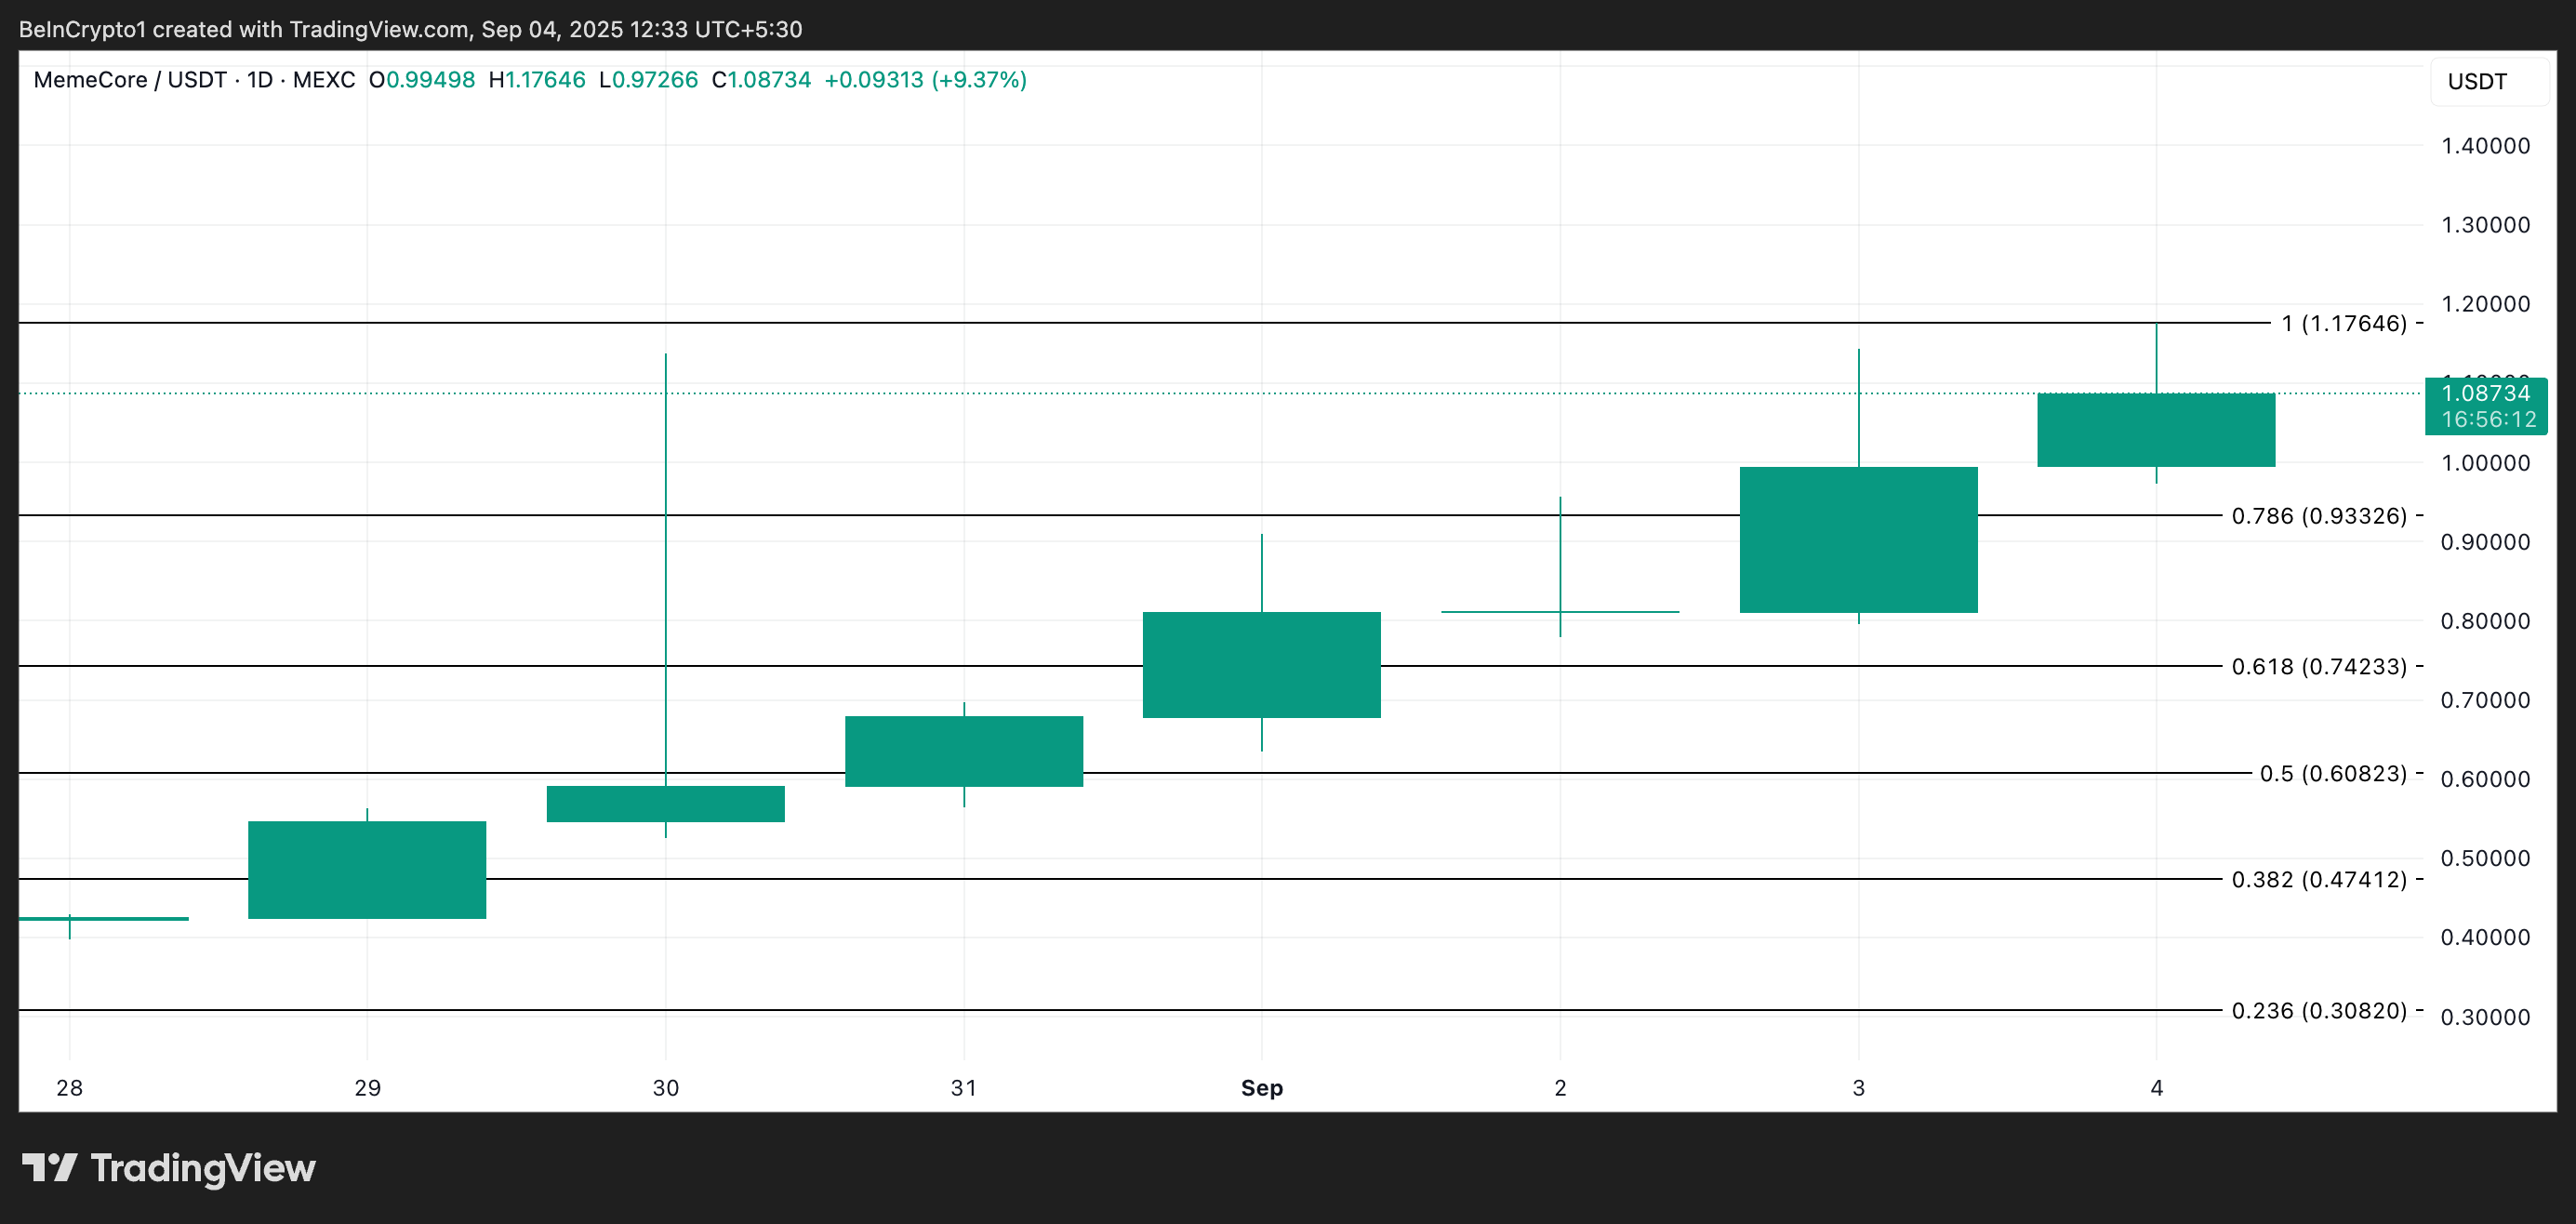
However, if the bulls maintain dominance, they could drive M to reclaim its all-time high of $1.17, and even attempt a rally above it.
