HBAR Price Rebound Imminent as Bears Lose Their Grip - Here’s Why

Bears are retreating—HBAR's momentum is shifting fast.
The tide turns
Short positions are unwinding across exchanges as buying pressure builds. Resistance levels that held for weeks are now cracking under sustained volume. Traders who bet against the rebound are getting squeezed—hard.
Technical breakout underway
Chart patterns signal a classic reversal formation completing. The 50-day moving average just flipped from resistance to support—a key psychological milestone for institutional algos. Volume spikes confirm genuine interest, not just speculative noise.
Market sentiment flips
Fear-dominated trading makes way for cautious optimism. Whales accumulate quietly while retail hesitates—typical early-cycle behavior. Network fundamentals strengthen behind the scenes as enterprise adoption continues ticking upward.
Just remember—in crypto, 'imminent' sometimes means 'sometime before the next Fed meeting ruins everything again.'
Early Buying Signals Emerge on the 4-Hour Chart
On the 4-hour chart, the Money Flow Index (MFI) — which tracks inflows and outflows of capital — has been trending higher, even printing higher highs while the HBAR price kept falling. This hasn’t appeared on the daily chart yet because short-term dip-buying usually registers first on lower timeframes.
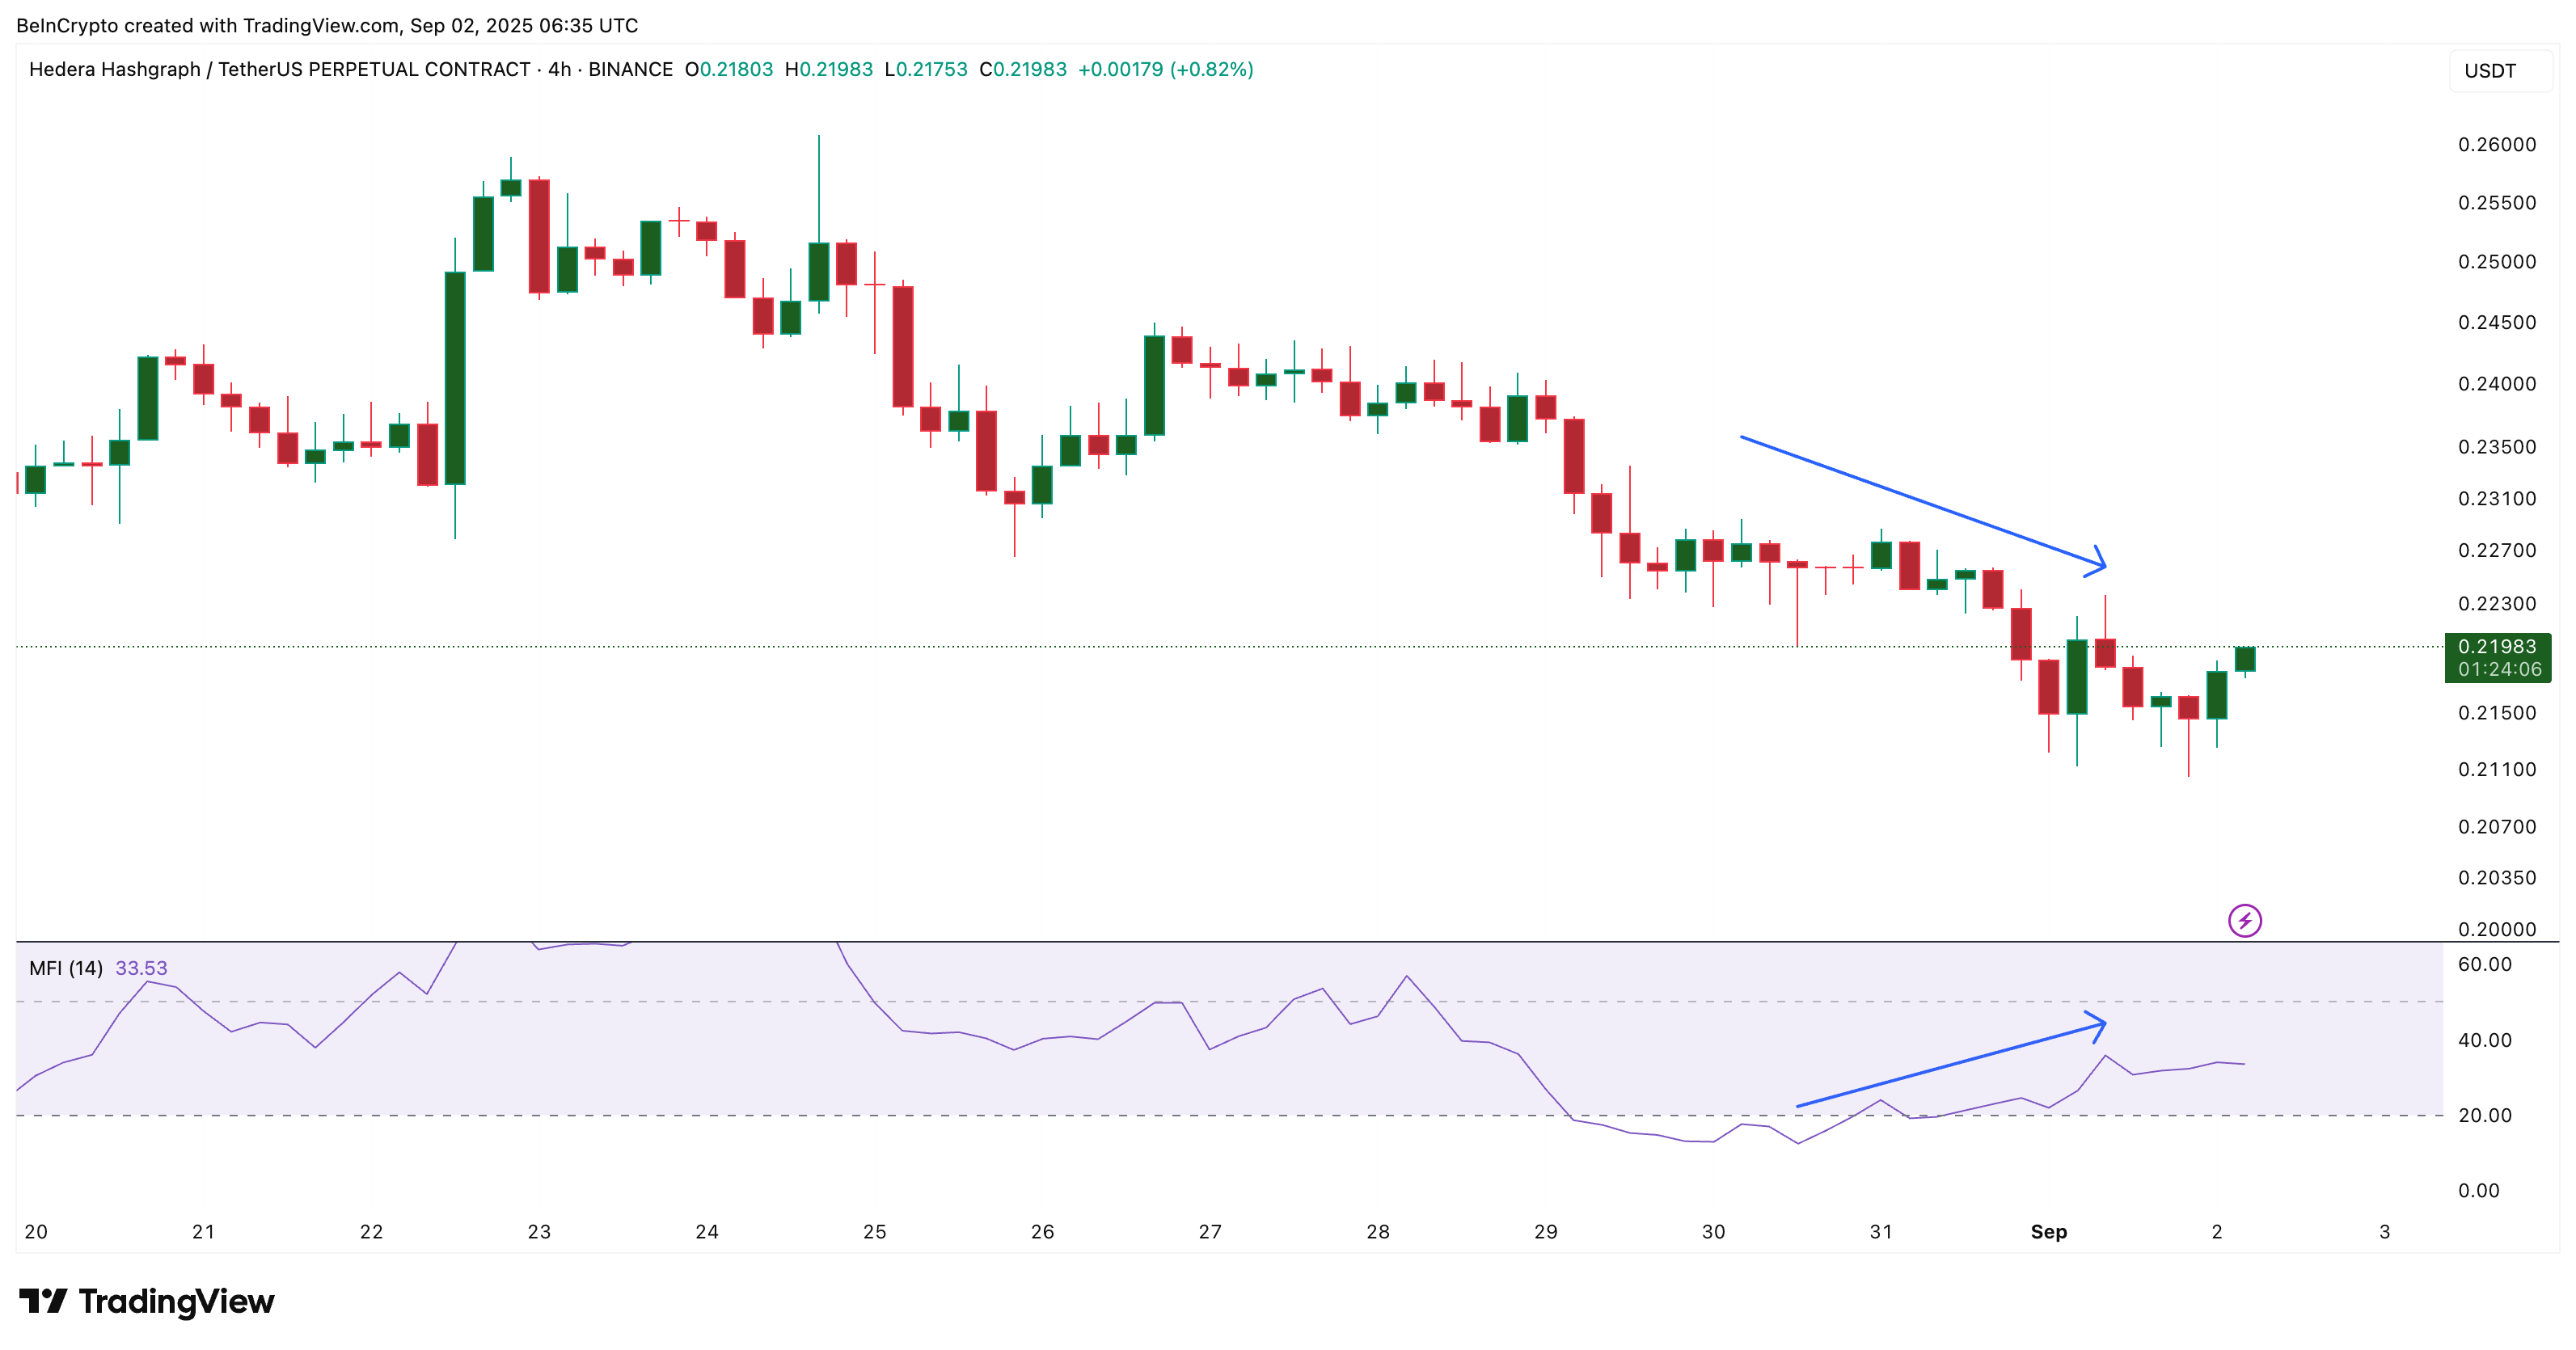
The significance: it hints that capital rotation into HBAR has already started. A move above 35.90 (previous high) on the MFI could confirm this accumulation-led bullishness
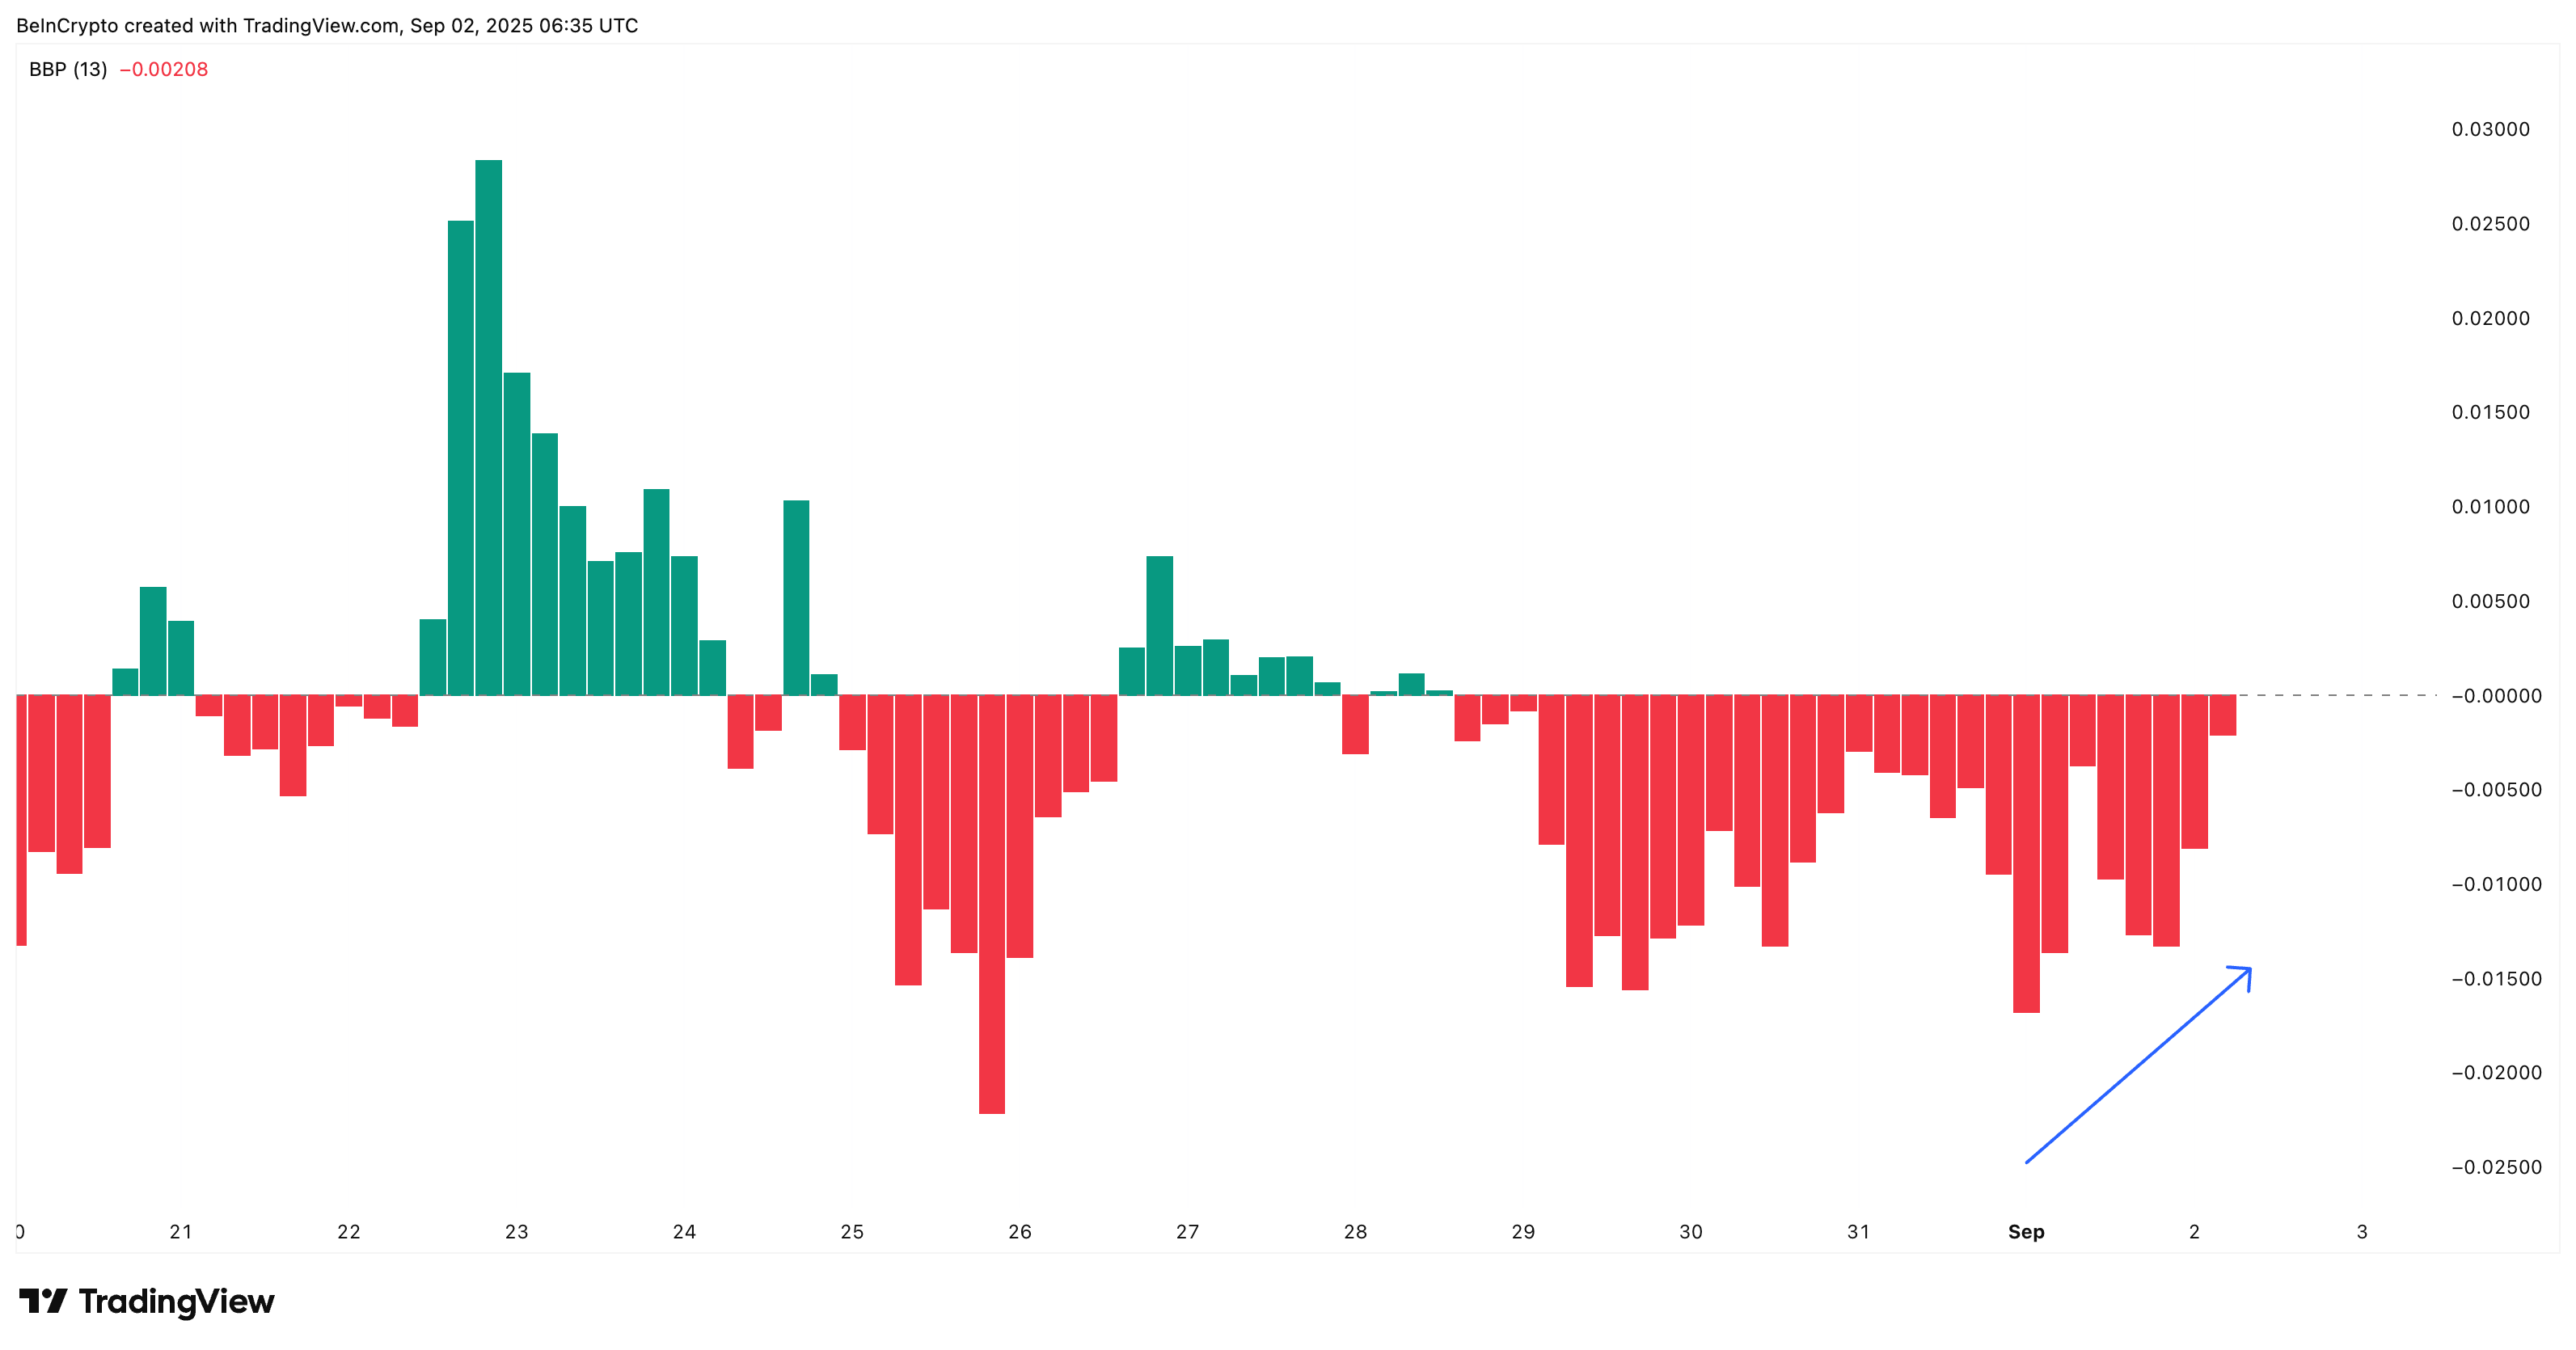
At the same time, Bull–Bear Power (BBP), which measures buyer vs seller strength, has been declining since September 1. That means bearish dominance is fading, while dip buying continues.
Together, these 4-hour signals suggest that while HBAR price is not out of the woods yet, the tide may be turning.
: Want more token insights like this? Sign up for Editor Harsh Notariya’s Daily crypto Newsletter here.
Daily HBAR Price Chart Divergence Could Spark a Rebound
On the daily chart, the HBAR price remains within a descending triangle, with Fibonacci retracement levels serving as markers. The critical support sits at $0.210 — losing it could open the door to $0.187. On the upside, reclaiming $0.235–$0.249 WOULD be the first clear sign that bearish control is being invalidated.
And there is some validation for this optimism.
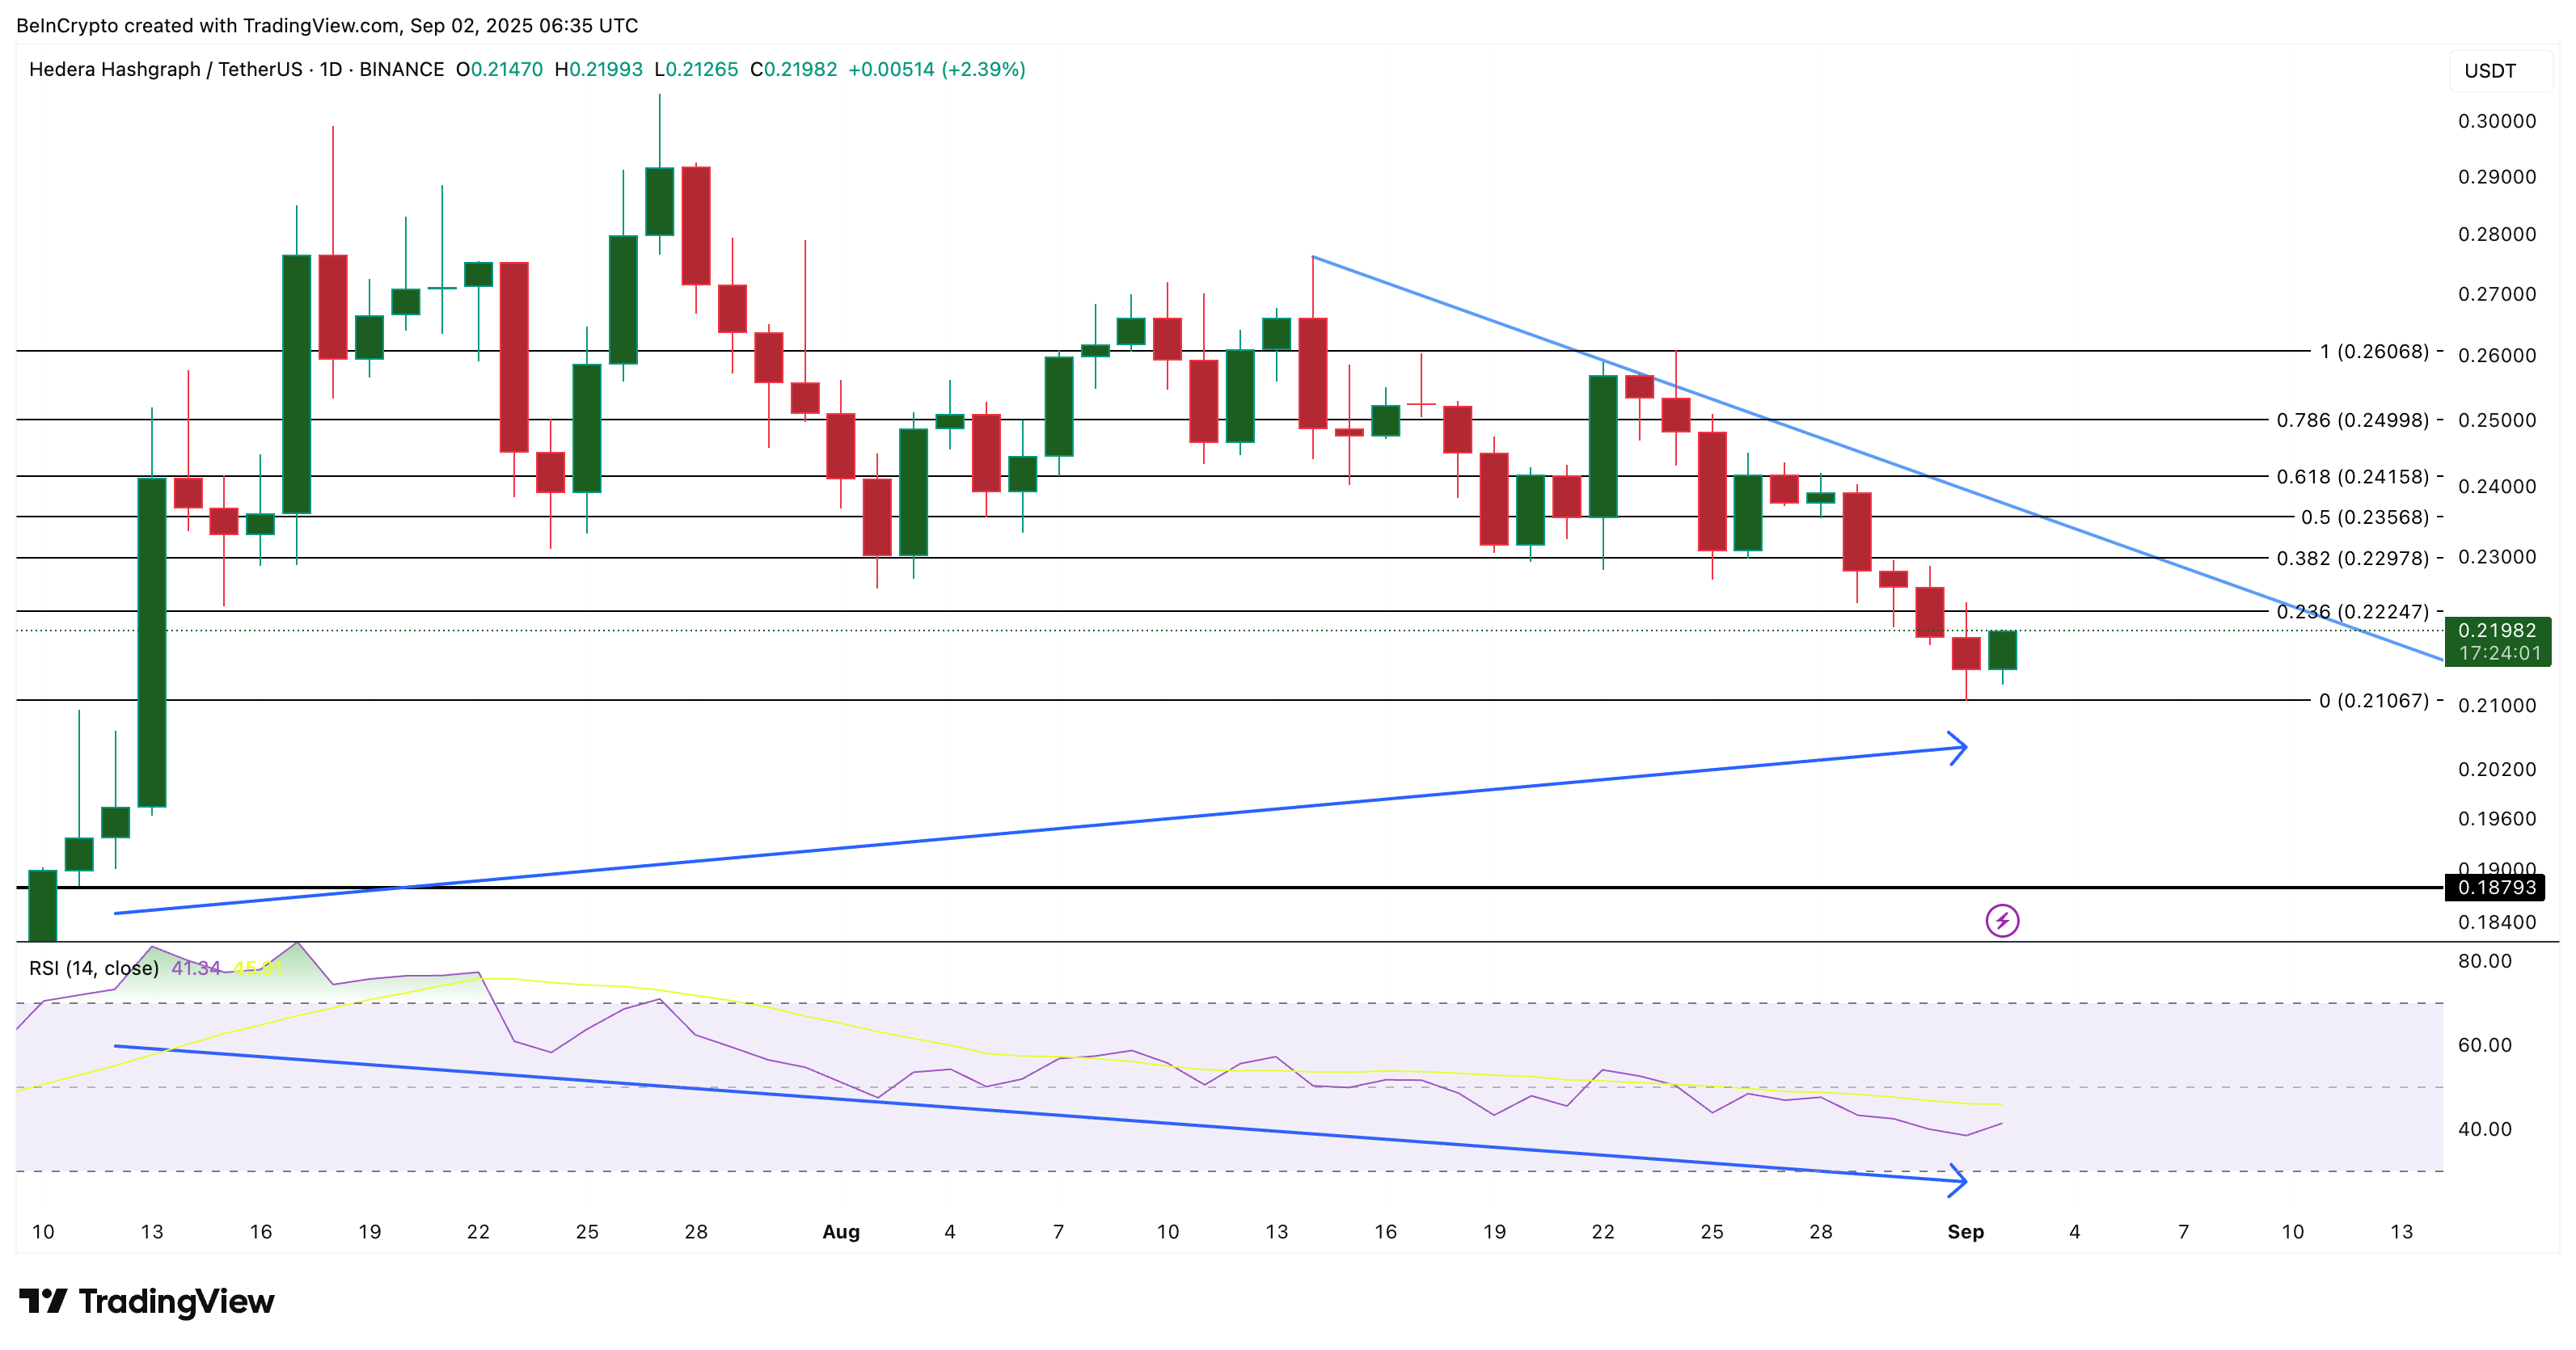
Between July 13 and September 2, HBAR price formed a higher low, while the Relative Strength Index (RSI) — which tracks momentum — carved a lower low.
This is a hidden bullish divergence, often signaling continuation of the broader trend. Considering HBAR’s 330% yearly gains, it aligns with the idea that the bigger picture remains intact, even if near-term pressures linger.
If buyers defend $0.210 and reclaim $0.235–$0.249, this divergence could be the spark for a sustained rebound and even a rally if the broader market conditions align.
