Solana Price Doubles While Network Activity Crashes: Analysts Sound Bearish Divergence Alarm

Solana rockets to dizzying heights as usage metrics plunge—creating the most dangerous kind of crypto divergence.
The Great Contradiction
SOL's price defies gravity with a 100% surge while network activity collapses. Transactions stall, active addresses dwindle, and engagement metrics flash red—all while the token price screams upward. Classic crypto behavior: price charts ignore fundamentals until they don't.
Analysts See Red Flags
Technical analysts spot bearish divergence patterns forming—when price action and underlying metrics move in opposite directions. Historically, these patterns precede brutal corrections. One quant firm notes it's like watching a rocket fuel tank emptying during ascent.
The Institutional Dilemma
Fund managers face allocation headaches—chasing momentum versus respecting deteriorating fundamentals. Some hedge funds reportedly take profits while retail FOMO kicks in. Because nothing says 'healthy market' like professionals exiting while amateurs pile in.
Network Health Check
Developer activity slows, DEX volumes contract, and NFT trading withers—yet the token price doubles. The disconnect screams either visionary early adoption or spectacular bubble behavior. Place your bets accordingly.
Remember: in traditional finance, this would trigger emergency meetings. In crypto, it gets celebrated as 'innovation' until the leverage unwinds.
Solana’s Network Activity Drops Sharply Over the Past Four Months
Maksim, founder of Santiment, pointed out that despite the rising SOL price, network activity—including active addresses and network growth—has slowed.
Since May, daily active addresses have fallen from 6 million to just 1 million, and network growth has also declined from 4.9 million to 1 million.
The accompanying chart shows a classic bearish divergence: price climbs while on-chain metrics MOVE in the opposite direction.
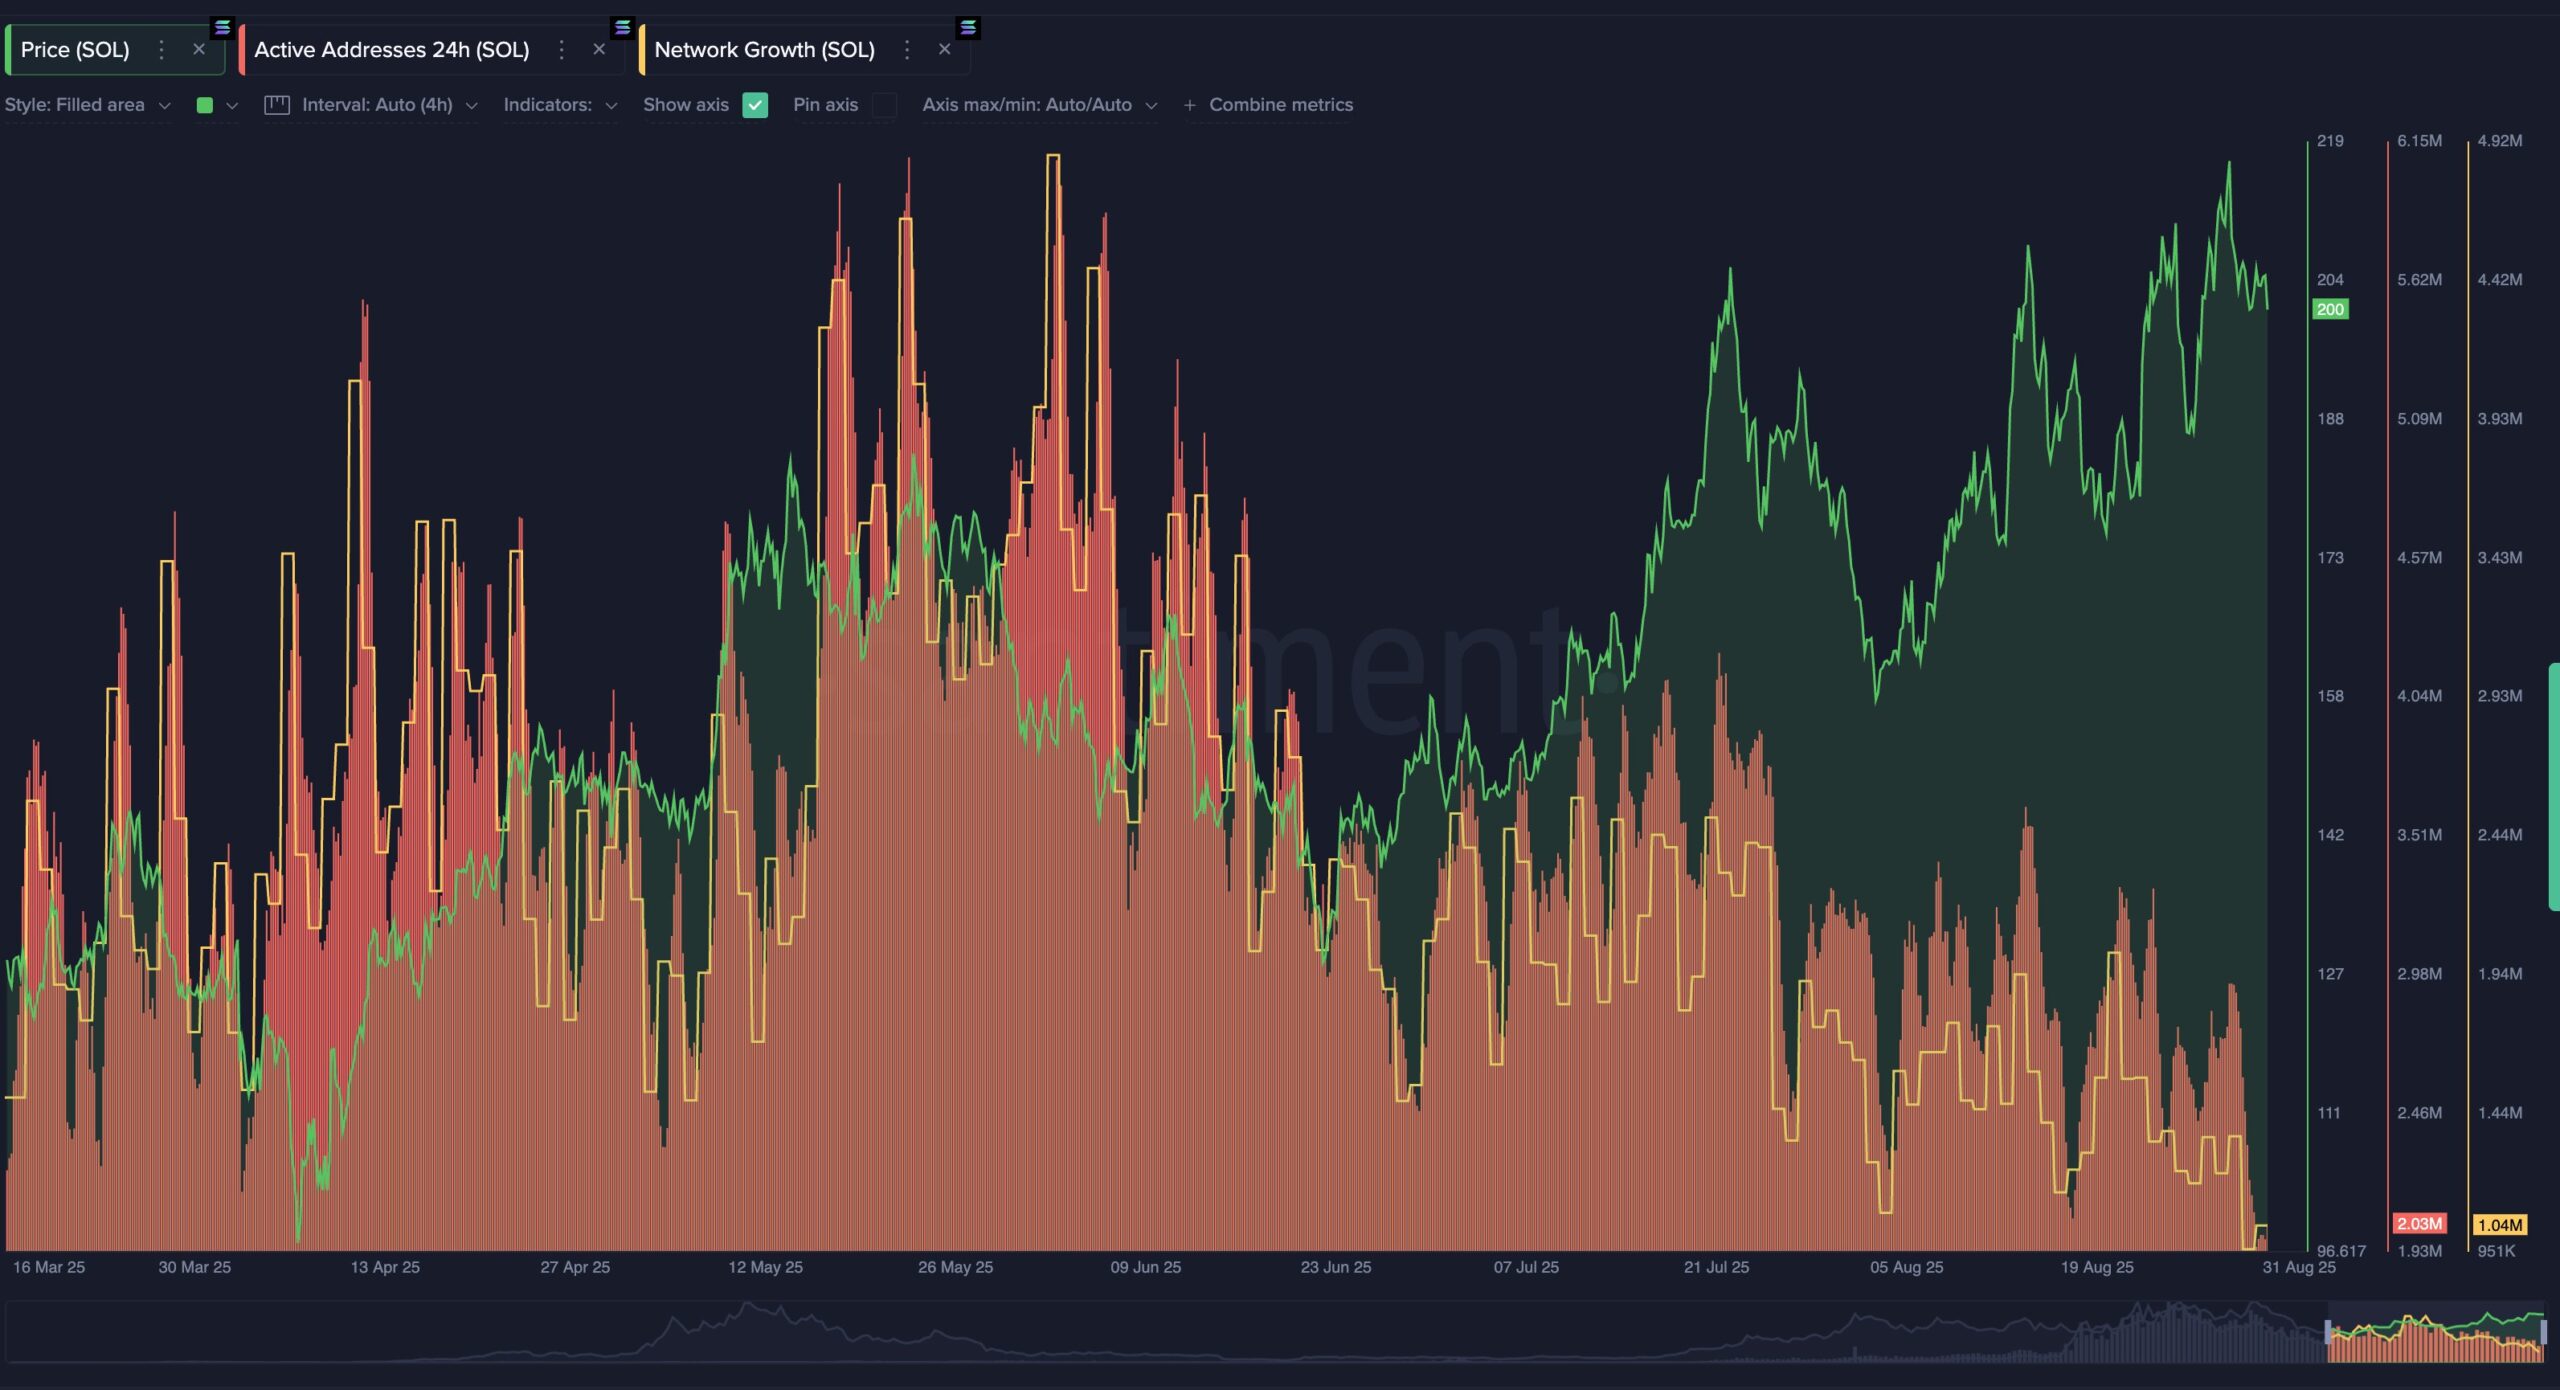
Maksim noted that historically, this pattern often signals a trend reversal and could serve as a warning for investors.
“Early data shows familiar patterns. Right now, we’re seeing a classic bearish divergence: price pushing up while network activity lags. Historically, this often signals a trend shift,” Maksim said.
Santiment’s report added that based on historical data, such patterns usually lead to a sharp reversal, with about a 90% probability.
BeInCrypto also reported that solana DEX traders have dropped by 90% over the past year, reflecting weaker demand for tokens within the Solana ecosystem.
Market Sentiment Toward SOL Remains Positive
Despite falling network activity, SOL’s price has climbed from below $100 in April to above $200, according to BeInCrypto.
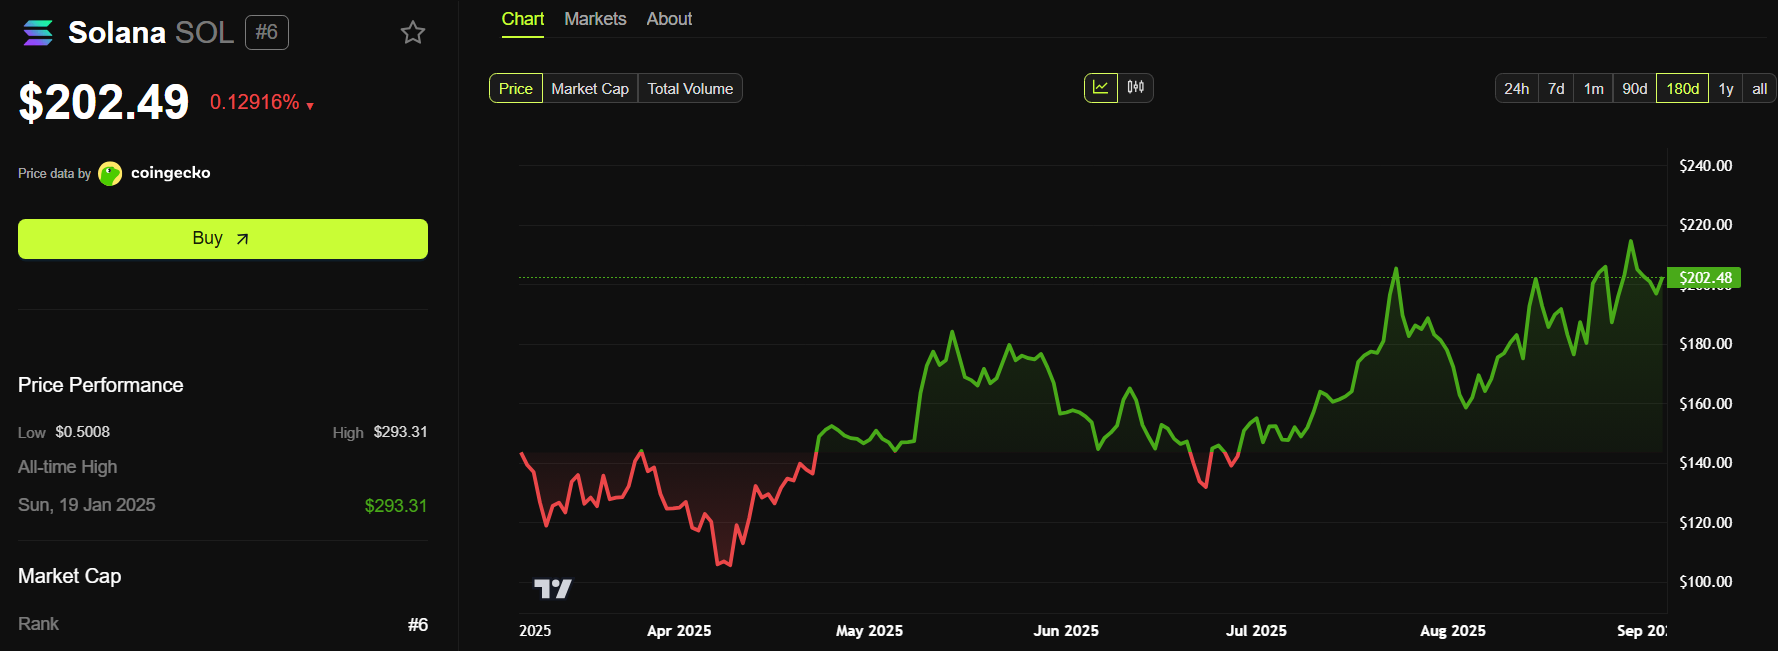
Traders ignore negative on-chain signals and continue buying SOL, expecting further price gains.
Several top asset managers—including Fidelity, VanEck, and Franklin Templeton—recently amended their Solana ETF filings with the SEC. Analysts estimate the probability of approval now exceeds 90%. Market forecasts suggest a Solana ETF could attract up to $8 billion in inflows.
SOL has also become part of the wave of strategic crypto reserves. Public companies such as Sharps Technology, Artelo Biosciences, and Ispecimen have raised hundreds of millions to build strategic SOL reserves.
Despite weakening network activity, these drivers may have supported SOL’s upward momentum in the spot market.
