Bitcoin’s Price Recovery Could Skyrocket Once This Key Resistance Breaks

Bitcoin teeters on the edge of a major breakout—and traders are watching one critical level.
THE BREAKOUT ZONE
Market analysts point to a specific resistance barrier that's kept BTC contained. Clearing that hurdle could trigger cascading buy orders from institutional players sitting on the sidelines.
Technical charts show consolidation patterns tightening like a spring. Volume indicators suggest accumulating interest just beneath current levels. Whales aren't selling—they're waiting.
Traditional finance pundits still dismiss it as 'digital gambling,' yet somehow Bitcoin keeps outpacing their precious bonds and gold ETFs. The recovery isn't just coming—it's primed to explode past expectations once that key wall falls.
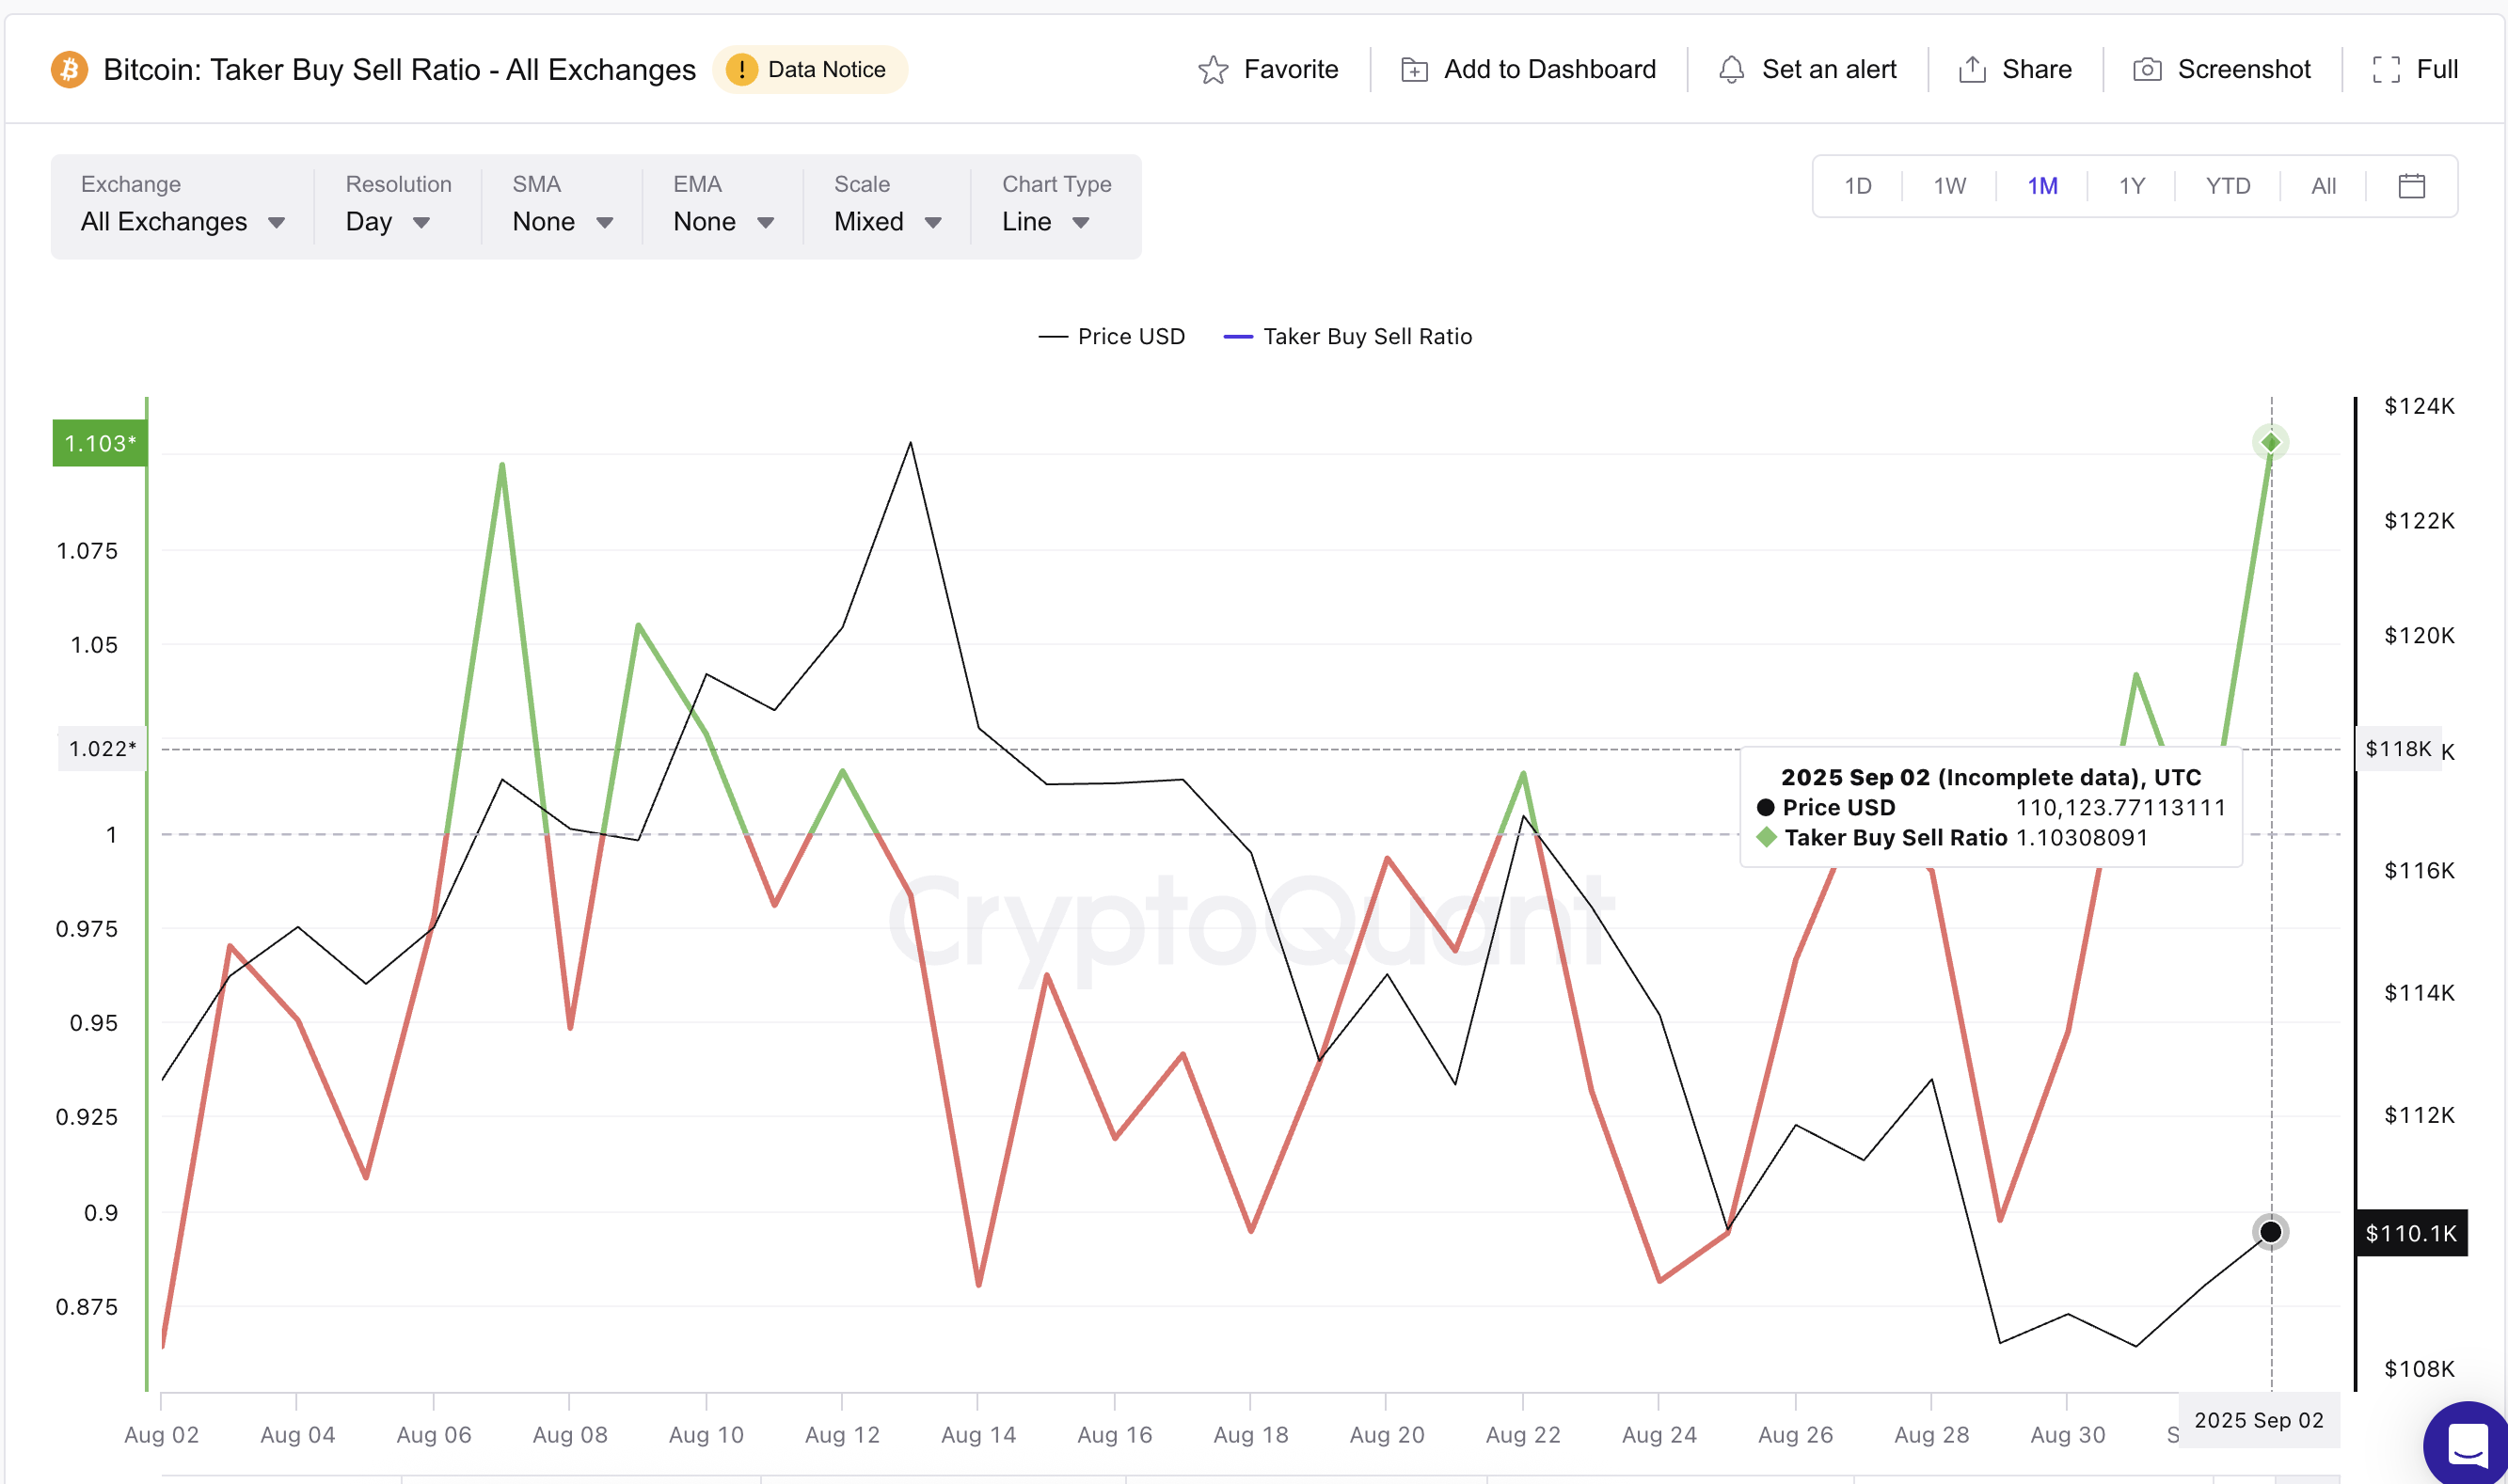
Derivatives Overheat, But Downside Looks Limited
Across exchanges, Bitcoin’s Taker Buy/Sell ratio has surged to monthly highs around 1.10. This ratio compares market buy volume to sell volume, and high readings typically show bullish sentiment in the derivatives market. While that Optimism often coincides with local tops and short corrections, downside risk looks tempered this time.
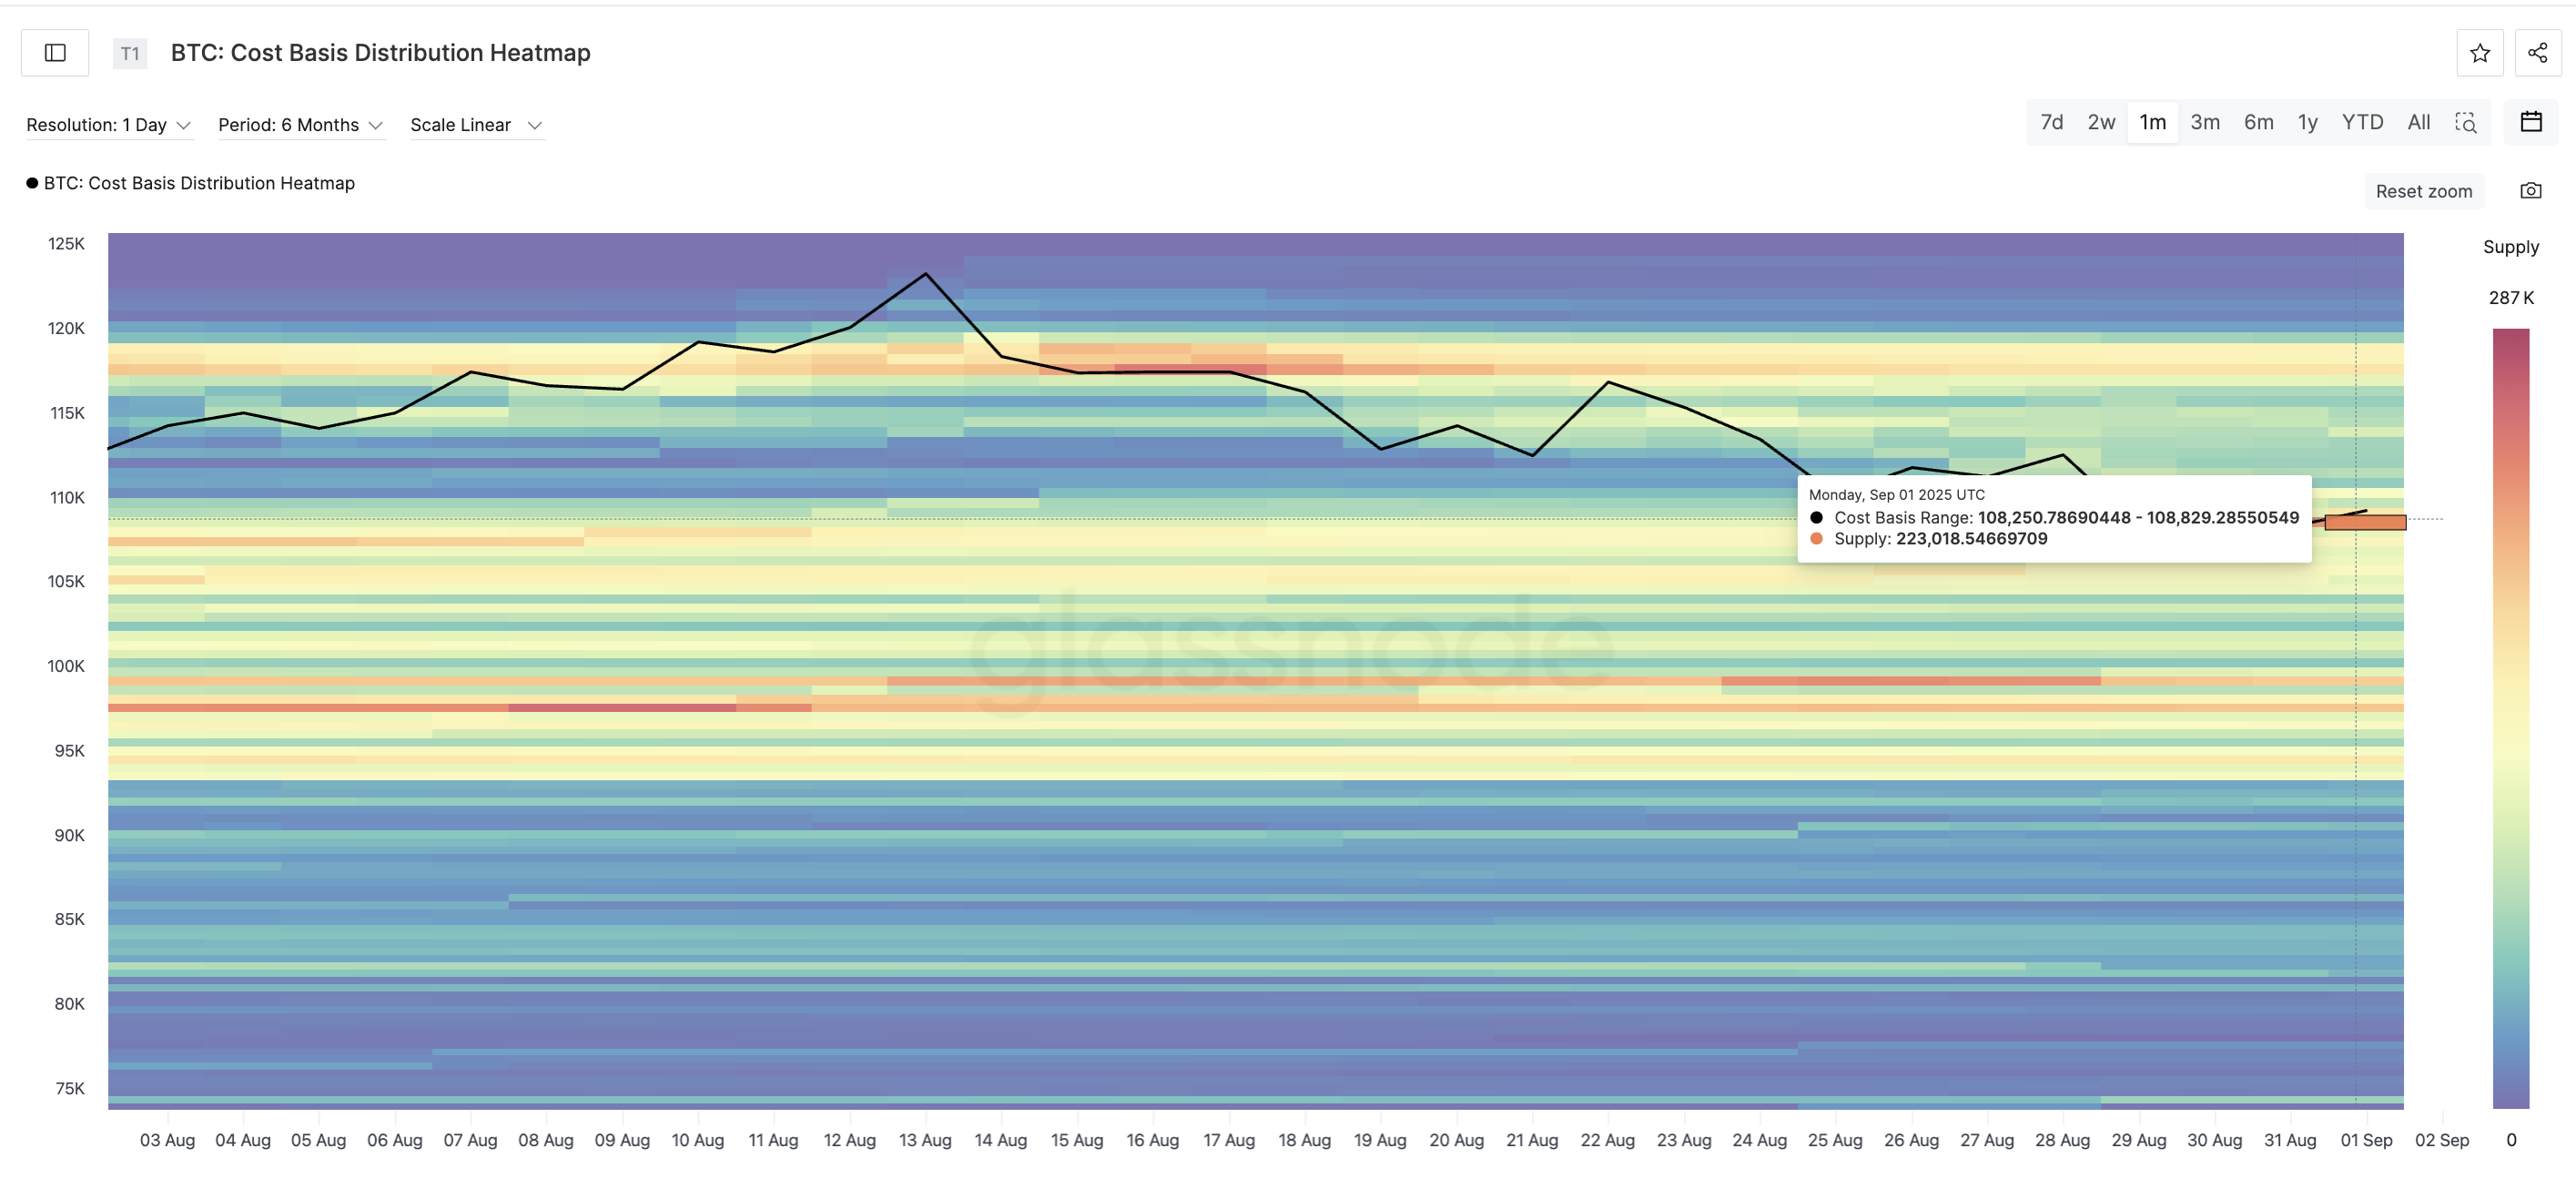
Heatmap data shows strong clusters of cost basis resistance between $109,995 and $111,768, where nearly 268,000 BTC sit accumulated. If this zone is cleared, upside momentum could extend sharply, more so with the strong bullish sentiment in play. The image highlights the strongest zone of the cluster: between $109,995 and $110,583.
: Want more token insights like this? Sign up for Editor Harsh Notariya’s Daily crypto Newsletter here.
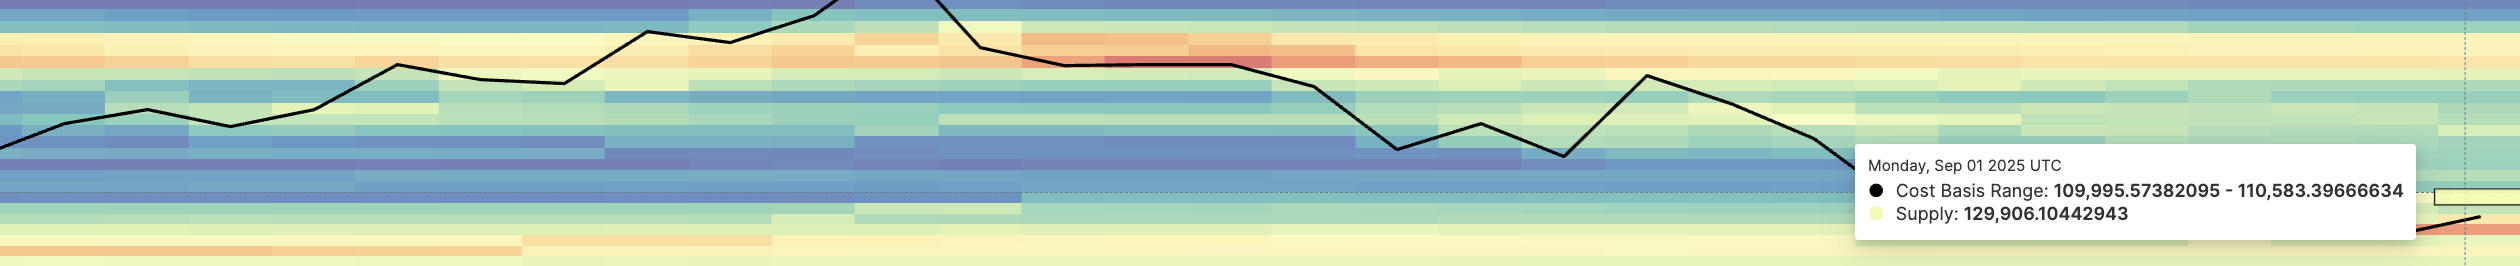
On the downside, another cluster between $108,250 and $108,829 holds more than 223,000 BTC, providing strong support.
Unless heavy selling emerges, this floor limits the risk of deeper Bitcoin price corrections, even if derivatives positioning cools off. But big sellers aren’t that active now.
A cost basis heatmap shows where large amounts of Bitcoin were last bought, highlighting price levels that act as strong support or resistance.
Whales Stay Muted, Selling Pressure Eases
A second reason the pullback risk looks limited comes from whales. The exchange-to-whale ratio has dropped from 0.54 to 0.44 since August 29, one of the lowest levels, month-on-month.
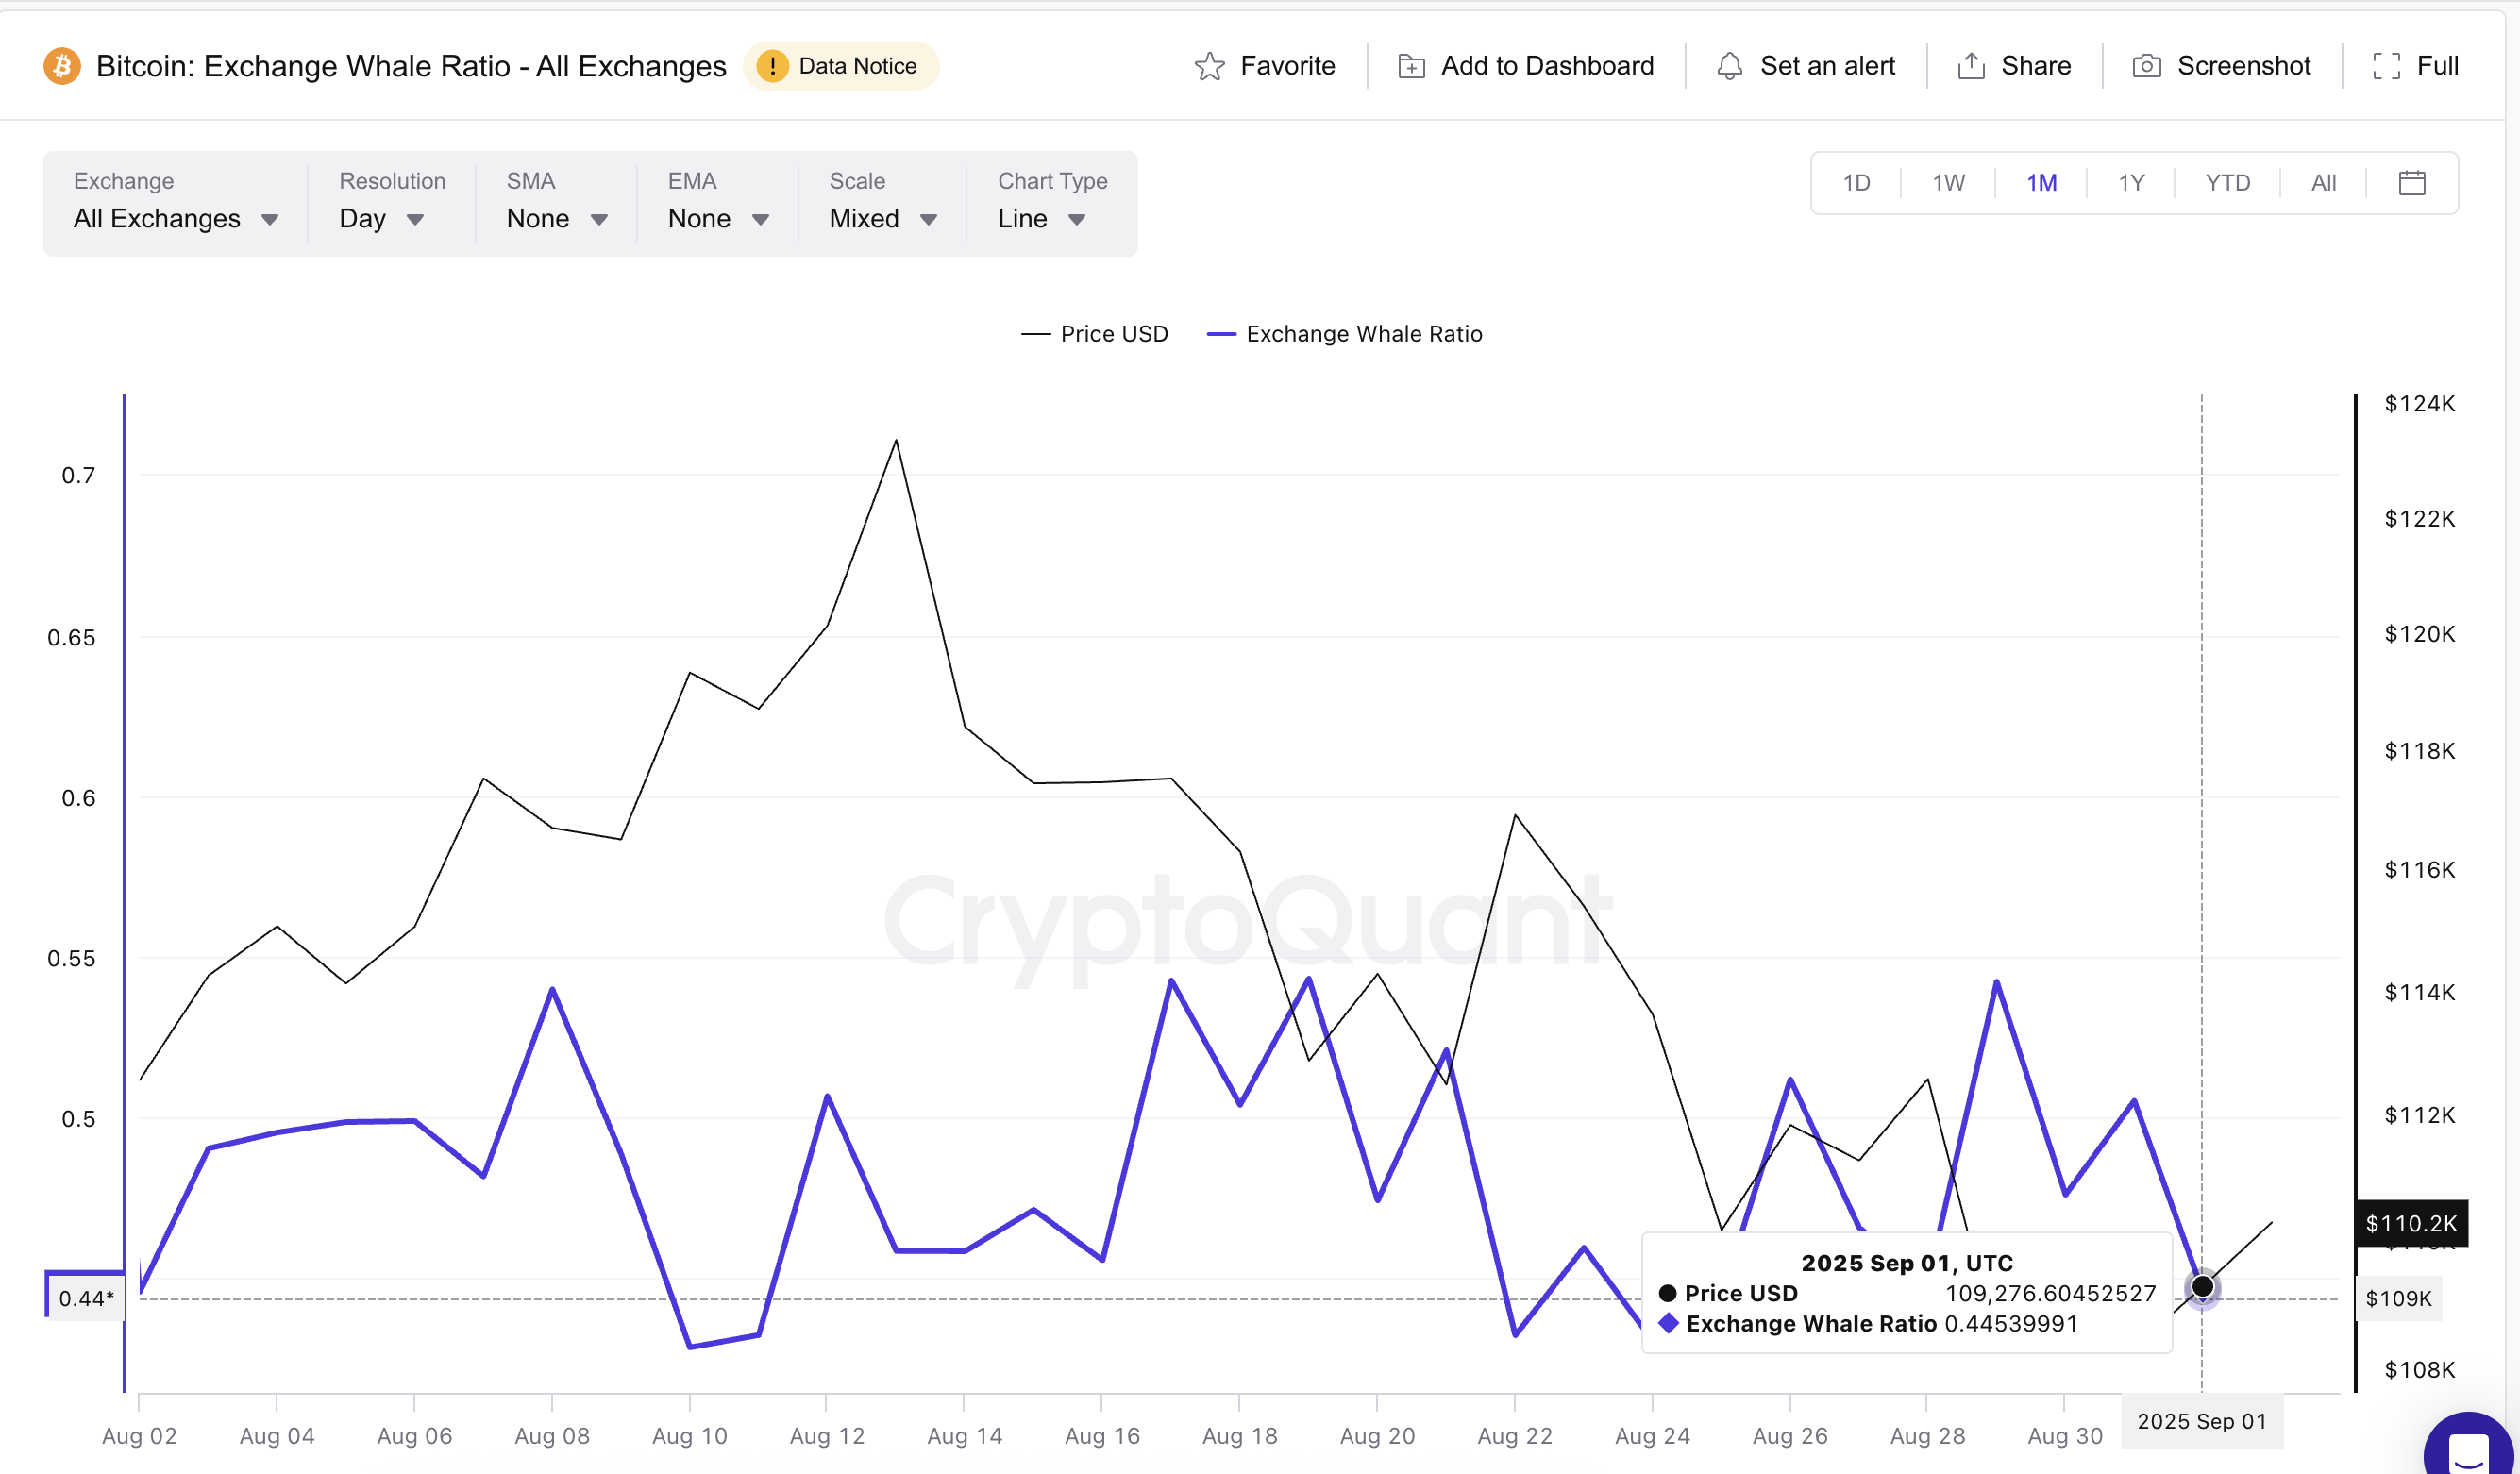
This ratio measures the extent to which whale-sized addresses control BTC inflows to exchanges. A falling ratio means large holders aren’t sending coins to exchanges to sell.
Prices have climbed from $108,332 to above $110,100 in that same period, confirming that whales have not been offloading into strength. With spot selling pressure muted, the market looks more resilient to short-term dips.
Bitcoin Price Flashes a Bullish Divergence
A third bullish signal comes from the daily chart. Between August 24 and September 2, BTC made a higher low, while the RSI (Relative Strength Index) — a momentum indicator that tracks the speed of price changes — printed a lower low. This pattern is known as a hidden bullish divergence, often hinting at continuation.
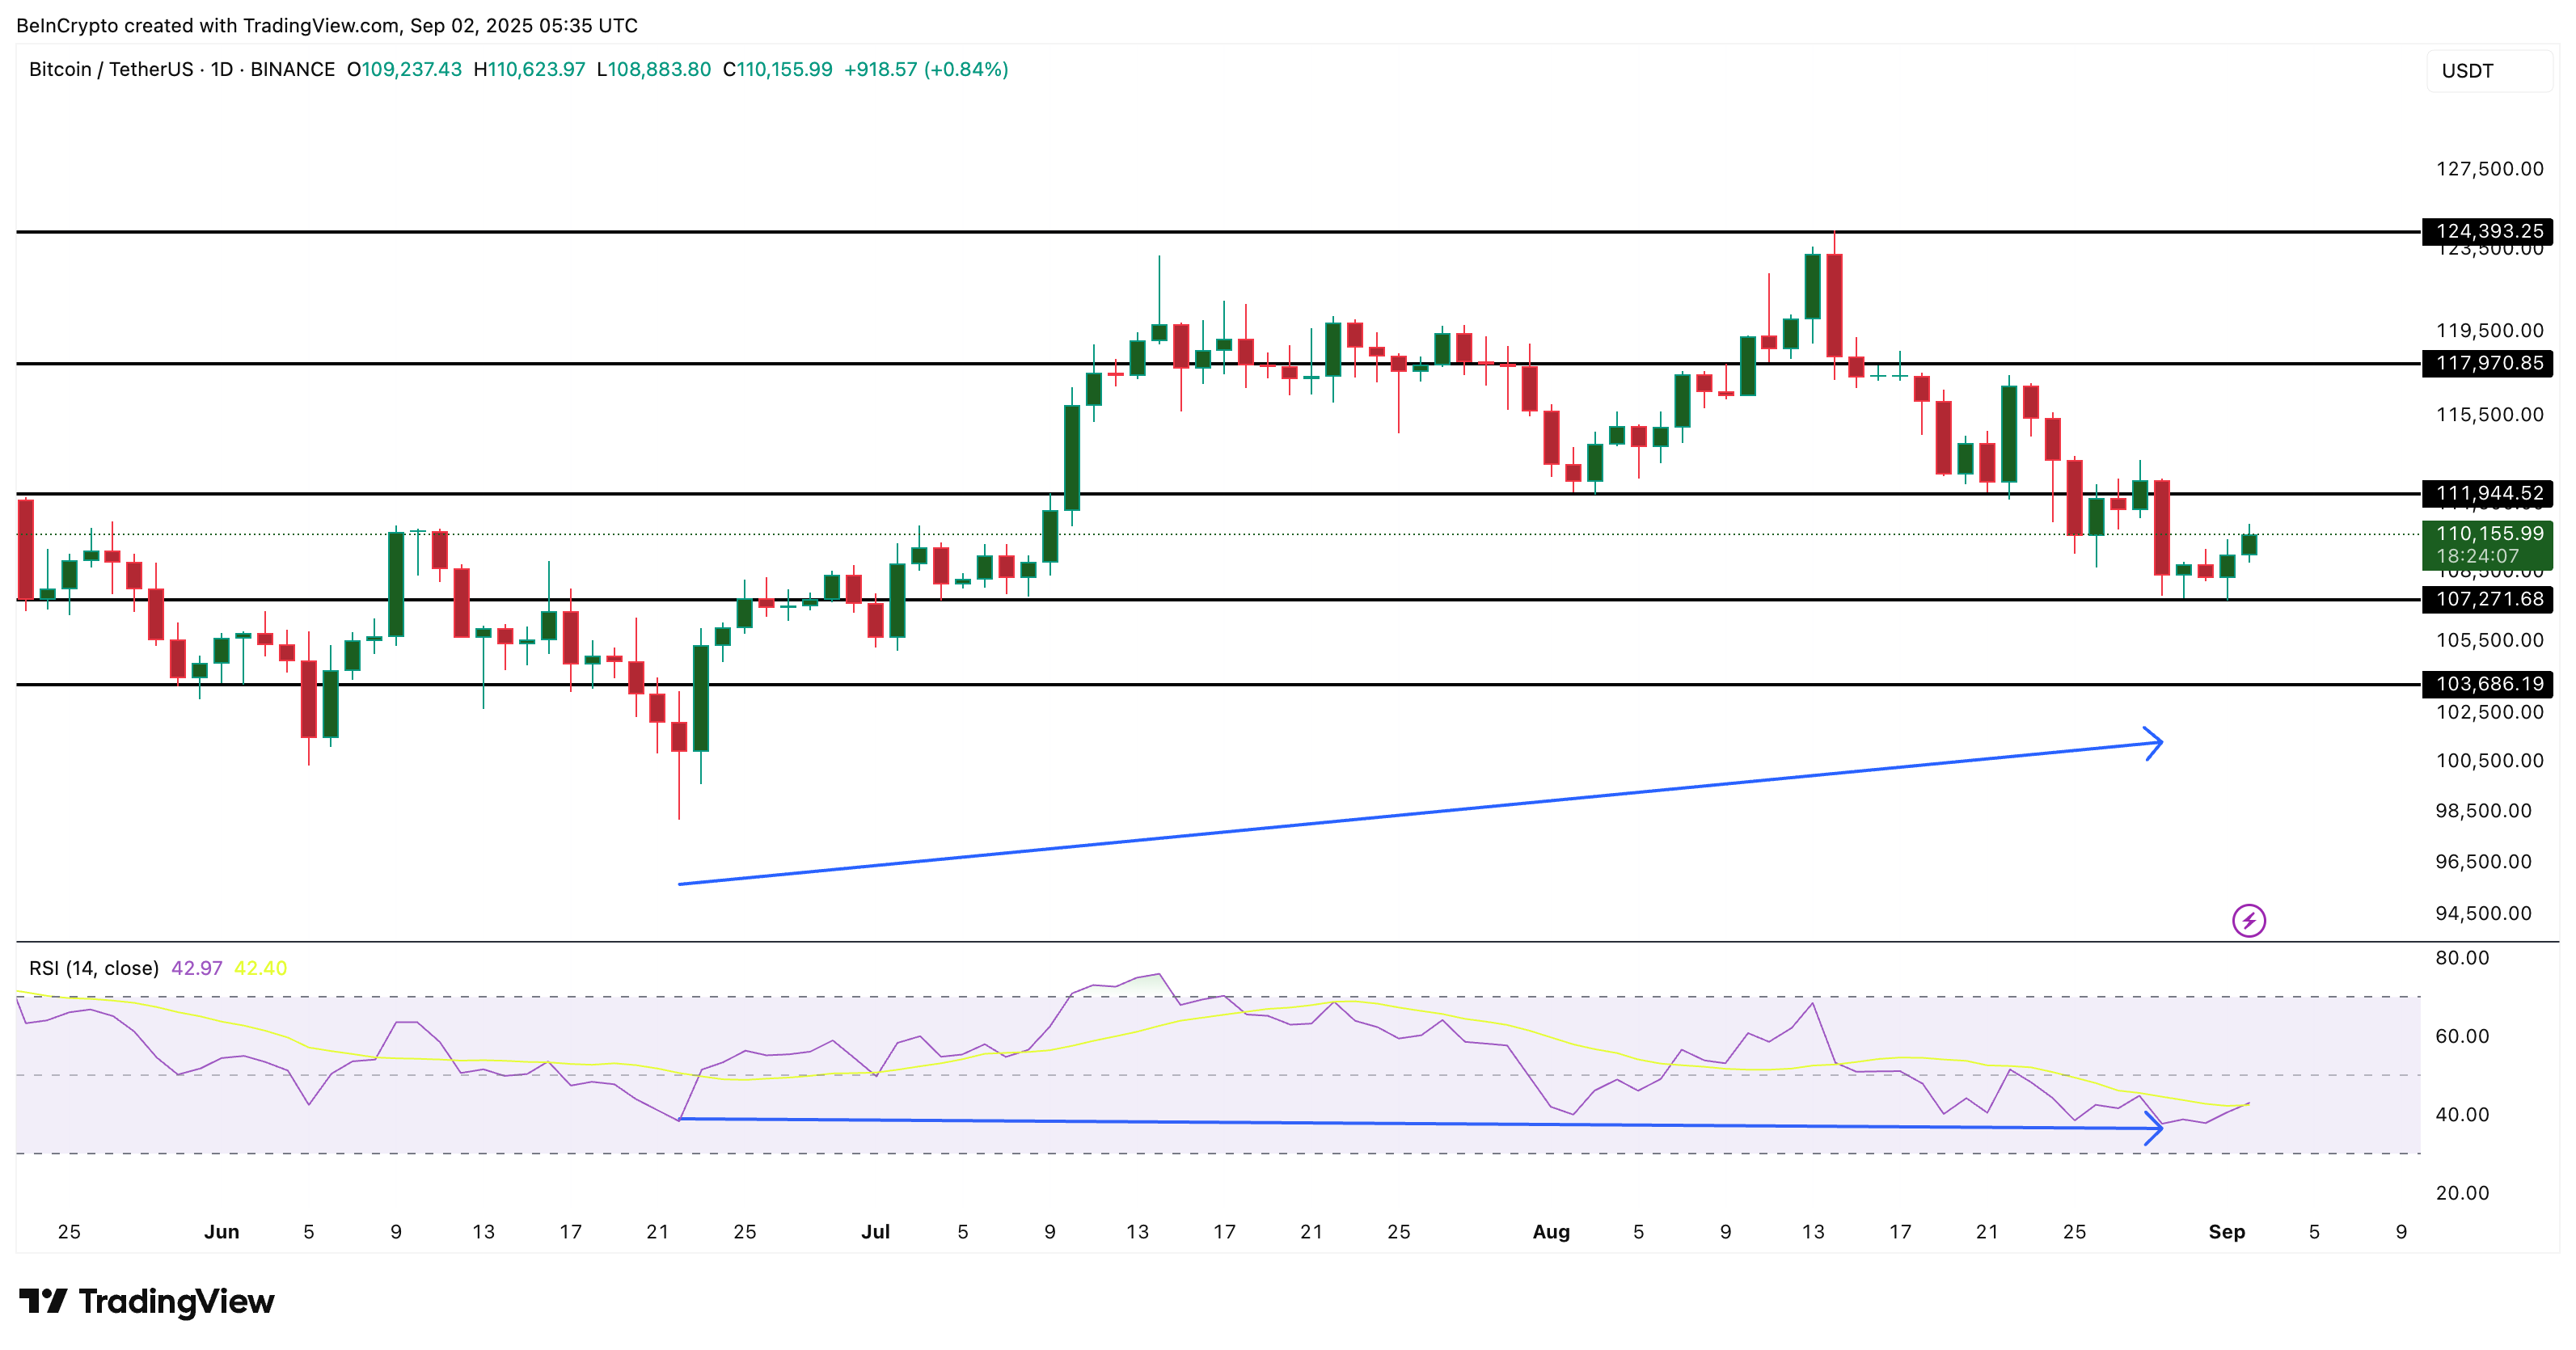
Paired with muted whale selling and derivative positioning, this divergence suggests Bitcoin’s current recovery has room to extend. If bulls can clear resistance just above the current range at $111,900 (aligns with the resistance of $111,768 from the cost basis heatmap), the next major target lies NEAR $117,900, a 7% from the current levels.
However, a daily candle close under $107,200 could invalidate the bullish outlook. And that would even make the bitcoin price susceptible to new lows.
