BUILDon Defies Market Downturn, Nears Historic Peak Amid Crypto Carnage

While red dominates crypto charts, BUILDon stages a stunning rally toward record territory.
The Unstoppable Ascent
BUILDon's token surges against brutal market headwinds—clawing its way toward all-time highs while competitors bleed out. No fancy algorithms, just relentless buying pressure from believers who actually read whitepapers.
Defying Gravity
As major coins tank 20-30%, this outlier gains traction where it matters: real adoption, not just speculative hype. Meanwhile, traditional finance still can't tell the difference between a blockchain and an Excel spreadsheet.
Building When Others Break
The project's resilience isn't magic—it's fundamentals meeting opportunity while weak hands panic-sell. Sometimes the best trade is holding what others fear to keep.
Traders Pile Into BUILDon
B/USD daily chart readings show the token’s Relative Strength Index (RSI) trending upward, reflecting sustained buying pressure among spot market participants. As of this writing, the momentum indicator stands at 65.34.
: Want more token insights like this? Sign up for Editor Harsh Notariya’s Daily crypto Newsletter here.
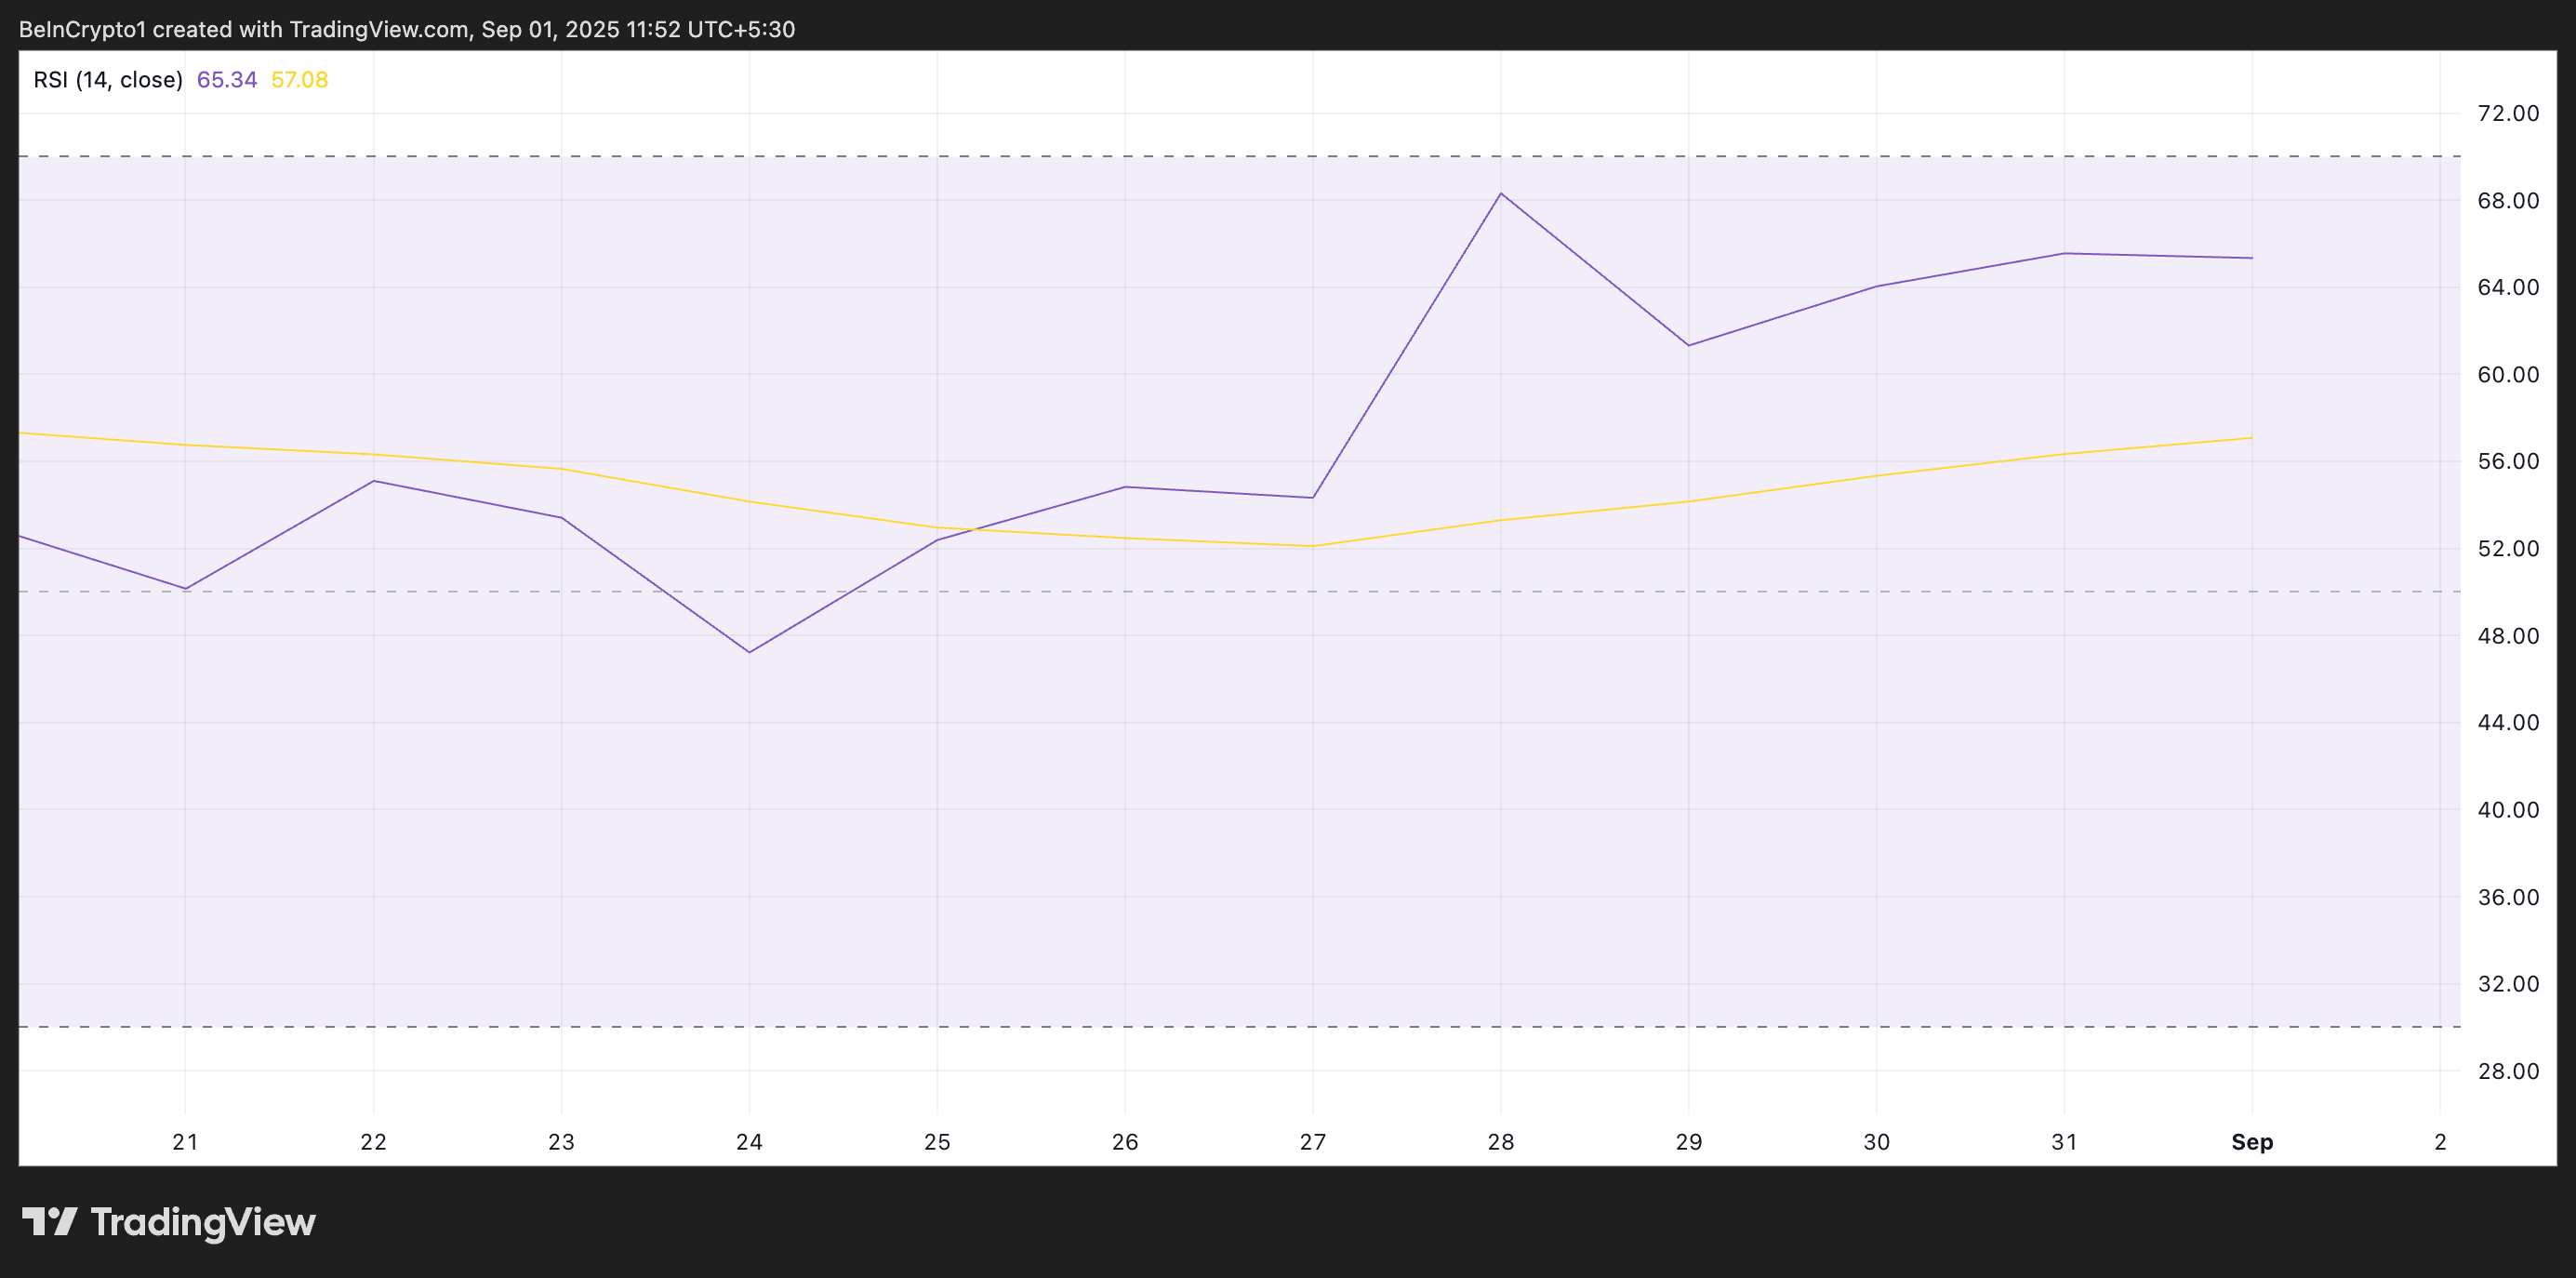
The RSI indicator measures an asset’s overbought and oversold market conditions. It ranges between 0 and 100. Values above 70 suggest that the asset is overbought and due for a price decline, while values under 30 indicate that the asset is oversold and may witness a rebound.
B’s RSI reading of 65.34 indicates room for further upside before the token becomes overbought and witnesses a decline. The steady climb in the RSI value reflects consistent buying pressure from traders, suggesting B investors remain confident in the token’s short-term trajectory.
Moreover, the setup of B’s Moving Average Convergence Divergence (MACD) indicator confirms the growing bullish momentum. At press time, B’s MACD line (blue) rests above the signal line (orange), with the green histogram bars growing in size — a sign that bullish activity is increasing.
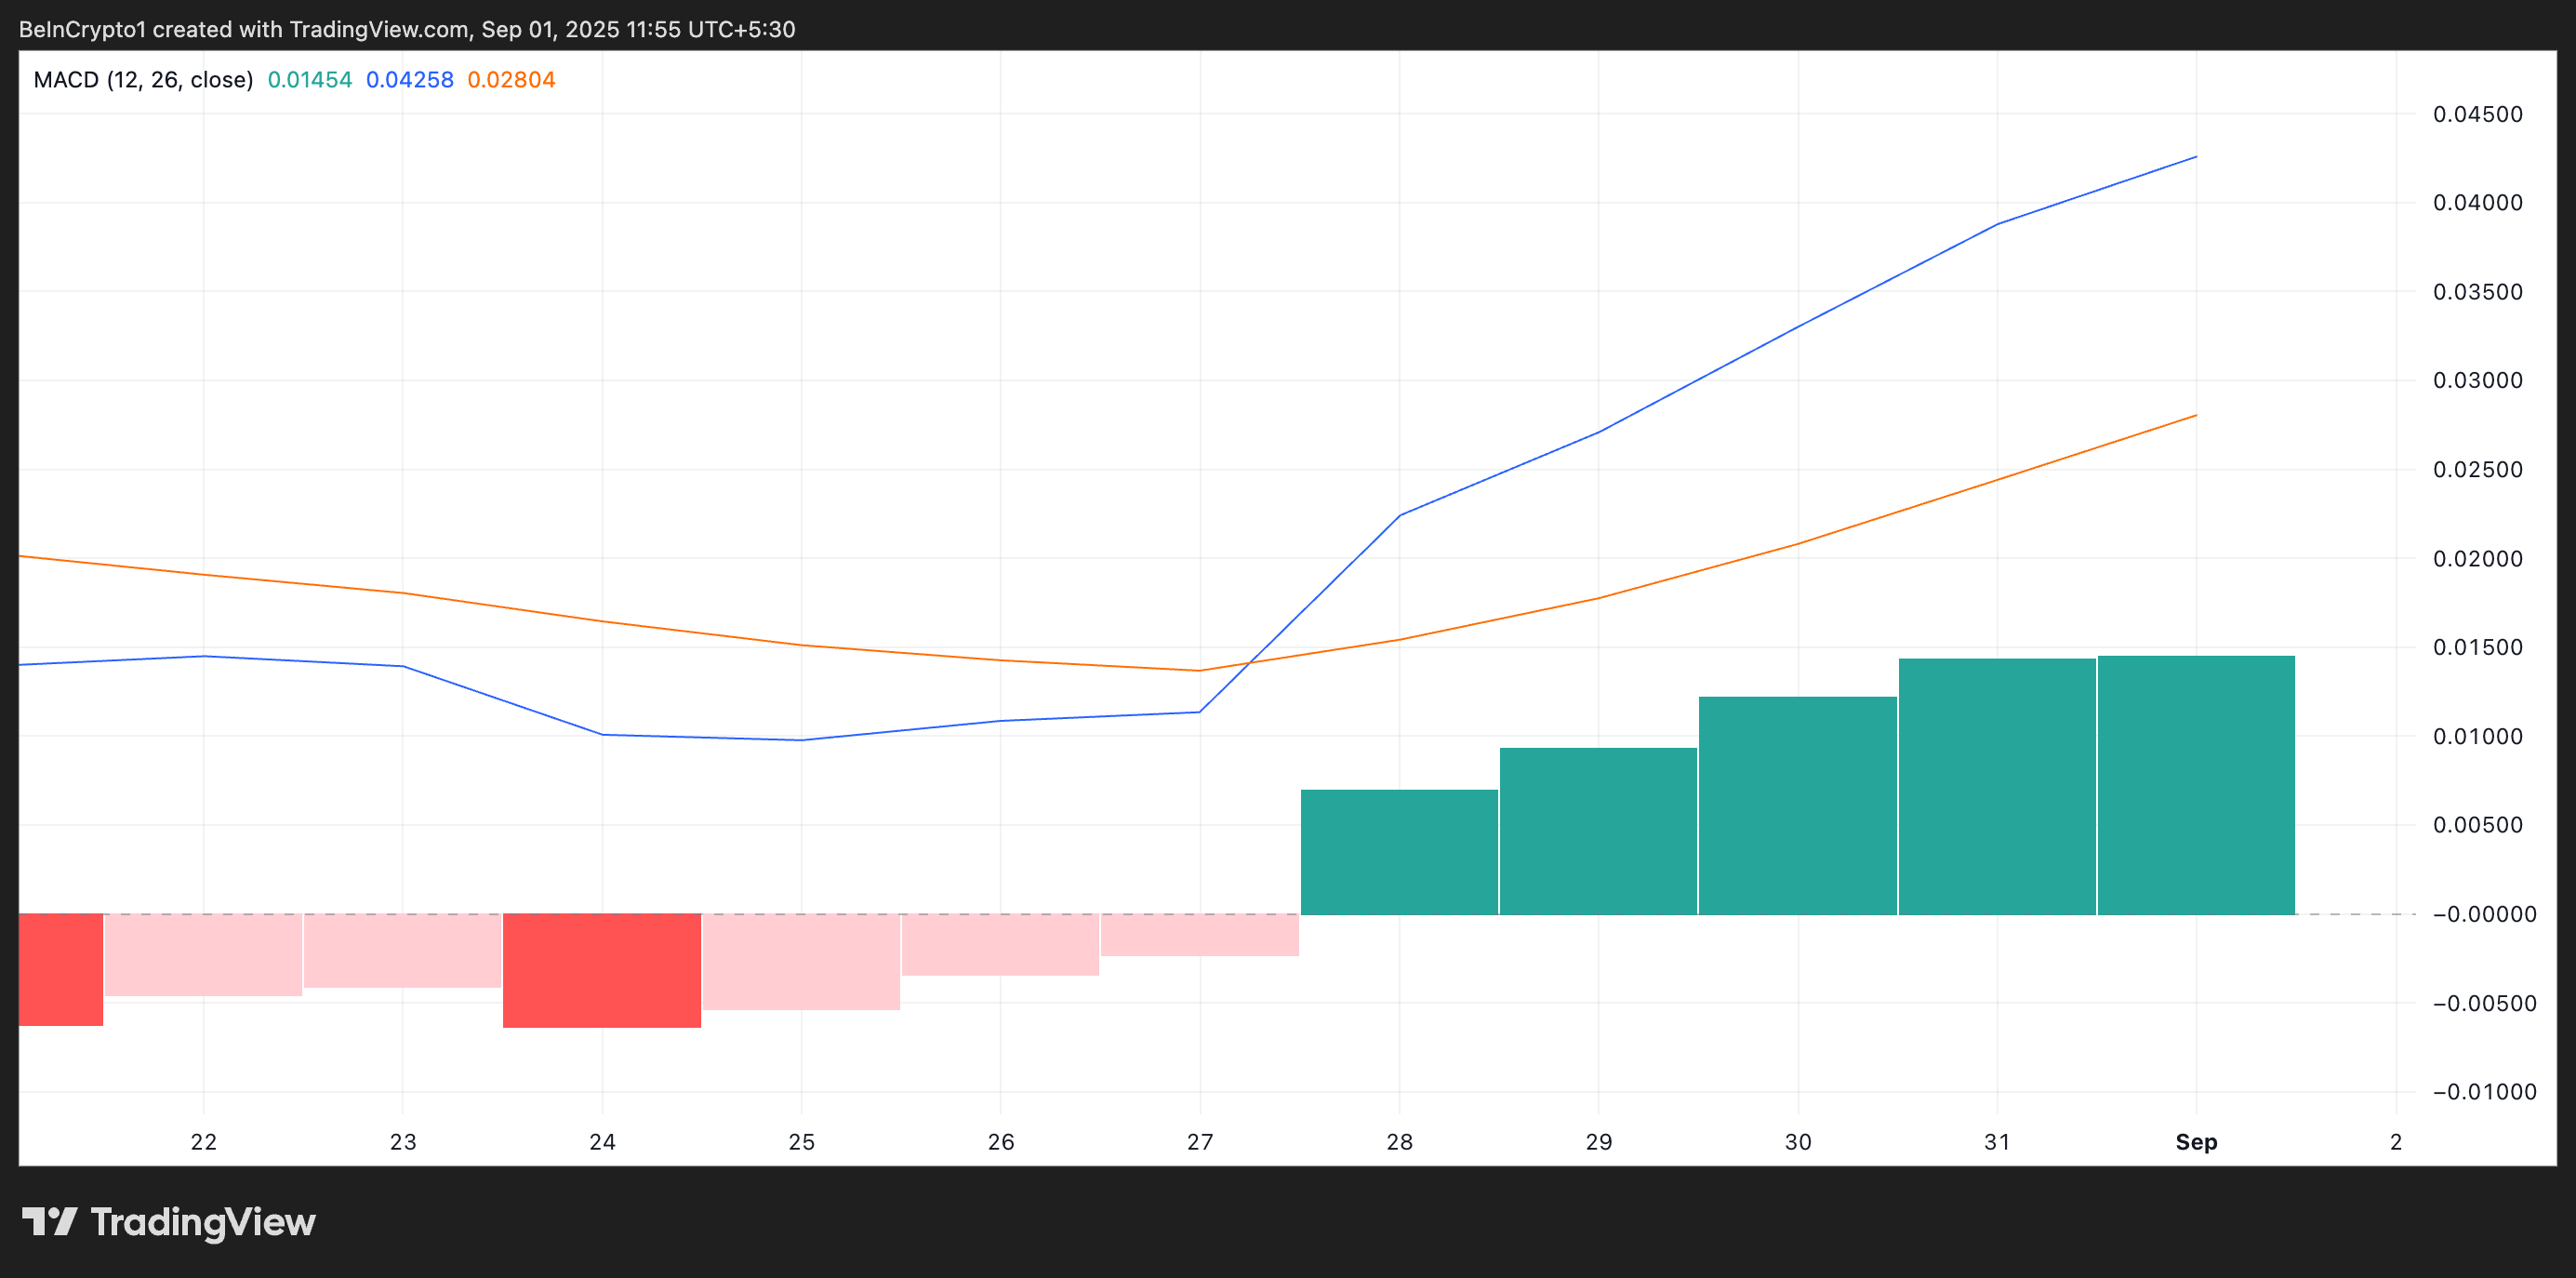
The MACD indicator identifies trends and momentum in its price movement. It helps traders spot potential buy or sell signals through crossovers between the MACD and signal lines.
As with B, when the MACD line rests above the signal line, it signals declining selling pressure and growing buy-side strength.
Profit-Takers Circle as BUILDon Approaches All-Time High
An uptick in BUILDon’s demand could drive the token toward its all-time high of $0.74, with the possibility of breaking past it if momentum strengthens.
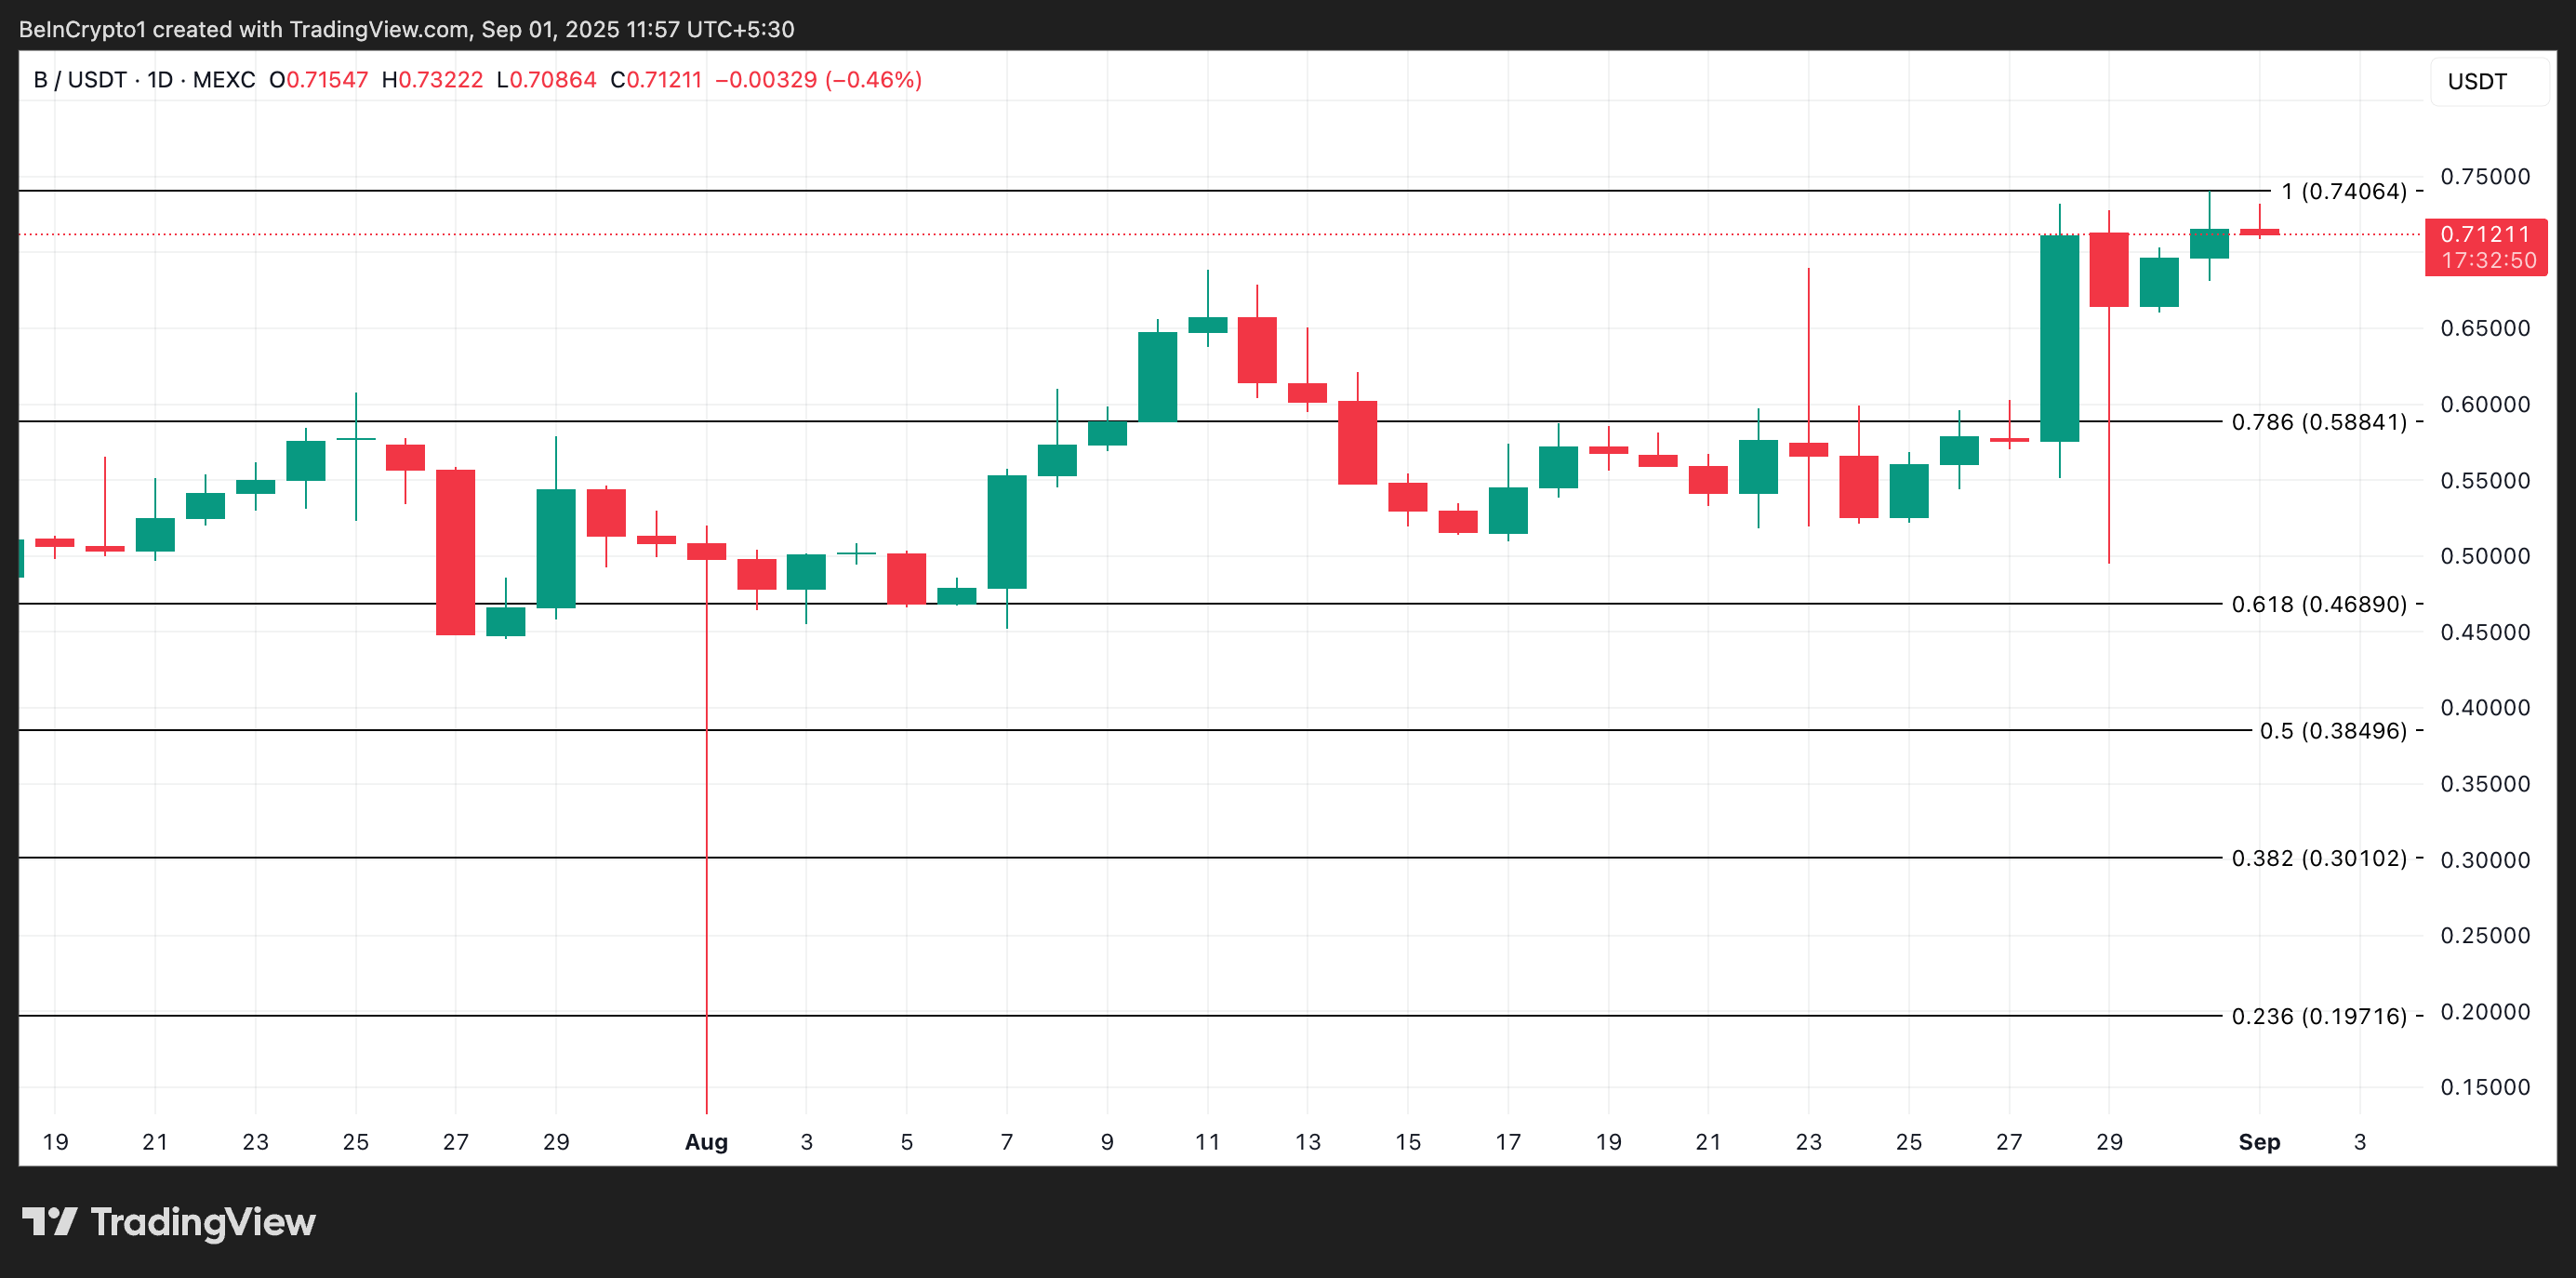
However, a rejection at this resistance level may trigger short-term profit-taking, potentially pulling the price back down toward $0.58.
