Chainlink (LINK) Price Uptrend Nearing Exhaustion? Critical Reversal Signals Emerge

Chainlink's relentless rally shows cracks as technical indicators flash warning signs—just as traders max out their leverage positions.
Technical Breakdown: The Charts Don't Lie
LINK's parabolic move hits resistance at key levels that historically trigger pullbacks. Momentum oscillators diverge negatively while trading volume declines—classic exhaustion patterns that make technical analysts nervous.
Market Psychology Shift: From Greed to Caution
Retail FOMO meets institutional profit-taking as smart money quietly exits positions. The 'everyone's a genius in a bull market' mentality gets tested when charts actually start mattering again.
Broader Crypto Context: Not Operating in Isolation
Bitcoin dominance fights back while altcoin season shows age—LINK doesn't moon in vacuum. Correlation patterns reassert themselves when liquidity gets tight across crypto markets.
What's Next: Healthy Correction or Trend Reversal?
Traders watch key support levels like hawks. Break below certain moving averages could trigger cascade of stop-loss orders—because nothing fuels a sell-off like automated trading systems panicking simultaneously.
Remember: In crypto, charts predict the future until they don't—usually right after you've placed your trade based on them.
Profit-Taking Pressures Mount As Holders Sit in Gains
One of the clearest signs comes from the percentage of LINK supply in profit, which is still hovering at historically high levels.
As of August 29, nearly 87.4% of the circulating supply is in profit, close to the recent peak of 97.5% seen on August 20. That peak coincided with the LINK price rally to $26.45, which quickly retraced by over 6% to $24.82 the following day.
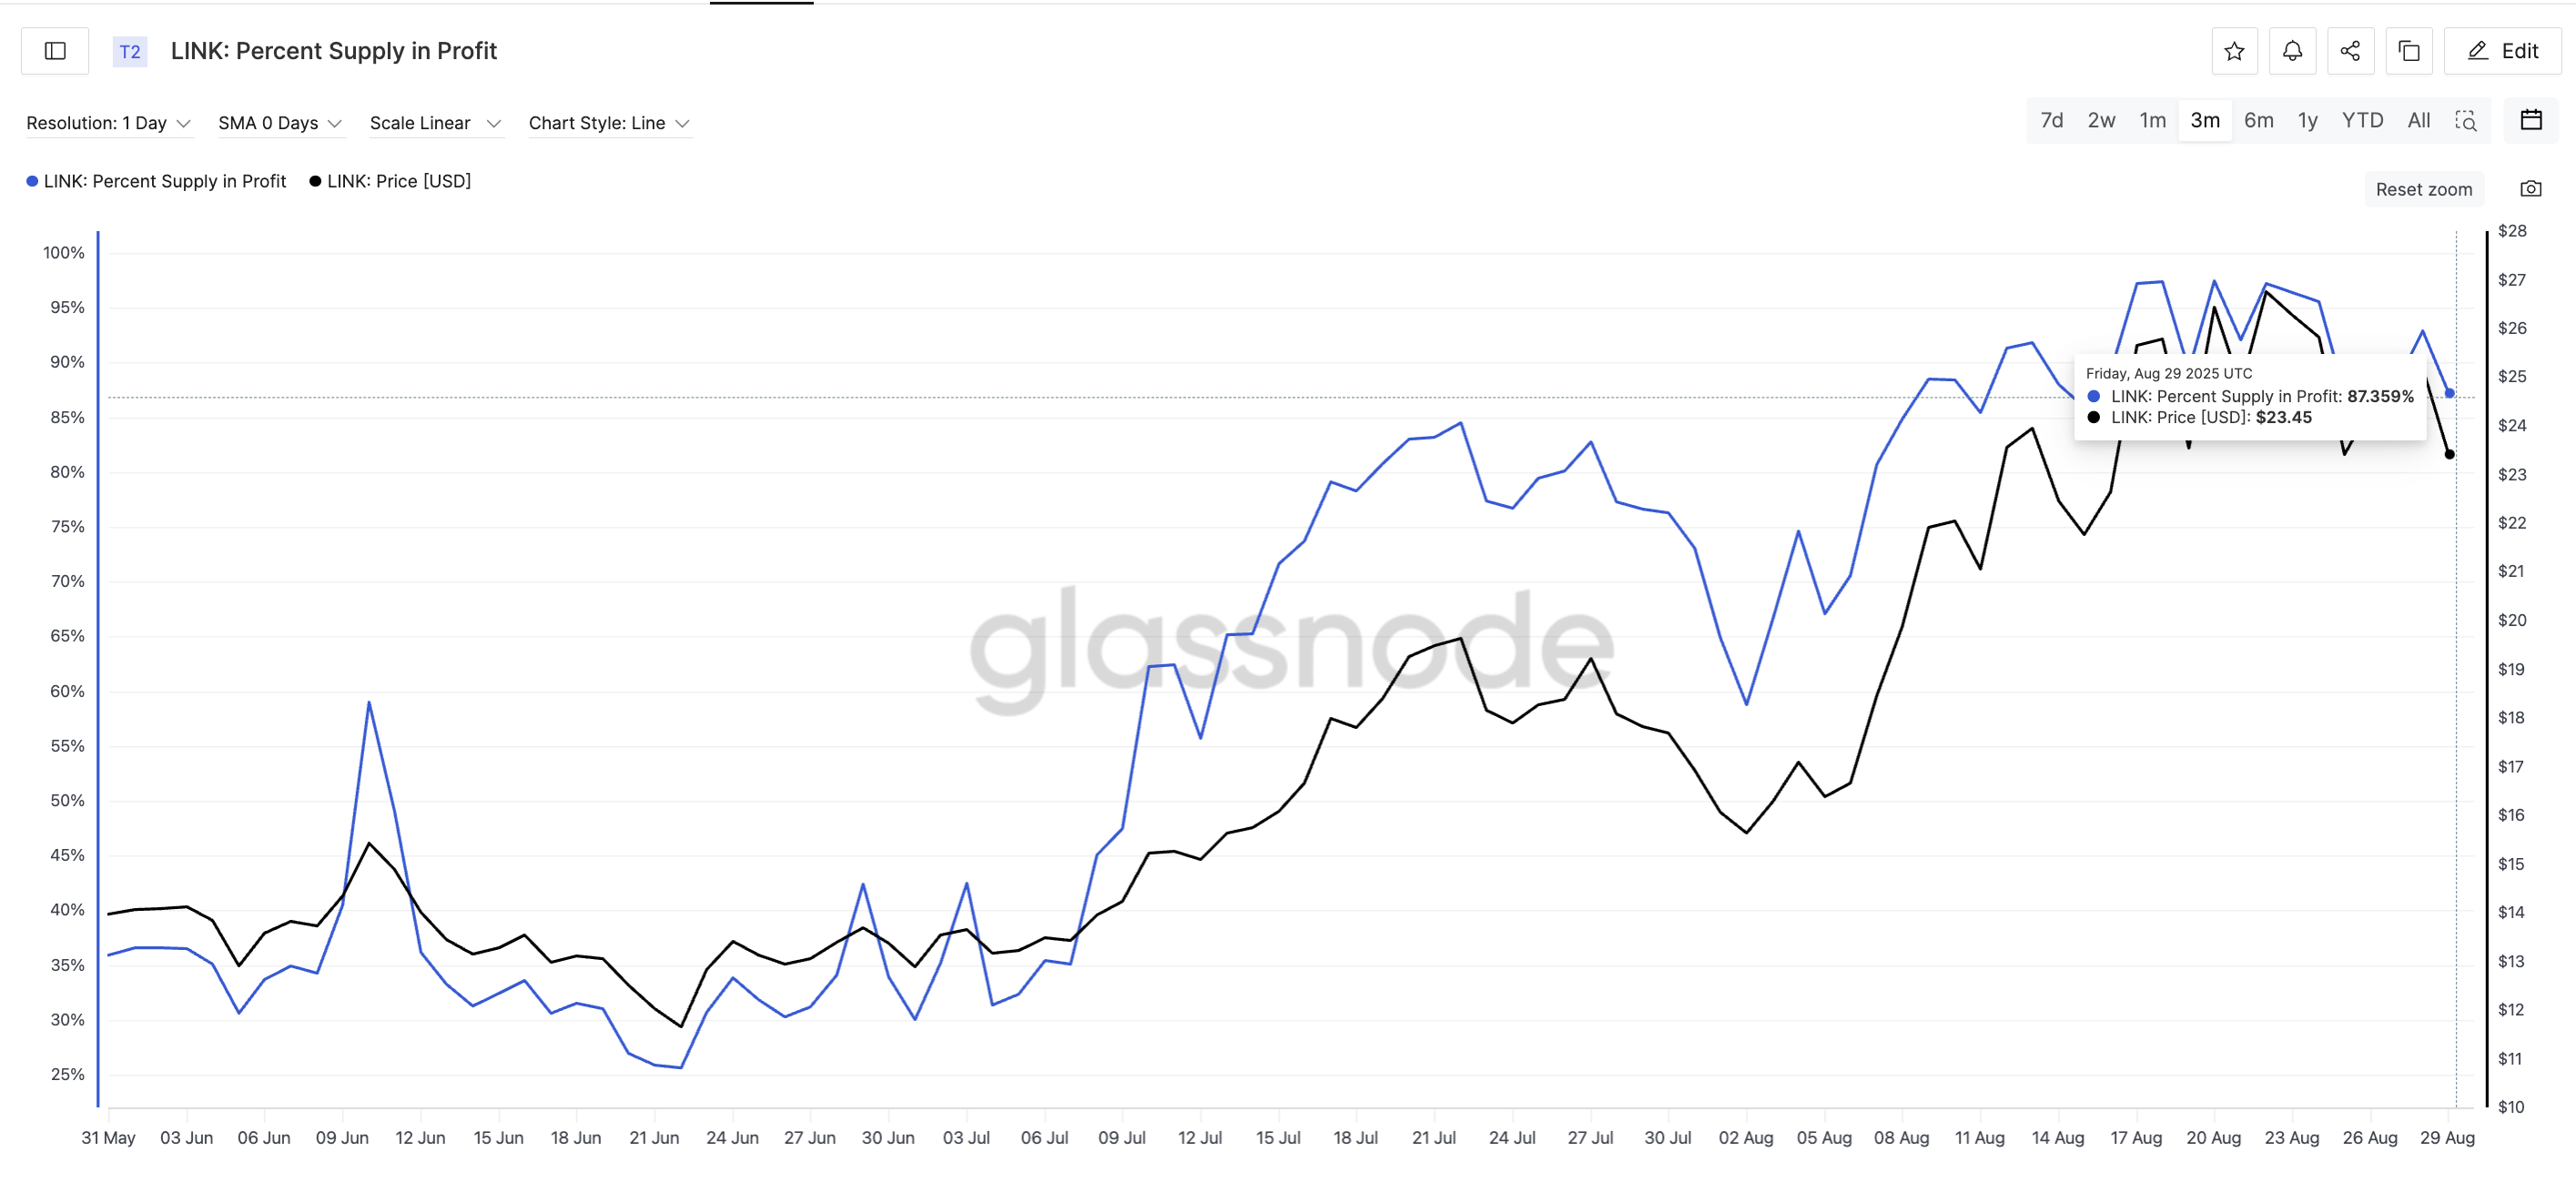
A look further back shows the same pattern. On July 27, the supply in profit stood at 82.8%, just before LINK corrected from $19.23 to $15.65, making a 19% dip. The current reading NEAR 87% is again uncomfortably high, hinting at elevated risks of profit-taking.
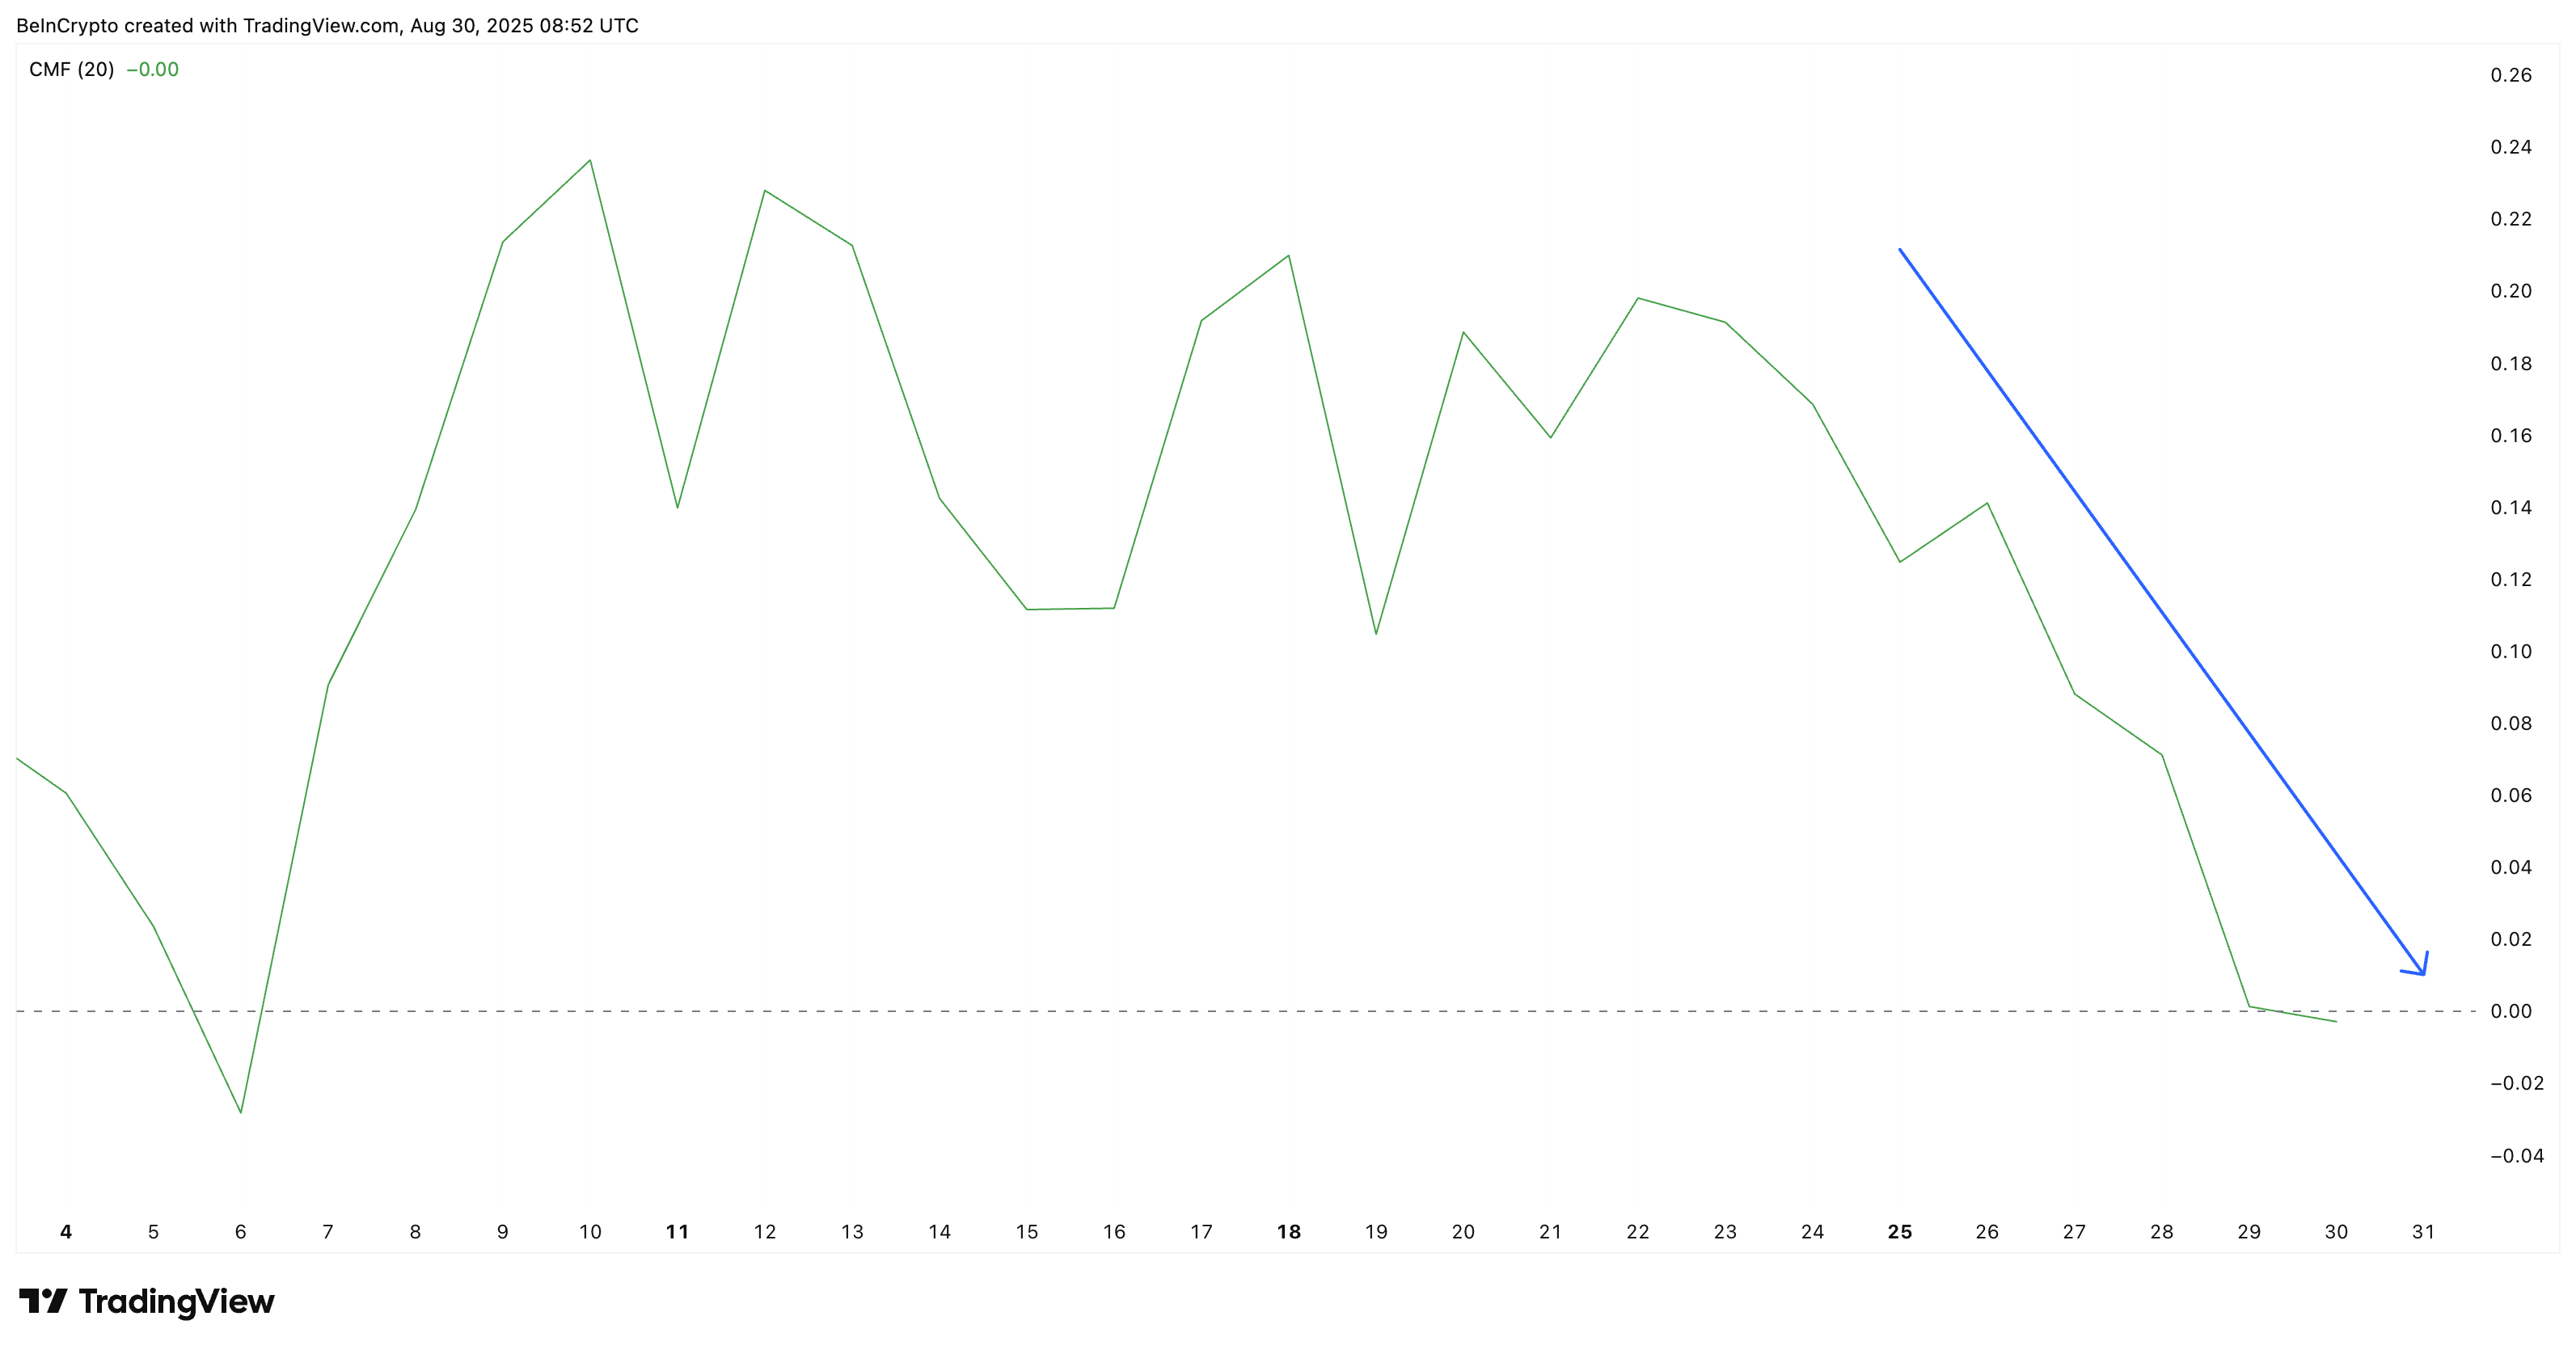
Additionally, the Chaikin Money FLOW (CMF), which tracks capital inflows and outflows, has trended downward since August 22 and finally slipped below zero on August 29 for the first time since August 6. This shift into negative territory signals fading buying pressure and capital inflows, strengthening the case for a potential pullback.
.
Chainlink (LINK) Price Action Points To Bearish Exhaustion
The daily chart reinforces this caution. The LINK price is currently trading at $23.31, sitting inside an ascending broadening wedge pattern — a structure often associated with loss of upward momentum near the end of a bullish phase. This “megaphone” like pattern is infamous to kickstarting bearish reversals, a risk that now looms over LINK.
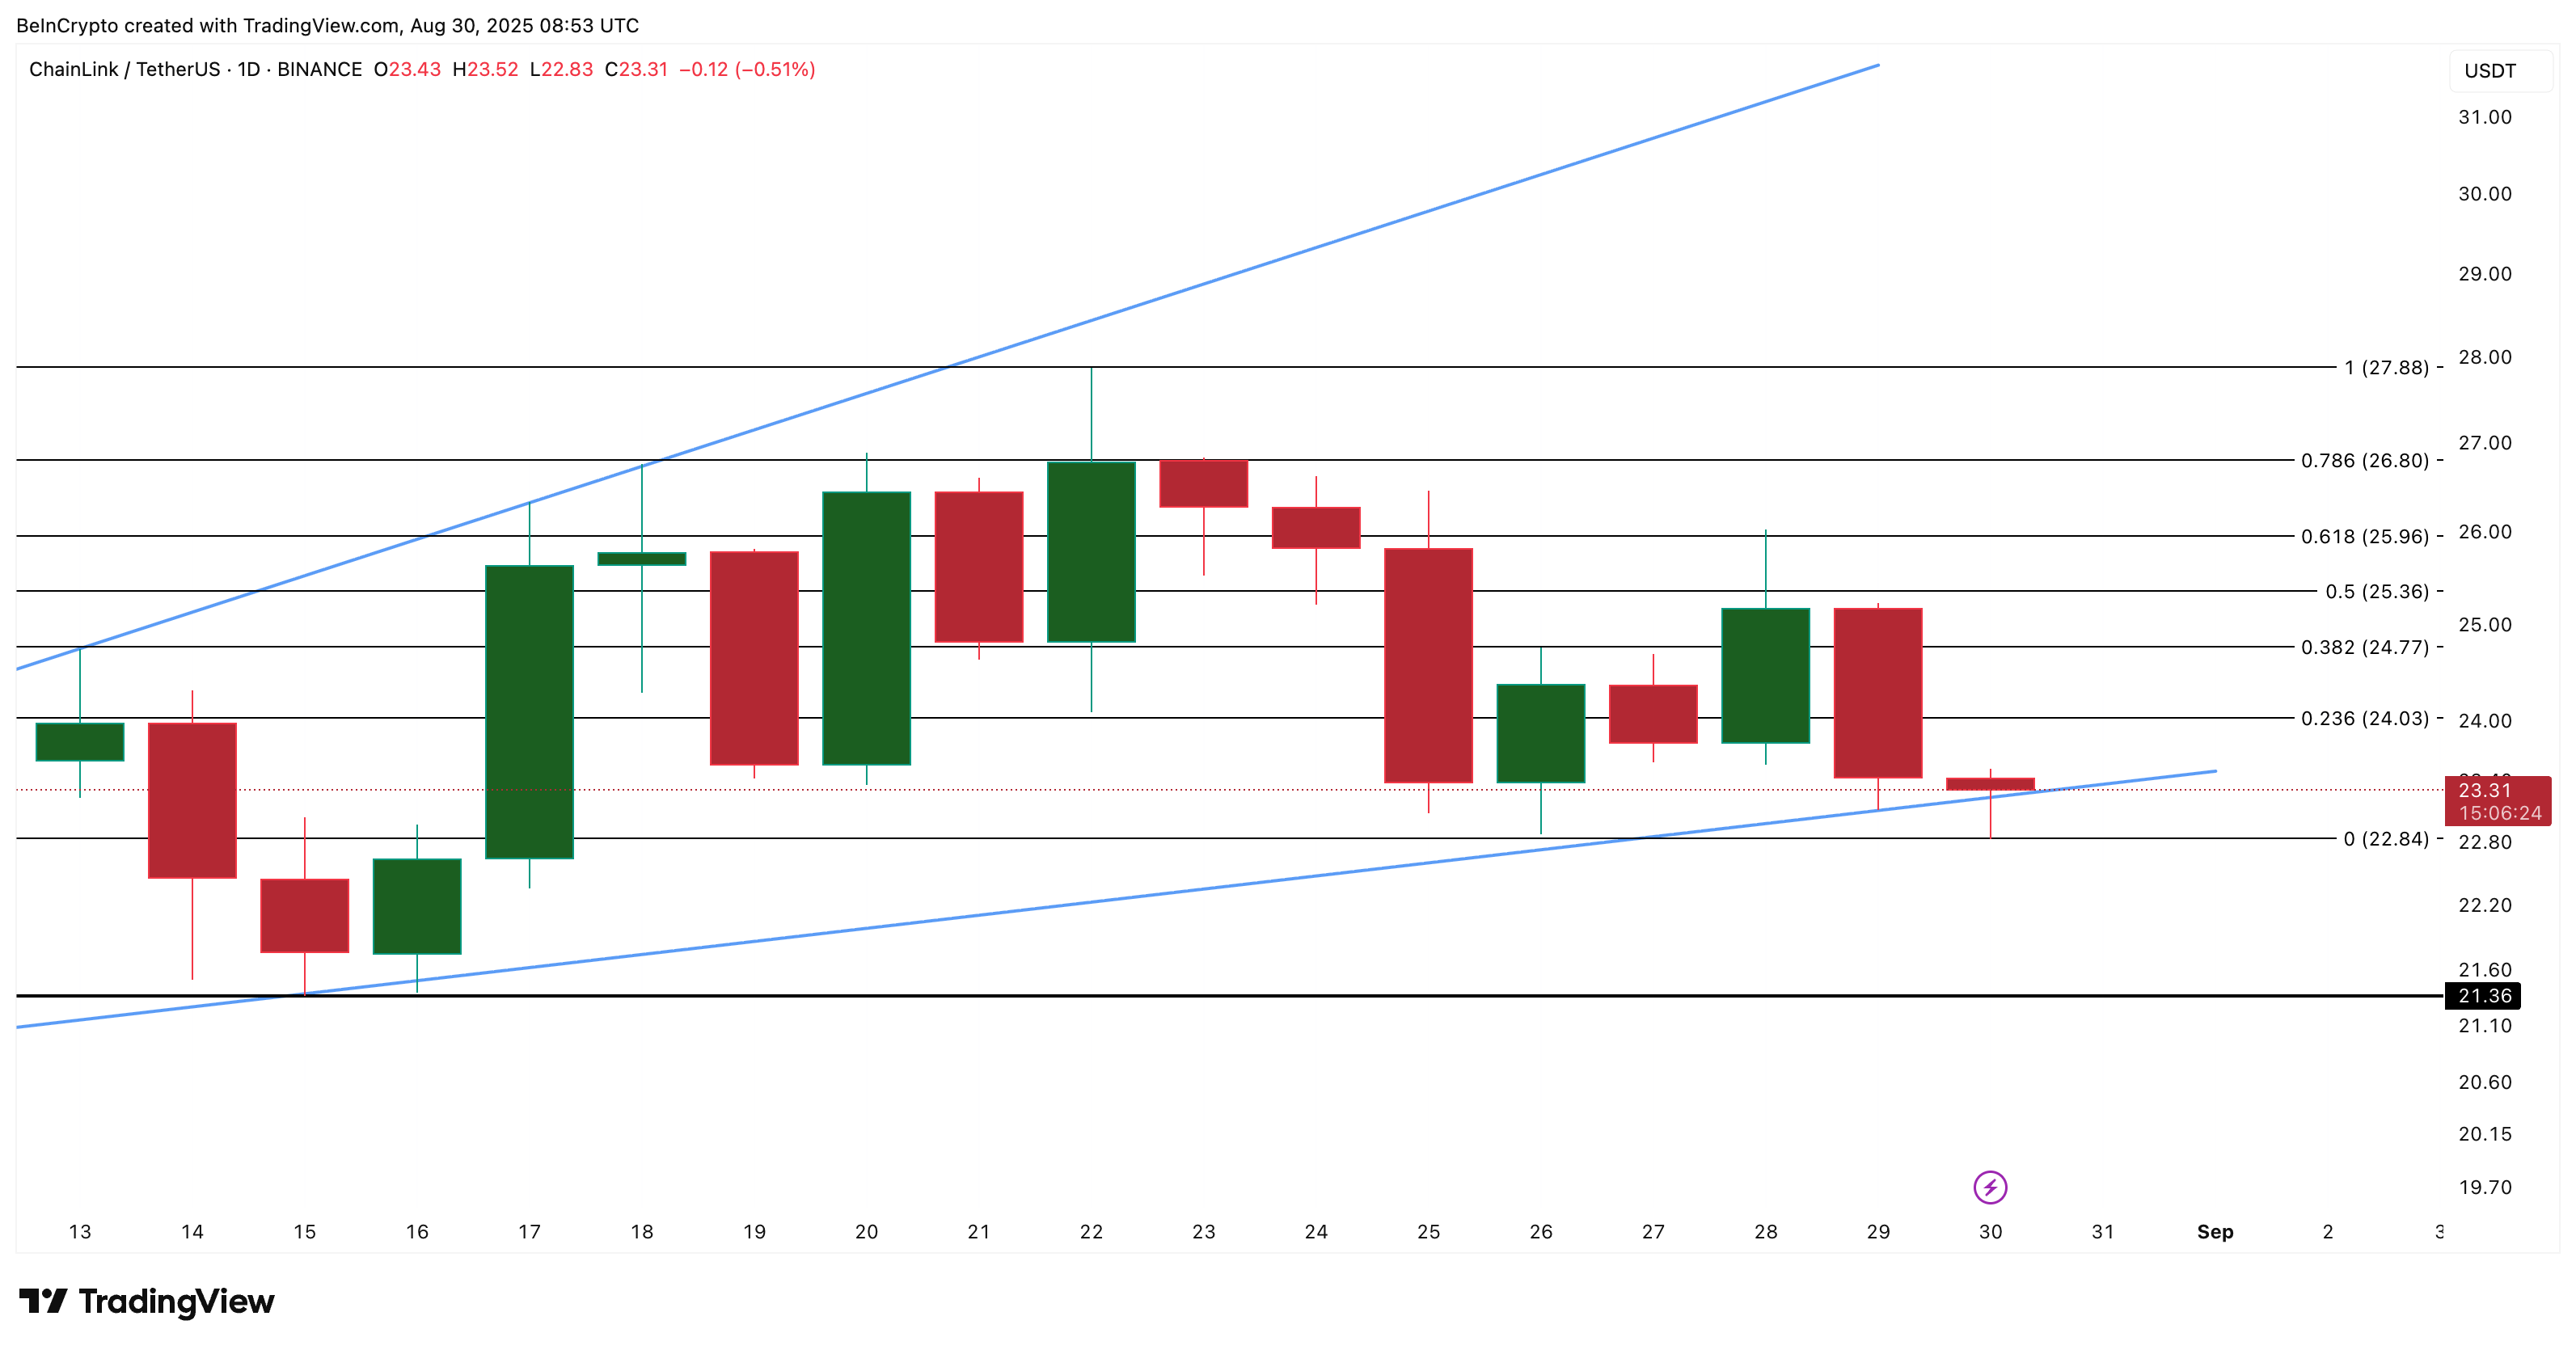
The key support to watch is $22.84. A decisive break below this level WOULD expose the next downside target at $21.36, and falling beneath that could risk a deeper retracement. That could be anywhere in the 6% to 19% percent range, as experienced during the local “Supply In Profit” peaks.
On the other hand, if the LINK price manages to reclaim $25.96, it may still attempt another MOVE higher.
But even such a recovery would not fully overturn the broader exhaustion signs unless the token can break convincingly above $27.88.
