Whale Indicators Flash Major Bitcoin Price Shift Ahead

Bitcoin's big money players just signaled their next move—and it's not what retail expected.
Whale wallets are executing massive transfers as institutional accumulation patterns hit historic levels. These aren't your average crypto bro moves; we're talking nine-figure transactions hitting obscure OTC desks.
The metrics don't lie: whale activity correlates with 80% of major BTC breakouts over the past two years. When these deep-pocketed traders shift position, markets listen.
Current on-chain data shows accumulation patterns mirroring early 2024 behavior—right before that 60% pump nobody saw coming. Exchange outflows spiked 300% in 48 hours while derivatives open interest flipped bullish for the first time since March.
Some hedge fund analysts are already repositioning portfolios, though traditional finance outlets will probably wait until CNBC runs its 'Bitcoin is back' segment at ATH prices—classic Wall Street timing.
Brace for volatility. When whales move, they don't send memos—they send markets.
Whale Selling Pressure Is Weakening
For weeks, the Bitcoin price lagged behind as whales rotated capital into other assets, leaving retail buyers to drive much of the move.
That made it critical to track whether whales were finally slowing their selling. The Exchange Whale Ratio, which measures the share of the top 10 inflows compared to all inflows to exchanges, provides that signal.
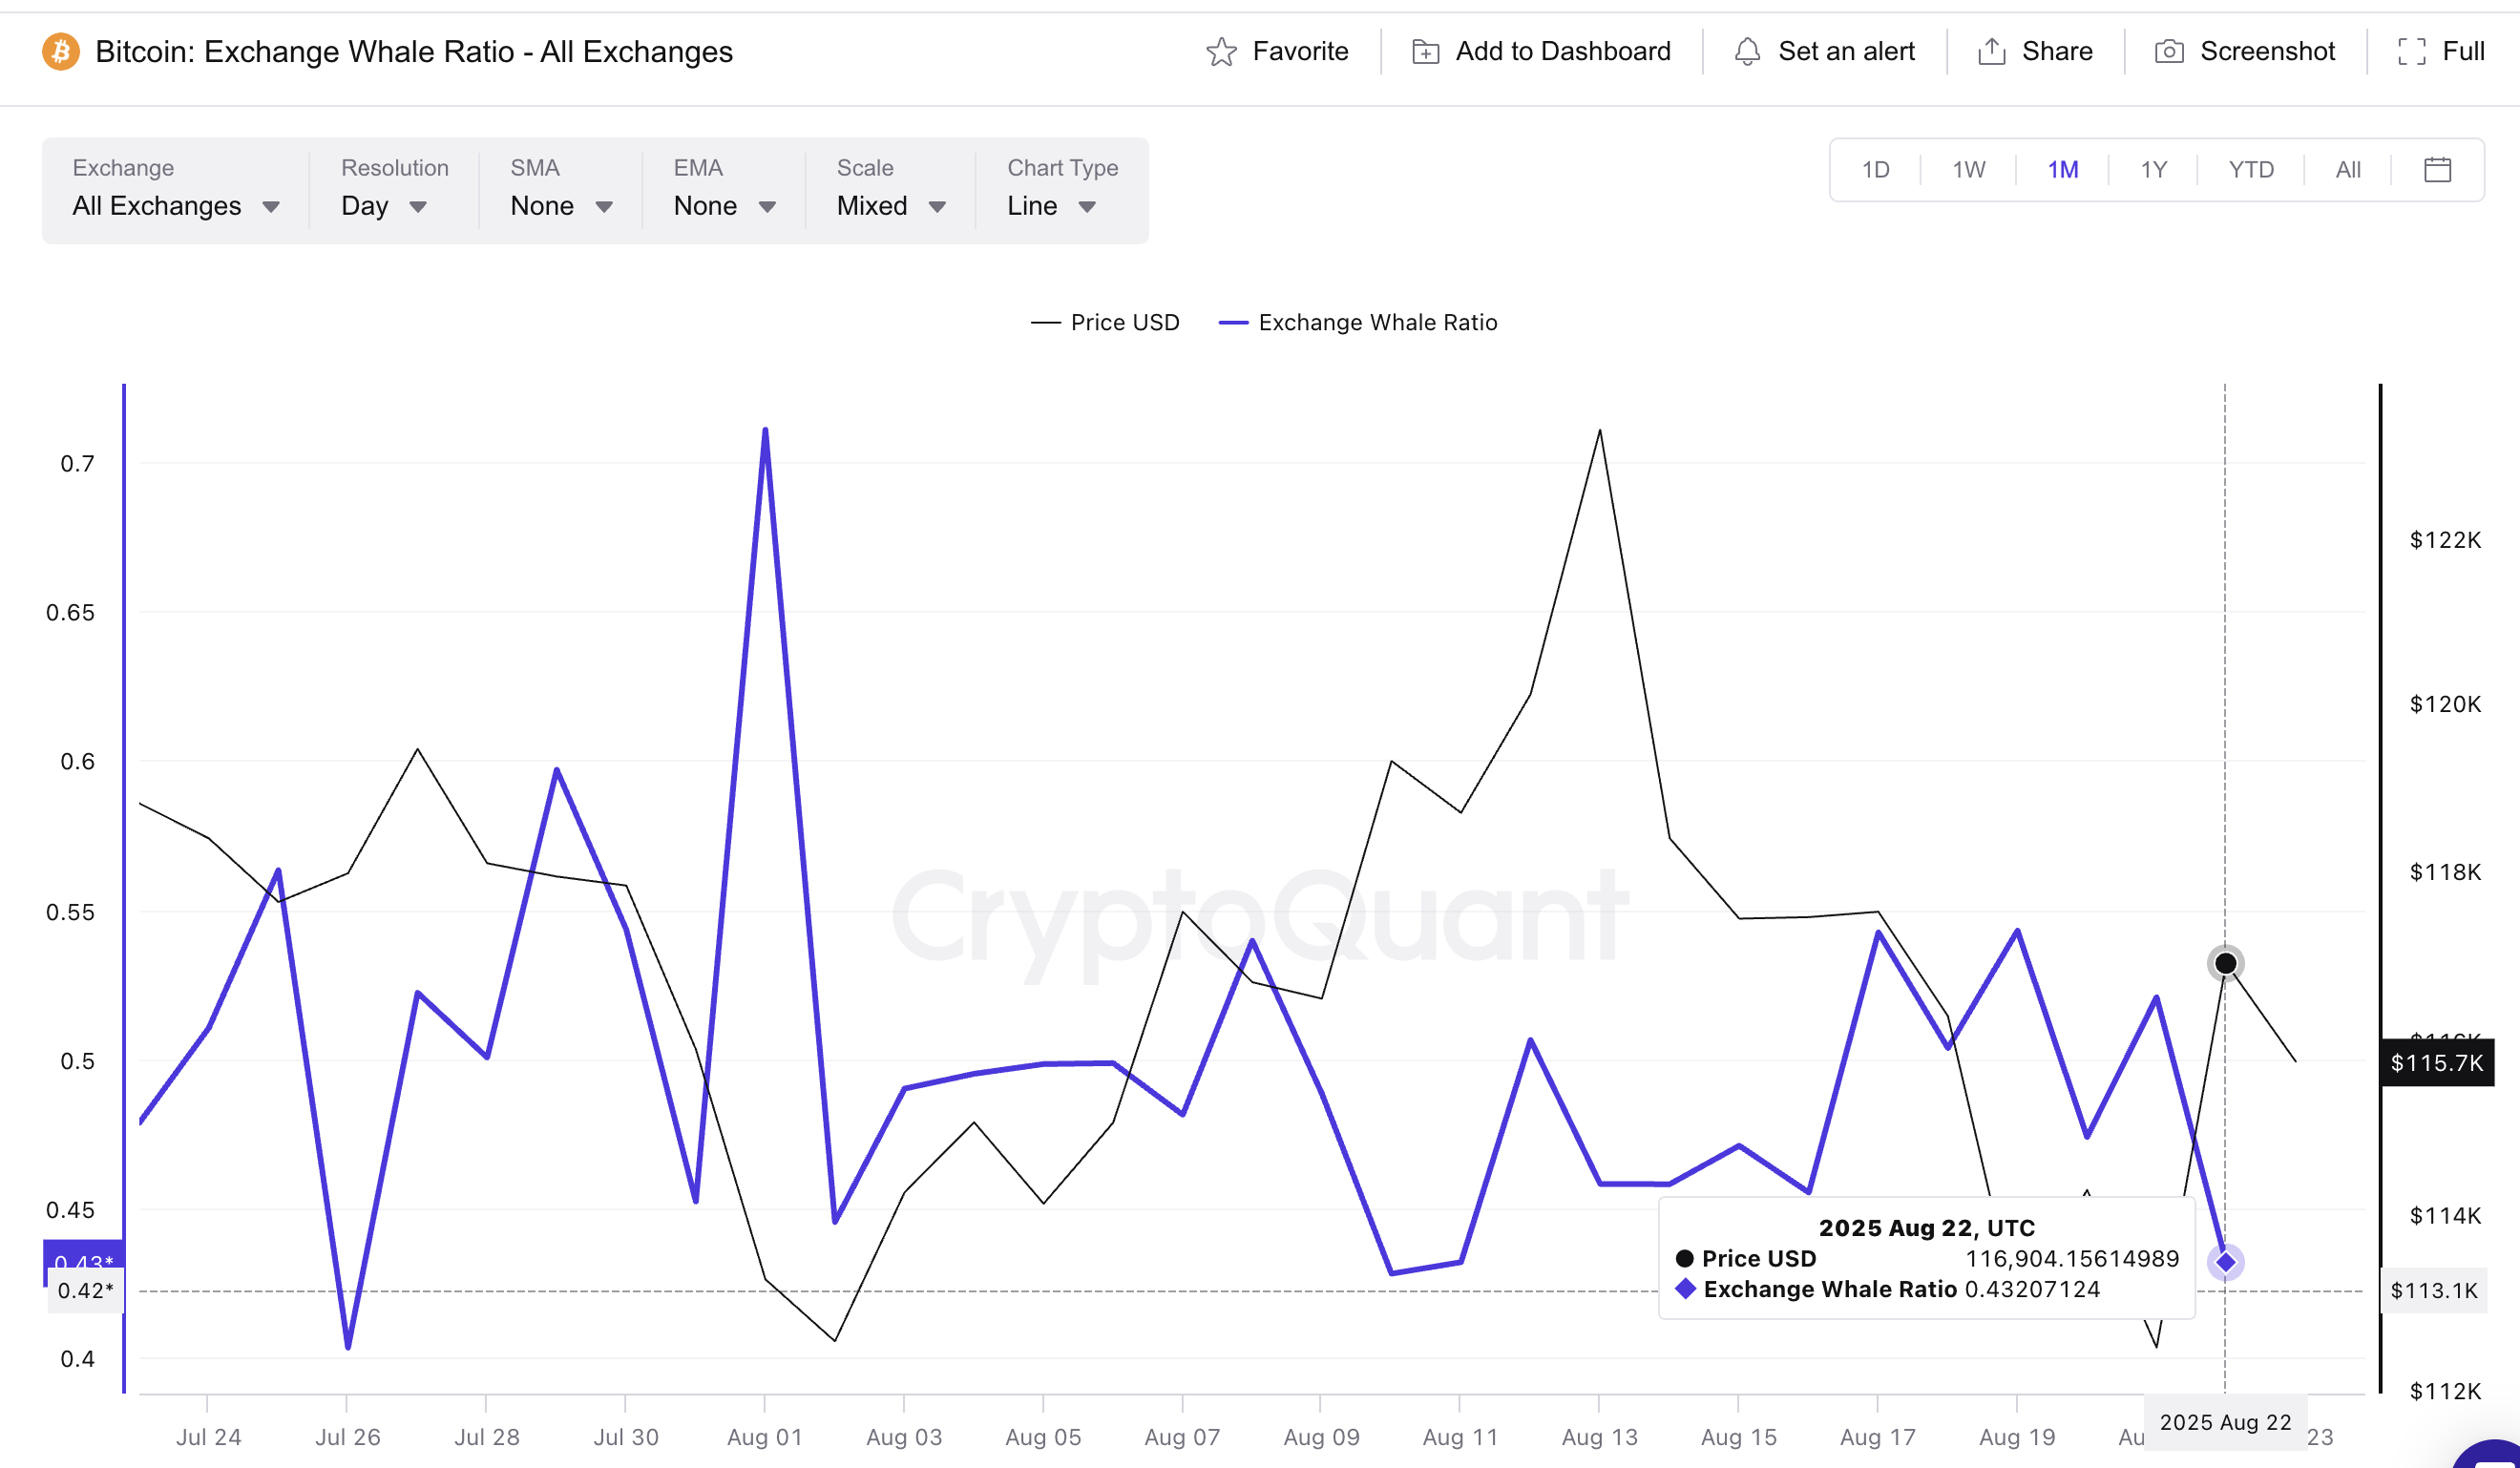
This ratio has fallen from 0.54 on August 19 to 0.43 on August 22, its lowest in nearly two weeks. A similar drop occurred on August 10, when the ratio fell to 0.42. That move preceded a sharp rally in Bitcoin from $119,305 to $124,000 — a gain of roughly 3.9%.
If history repeats, the current setup could open the door for a similar upside extension, arguably towards a new all-time high.
HODL Waves Point to Accumulation
With BTC selling pressure easing, the next question is whether mid-term and long-term holders are accumulating. The HODL Waves metric tracks the percentage of bitcoin supply held across age bands.
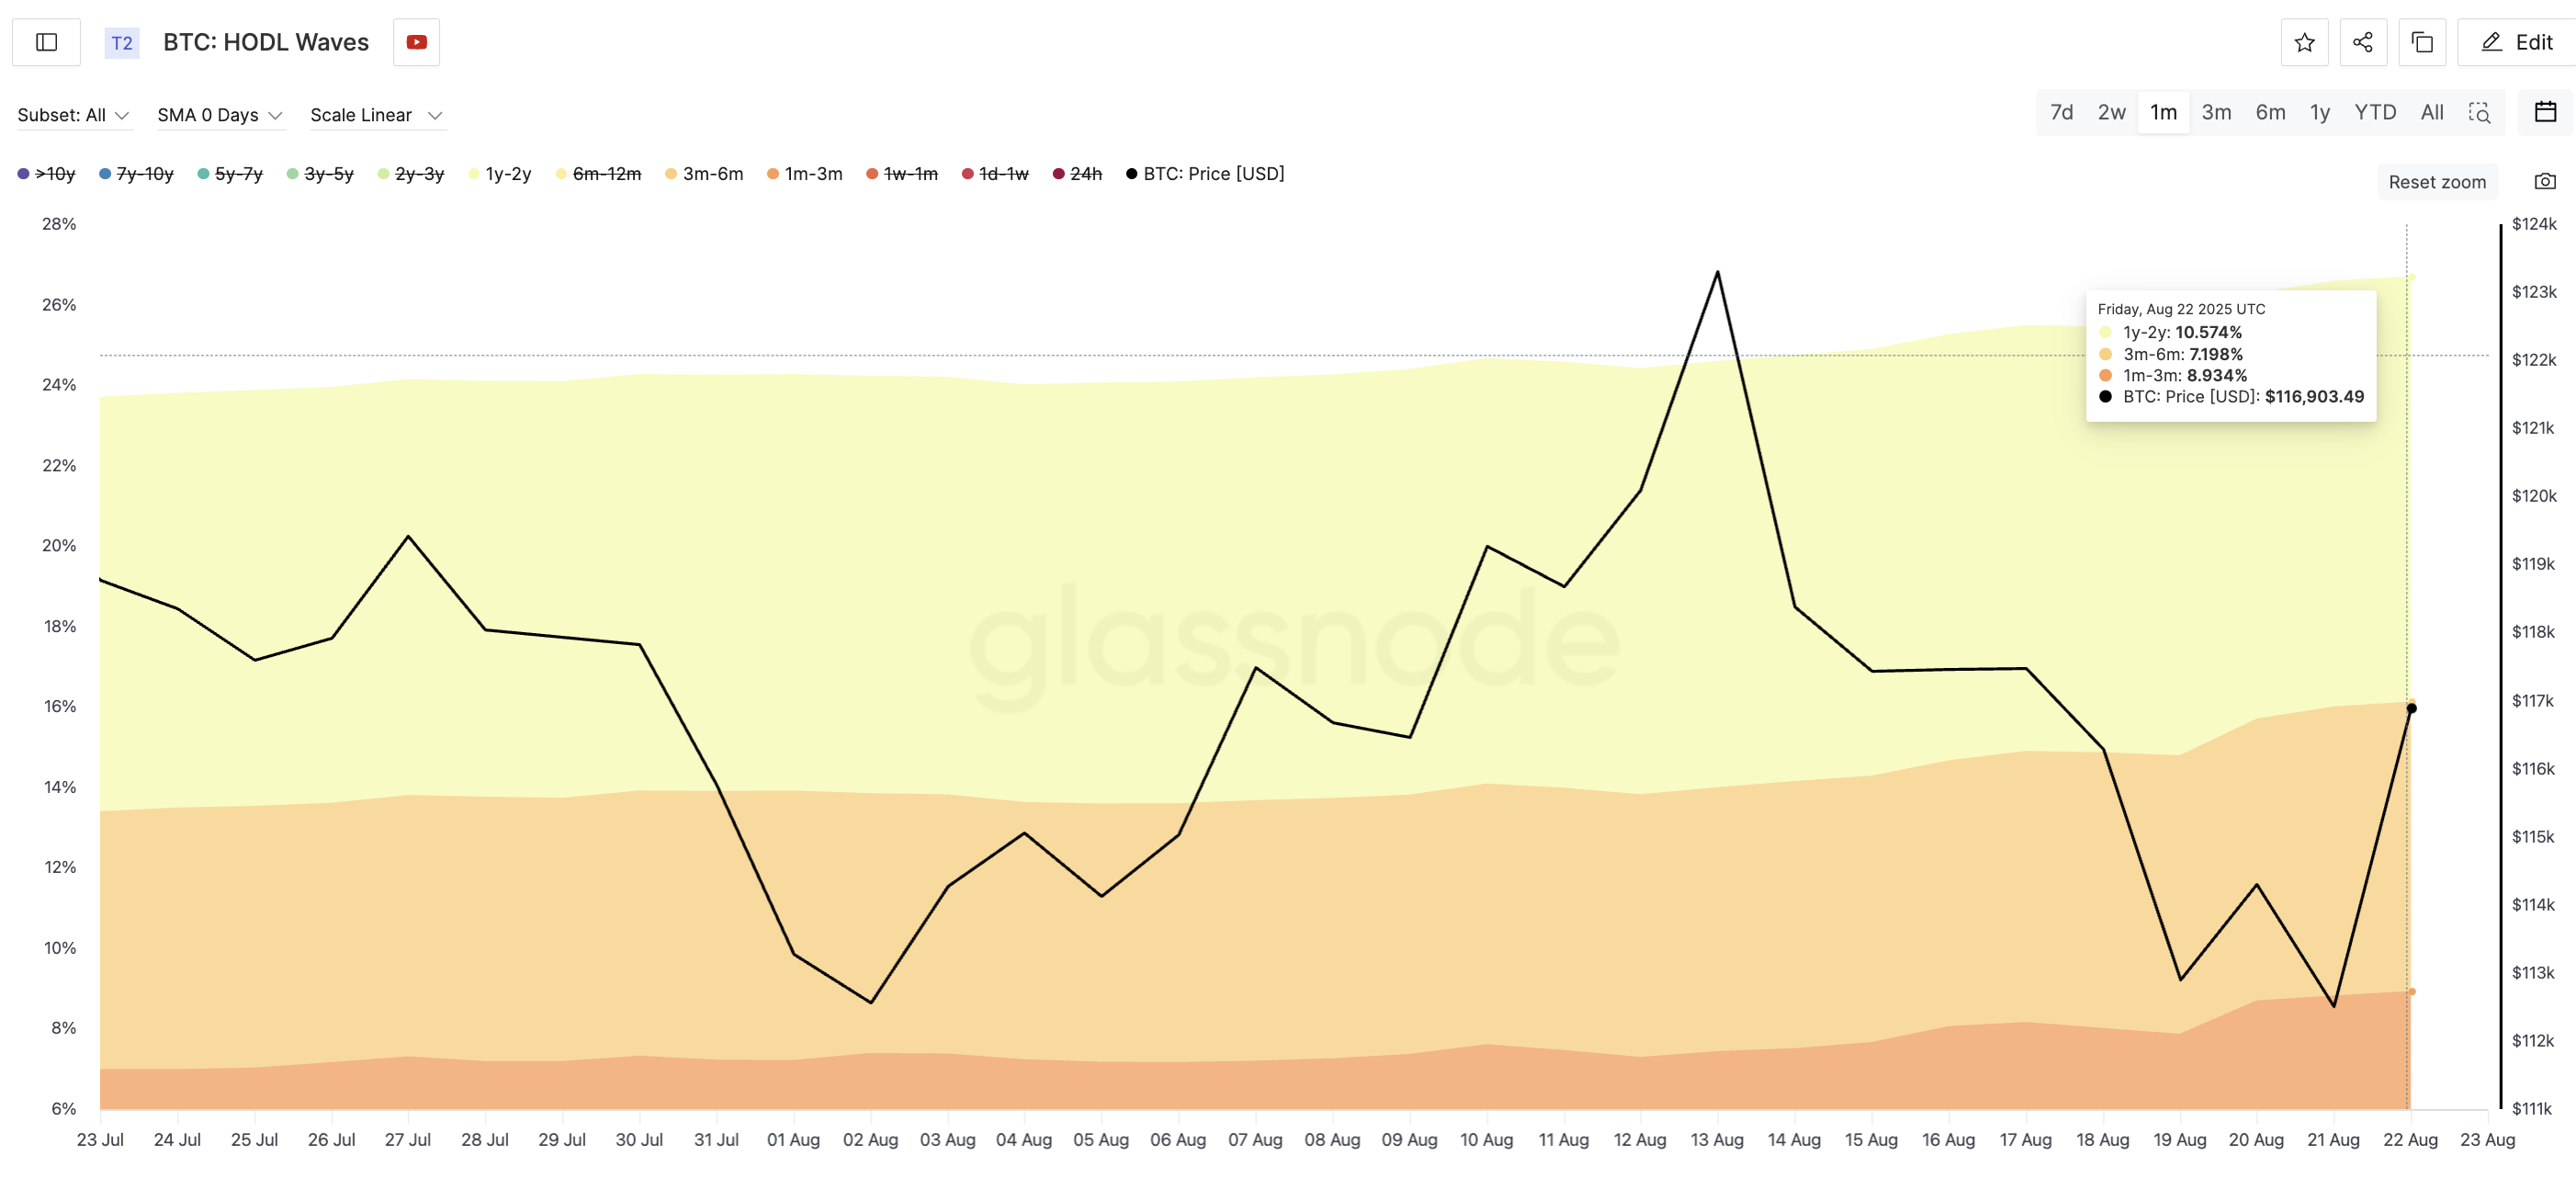
Over the past month, key cohorts have expanded their positions:
- 1y–2y wallets rose from 10.31% to 10.57%
- 3m–6m wallets climbed from 6.40% to 7.19%
- 1m–3m wallets grew from 6.99% to 8.93%
This broad accumulation during volatility suggests that conviction is there. Combined with lower whale exchange flows, the structure points to a market that is gearing up for a bitcoin price breakout.
Bitcoin Price Levels Define the Breakout Path
The technical picture ties these signals together. Bitcoin currently trades just above strong support at $115,400. A critical resistance lies at $117,600, with $119,700 acting as the key breakout trigger for the Bitcoin price to push towards and even beyond its all-time high.
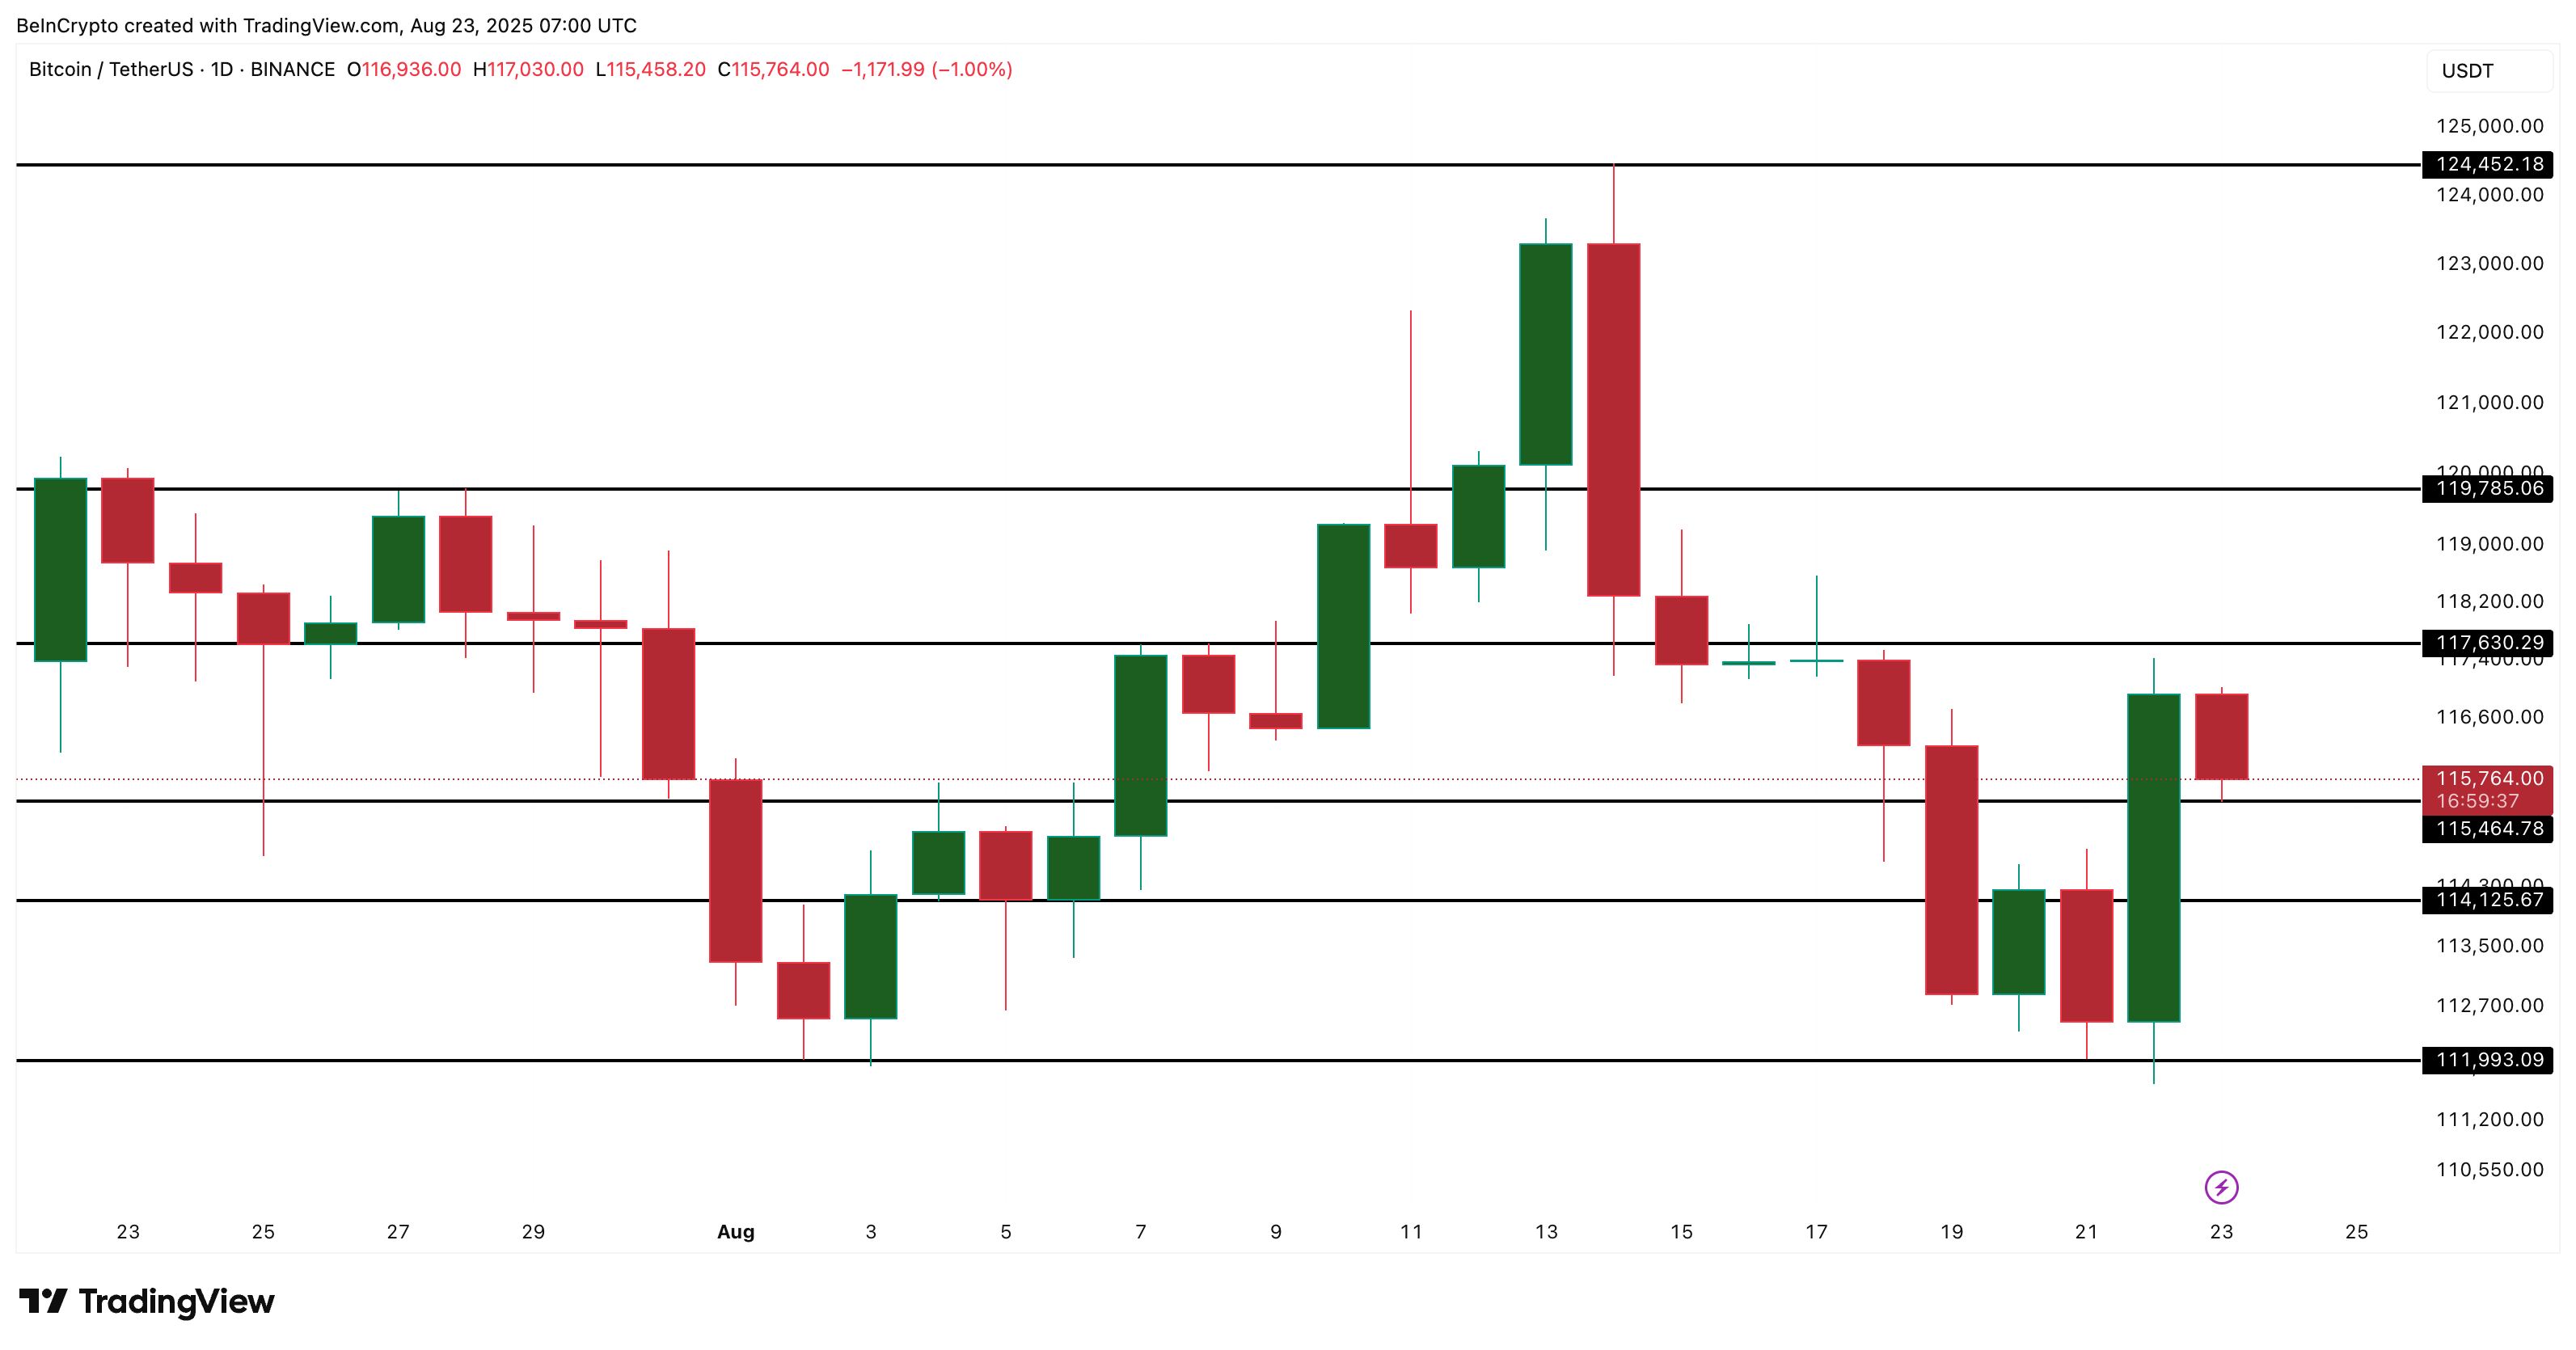
On the other hand, a slip below $114,100, and especially $111,900, WOULD shift the momentum bearish in the short-term
If the exchange whale ratio repeats its August 10th pattern, the Bitcoin price could climb nearly 4% from current levels. That would push the price past $119,000, directly into breakout territory.
From there, the stage would be set for a retest of the all-time high, validating the idea that this rally is delayed, not denied.
