WIF Eyes $1.34 Target as Price Bounces Off Critical Support - Bullish Setup Confirmed

WIF's technical structure flashes green—bouncing firmly from support with clear momentum building toward that $1.34 mark.
Market Pulse: The Rebound
Traders are watching closely as WIF defends key levels. No fluff—just price action doing the talking. A hold here could signal the next leg up.
The Path to $1.34
Resistance levels loom, but the setup suggests strength. If volume follows, we’re looking at a textbook push toward the target. No guarantees—just charts doing chart things.
Because nothing says 'stable store of value' like a meme coin riding a 30% wave on a Tuesday.

Recent technical charts indicate healthy buying interest and consolidating momentum, with key resistance levels in focus that may determine the token’s next directional move.
Ascending Support Trendline Holds Firm as Momentum Builds
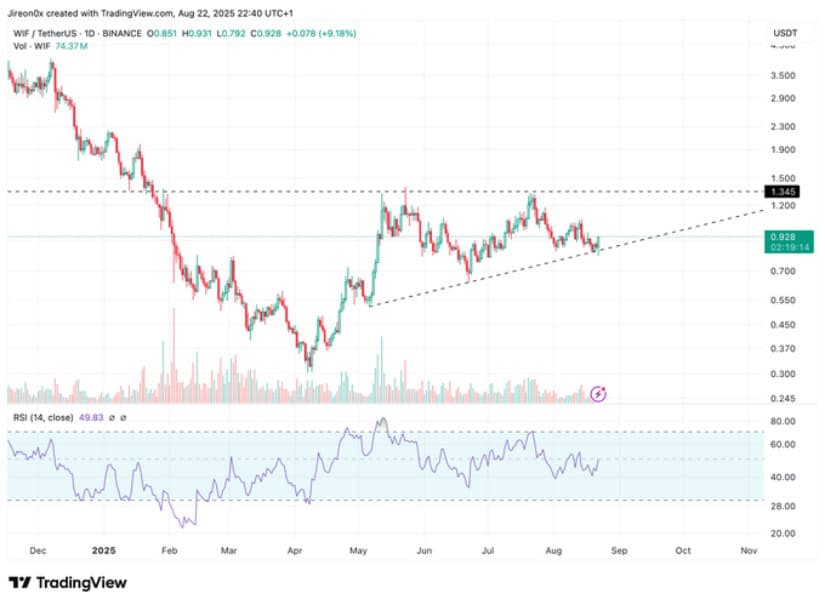
According to analyst Jireon (@jireon0x), $WIF has been supported by a clear ascending trendline since early 2025, with the most recent bounce occurring NEAR the $0.80–$0.85 zone. This area has acted as a robust demand zone, corroborated by volume spikes during price rebounds and a neutral RSI reading around 49, leaving room for a bullish push ahead.
Source: X
The immediate upside target lies near $1.20, an intermediate resistance point, with Jireon’s projection at $1.345 marking the upper boundary of recent consolidation ranges. Breaking above $1.345 could lead to accelerated gains toward the psychological $1.50 level.
Conversely, failure to maintain this ascending support could trigger a retest of the critical $0.70 support zone, placing a greater emphasis on confirmation candles near the trendline to validate direction.
Short-Term Price Action Reflects Active Dip Buying and Resilience
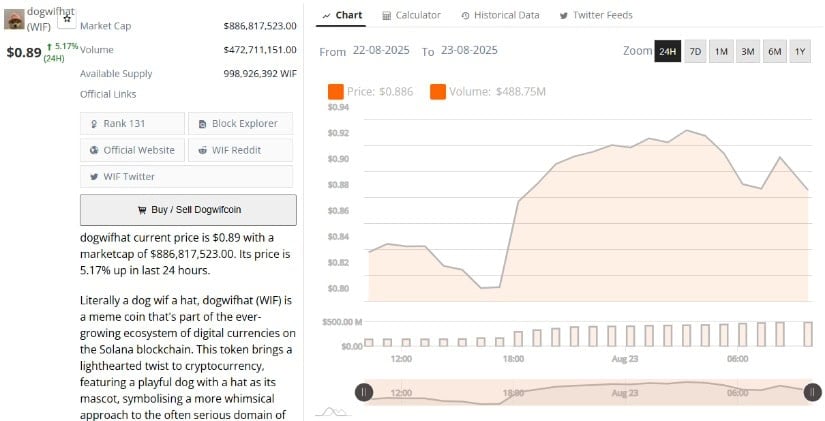
Additionally, BraveNewCoin’s 24-hour performance chart reveals a quick rebound from lows around $0.82 to intraday peaks near $0.92, demonstrating robust liquidity and active trader response. With a market cap of approximately $886 million and nearly $489 million in trading volume, $WIF benefits from significant market participation.
Source: BraveNewCoin
Price swings between $0.84 and $0.92 demonstrate typical short-term volatility for meme coins, yet the overall momentum shows a constructive upward bias. Maintaining prices above $0.88 is crucial to sustaining the bullish structure, as the rising volume supports a resilient floor.
This intraday buying interest suggests that the cryptocurrency may be positioned to retest major resistance levels identified on longer-term charts.
Technical Indicators Signal Consolidation With Breakout Potential
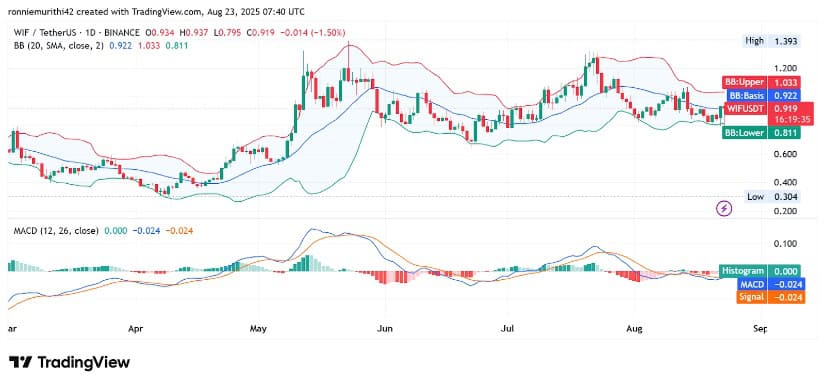
On the other hand, TradingView’s daily chart overlays Bollinger Bands and MACD for $WIF, showing price consolidation near the baseline around $0.92. The lower Bollinger Band at $0.81 aligns closely with recent support, while the upper band near $1.03 marks the next significant resistance level.
Source: TradingView
The MACD lines linger just below zero, reflecting indecision in momentum; however, a bullish crossover could be on the horizon if buying pressure strengthens. Past crossovers in April and July have led to notable rallies, so traders will watch these indicators closely.
With volatility contracting and price near equilibrium, a breakout above $1.03 WOULD likely accelerate momentum, driving the token toward $1.20 and $1.34. On the flip side, dropping below $0.81 risks pushing prices down toward the $0.70 support area.
Overall, the memecon technical landscape suggests an imminent major move, with solid support fueling hopes for a breakout toward $1.34. Traders and investors should closely monitor key resistance and support levels alongside volume and momentum indicators to position themselves optimally as the token approaches this critical juncture.
