Ethereum’s Bullish Pattern Signals Potential Surge to $4,770 - Here’s Why

Ethereum's chart just flashed a signal that could send shockwaves through crypto markets.
The Setup: Technical analysts are tracking a classic bullish formation that historically precedes major price movements. This isn't just trader speculation—the pattern's track record speaks for itself.
The Target: If momentum holds, ETH could challenge the $4,770 resistance level. That represents a significant upside from current valuations, though anyone who's been in crypto longer than a coffee cycle knows targets are more aspirations than guarantees.
The Catalyst: Market sentiment aligns with technical indicators, creating perfect conditions for a breakout. Institutional flows and protocol upgrades provide fundamental support behind the technical narrative.
The Reality Check: Of course, in crypto, patterns break as often as they make—remember when everyone thought 'this time it's different' right before the last 40% correction? Professional traders are watching volume confirmation before committing additional capital.
Bottom line: Ethereum's chart suggests serious upside potential, but in a market where 'irrational exuberance' is practically a trading strategy, maybe don't mortgage the house just yet.
Short-Term Holders Step Back In
One sign of renewed strength comes from short-term wallets. These are addresses that typically hold ETH for a few days or weeks before selling. After weeks of trimming exposure, this group has started buying again.
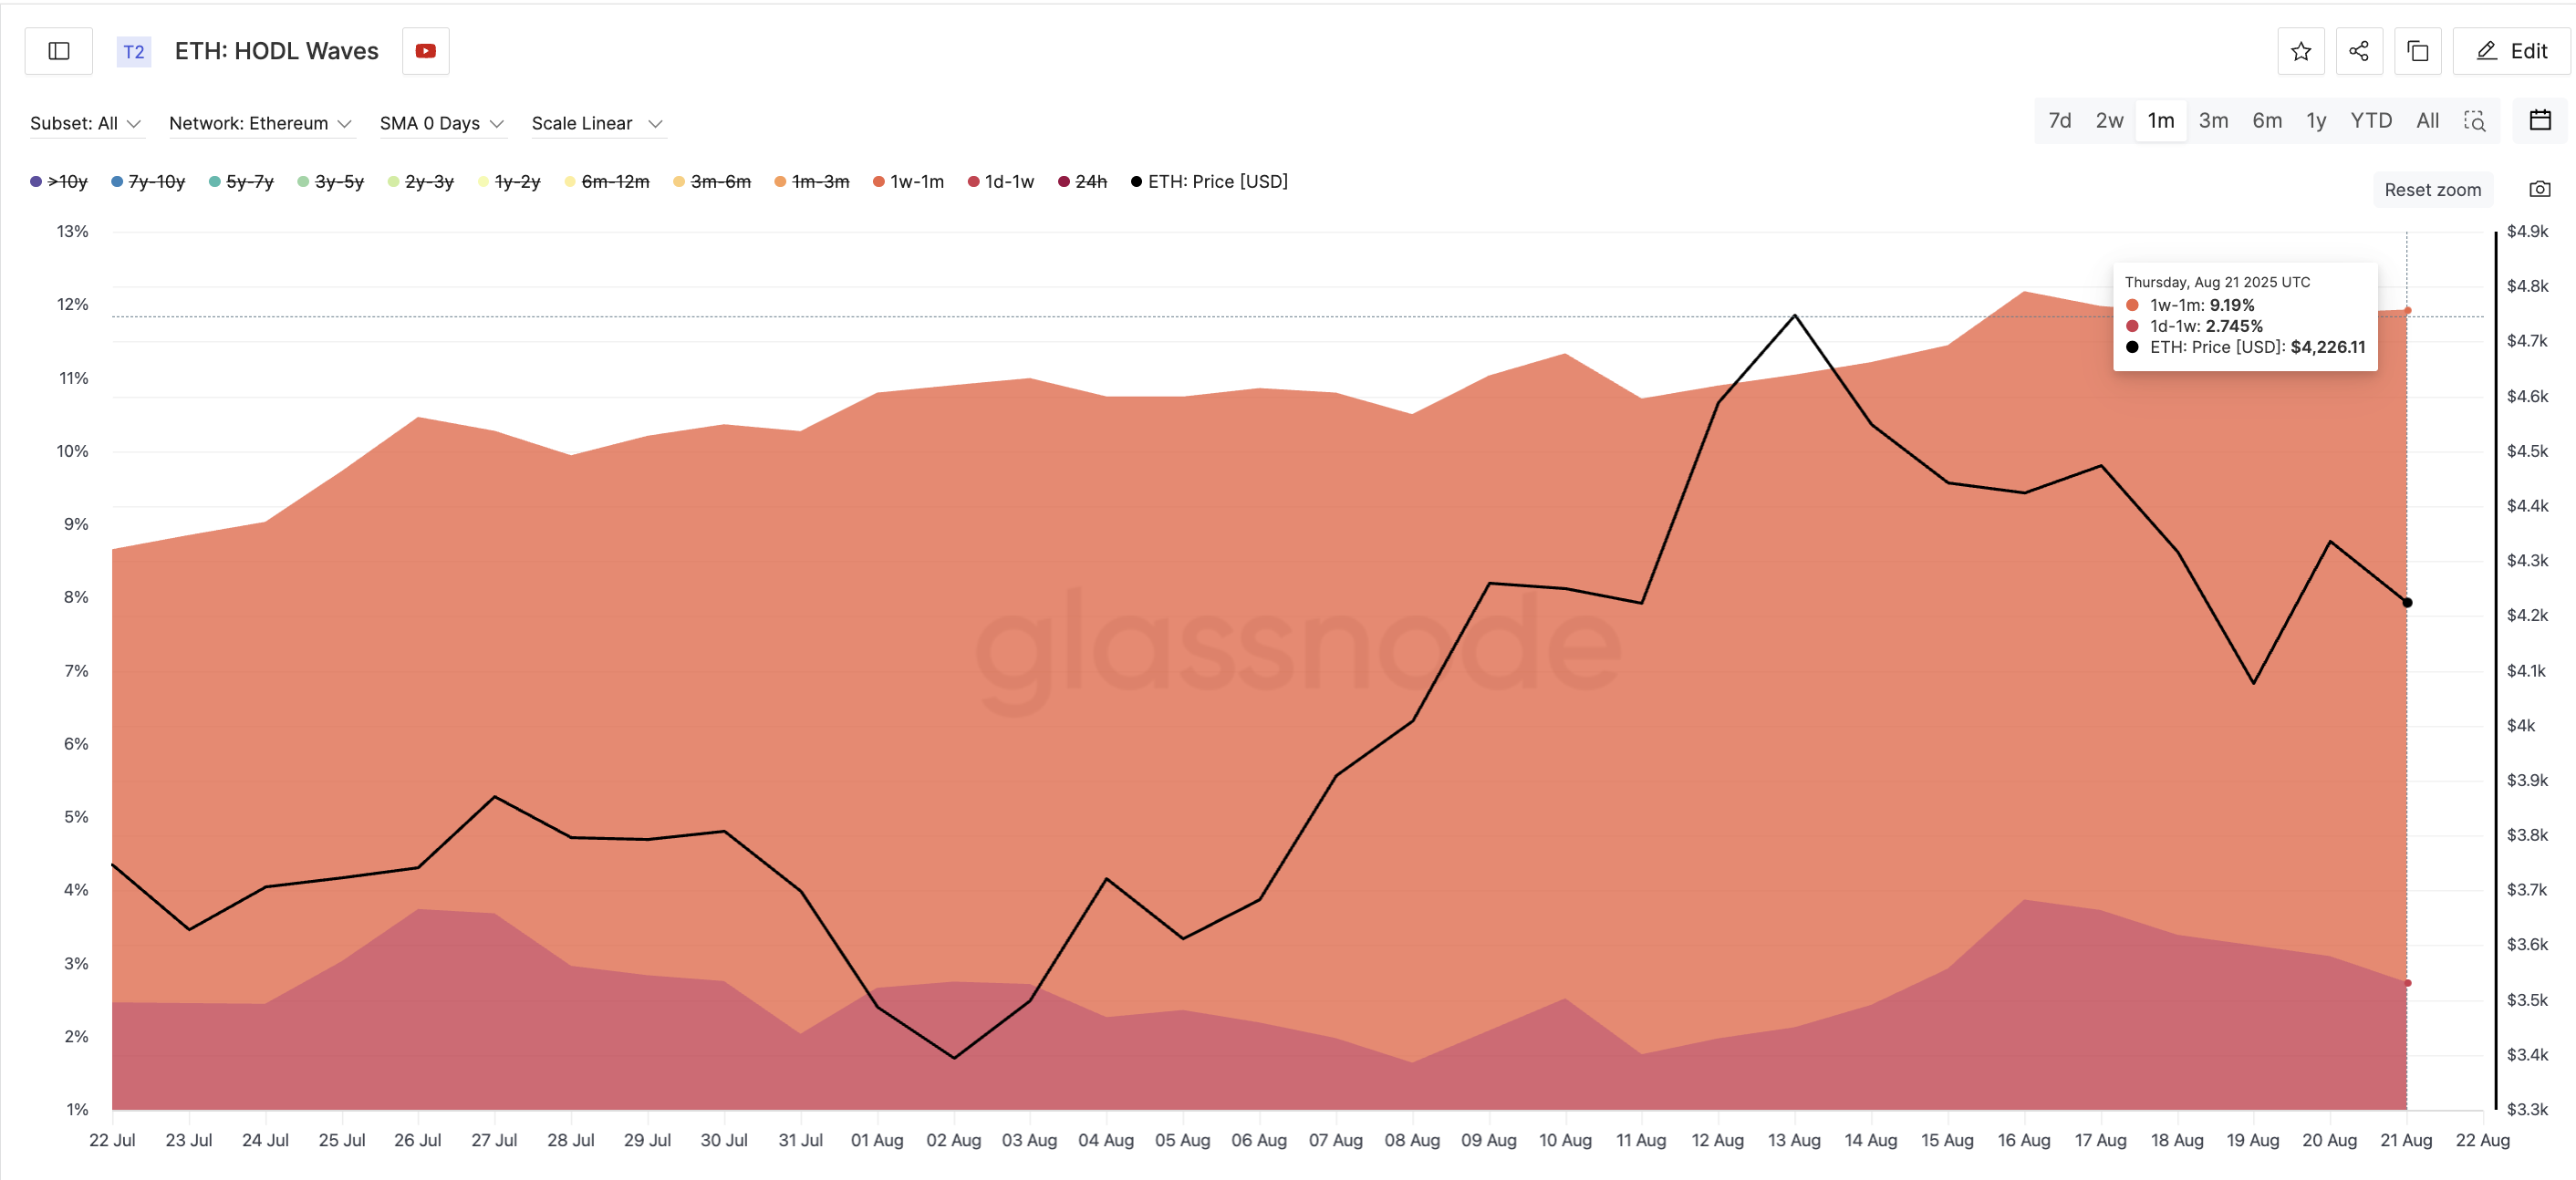
Data shows that 1-week to 1-month holders grew their share of ETH supply from 6.9% on July 22 to 9.19% on August 21. At the same time, 1-day to 1-week holders ROSE from 1.64% on August 8 to 2.74% on August 21. That represents a 67% increase in just two weeks, a clear indication that fresh buying pressure is returning.
HODL Waves show the share of coins held across different time bands, from a few days to several years. It helps reveal whether short-term traders or long-term holders are driving market activity.
Why does this matter? These short-term cohorts are often the first to react when they see an opportunity. Their renewed activity suggests confidence that the ETH price may have found a local floor and could be gearing up for the next move higher.
: Want more token insights like this? Sign up for Editor Harsh Notariya’s Daily crypto Newsletter here.
SOPR Hints at Market Bottom
Another piece of the puzzle comes from the Spent Output Profit Ratio (SOPR), a metric that tracks whether coins moving on-chain are being sold at a profit or a loss. When SOPR is high, it means holders are cashing out in profit. When it drops closer to 1 or below, more so with the prices correcting, it shows sellers are taking fewer profits, often NEAR local bottoms.
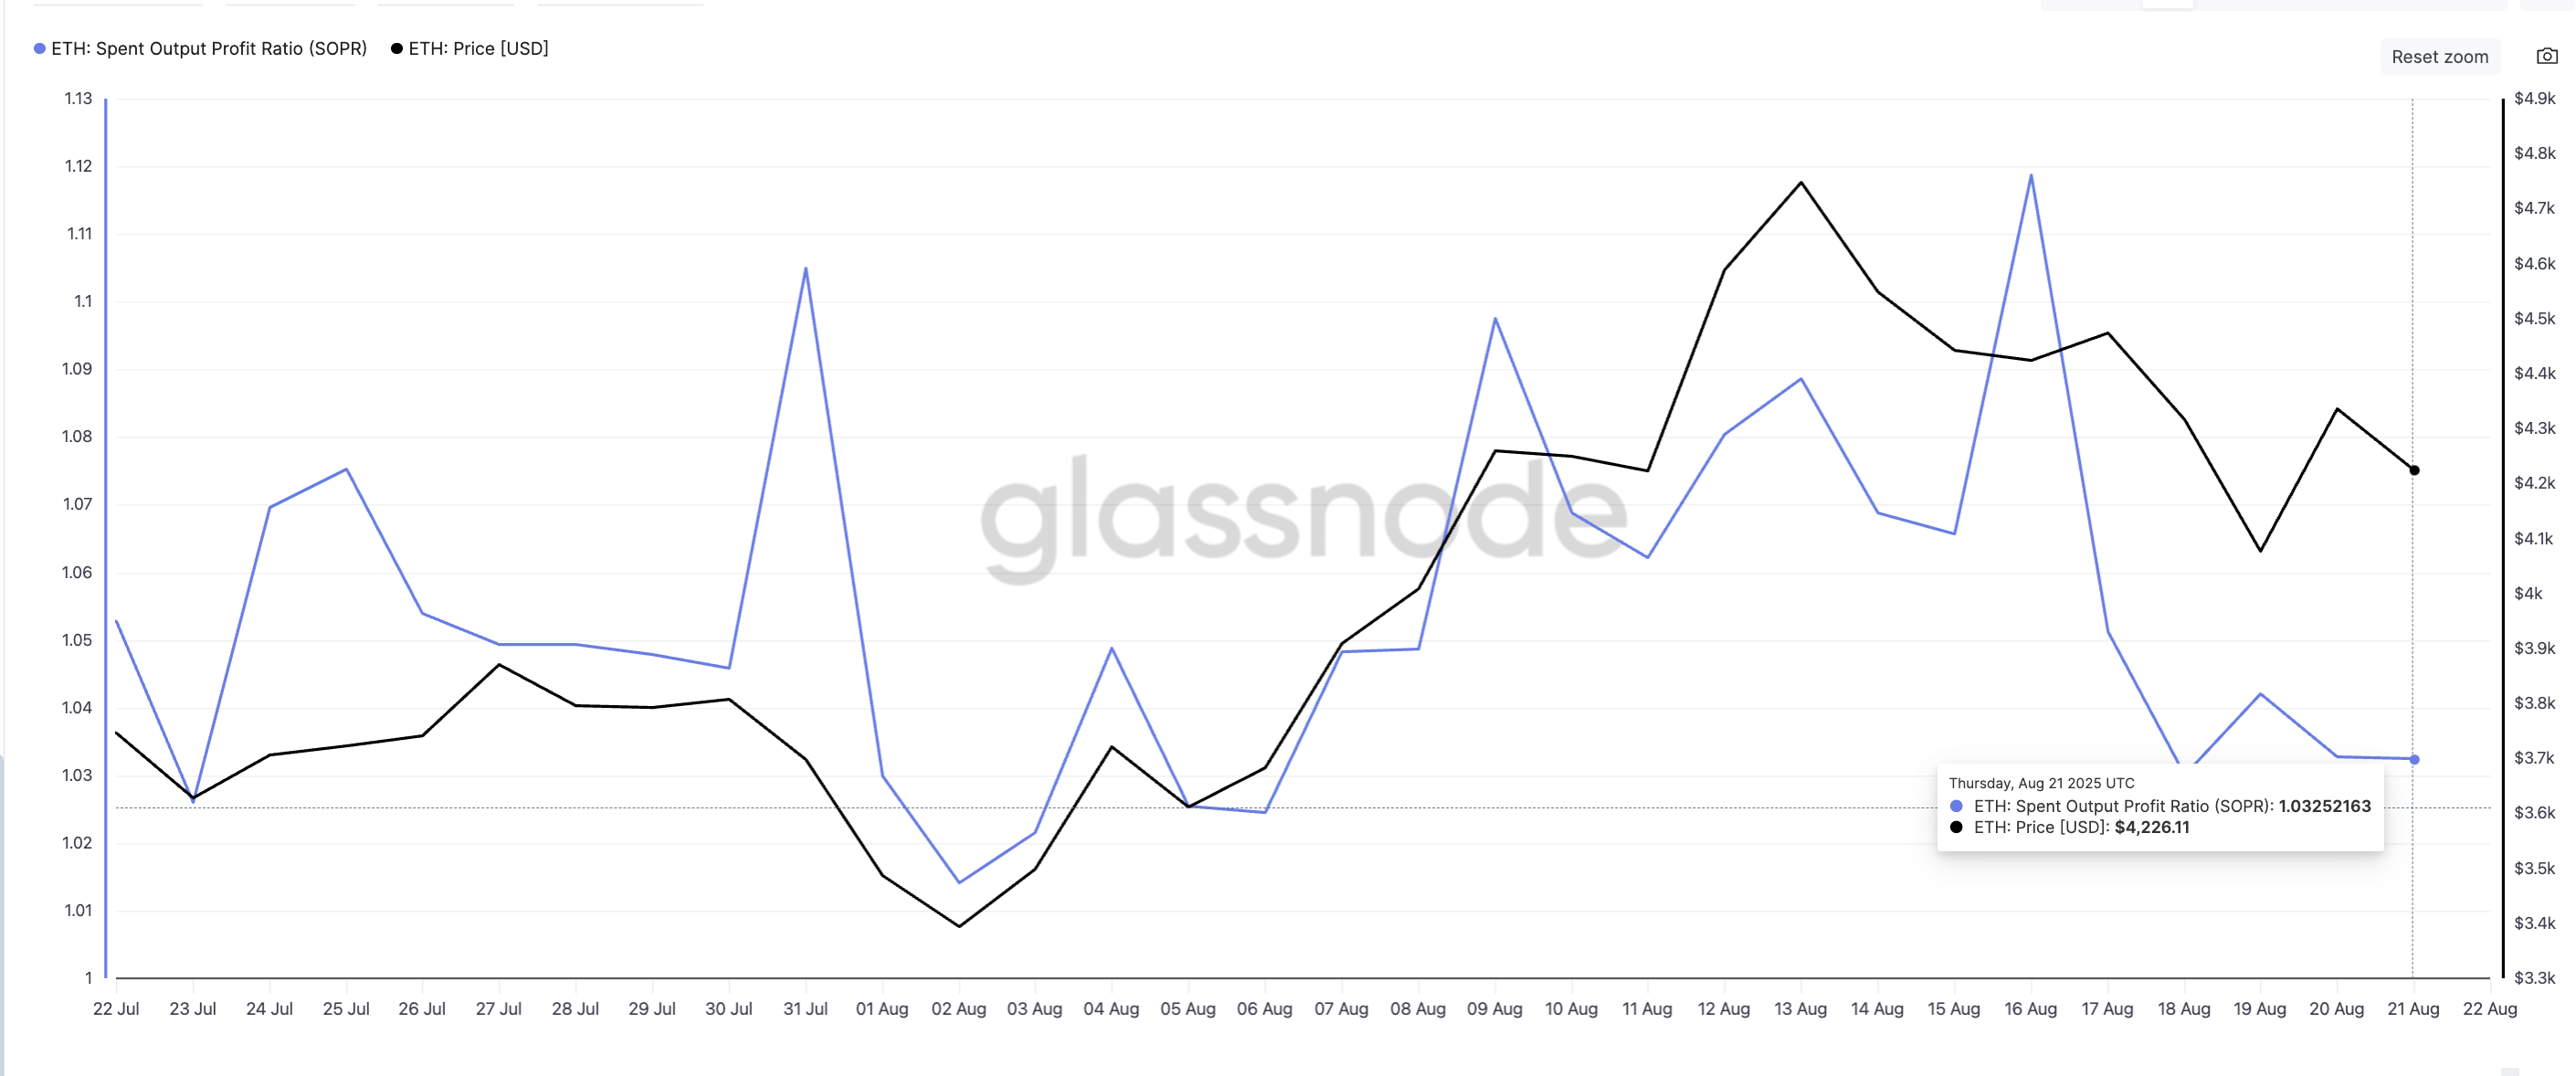
Over the past week, ETH’s SOPR dropped from 1.11 to 1.03. A similar move was last observed on July 31, when the ratio decreased from 1.10 to 1.01. At the time, the drop marked a market bottom. ETH bounced from $3,612 to $4,748 in the following days — a 31% rally.
A similar setup may be forming now. The SOPR decline suggests profit-taking is drying up while sellers weaken, creating the conditions for buyers to step back in. If history repeats, this could be the early signal of another ethereum price rally.
Inverse Head And Shoulders Ethereum Price Pattern in Play
Beyond on-chain signals, the price chart itself is flashing a strong setup. On the 4-hour chart, ETH is forming an inverse head and shoulders pattern, a classic bullish reversal signal. The neckline of this pattern sits near $4,379 and is slightly sloping upward, which often strengthens the breakout case.
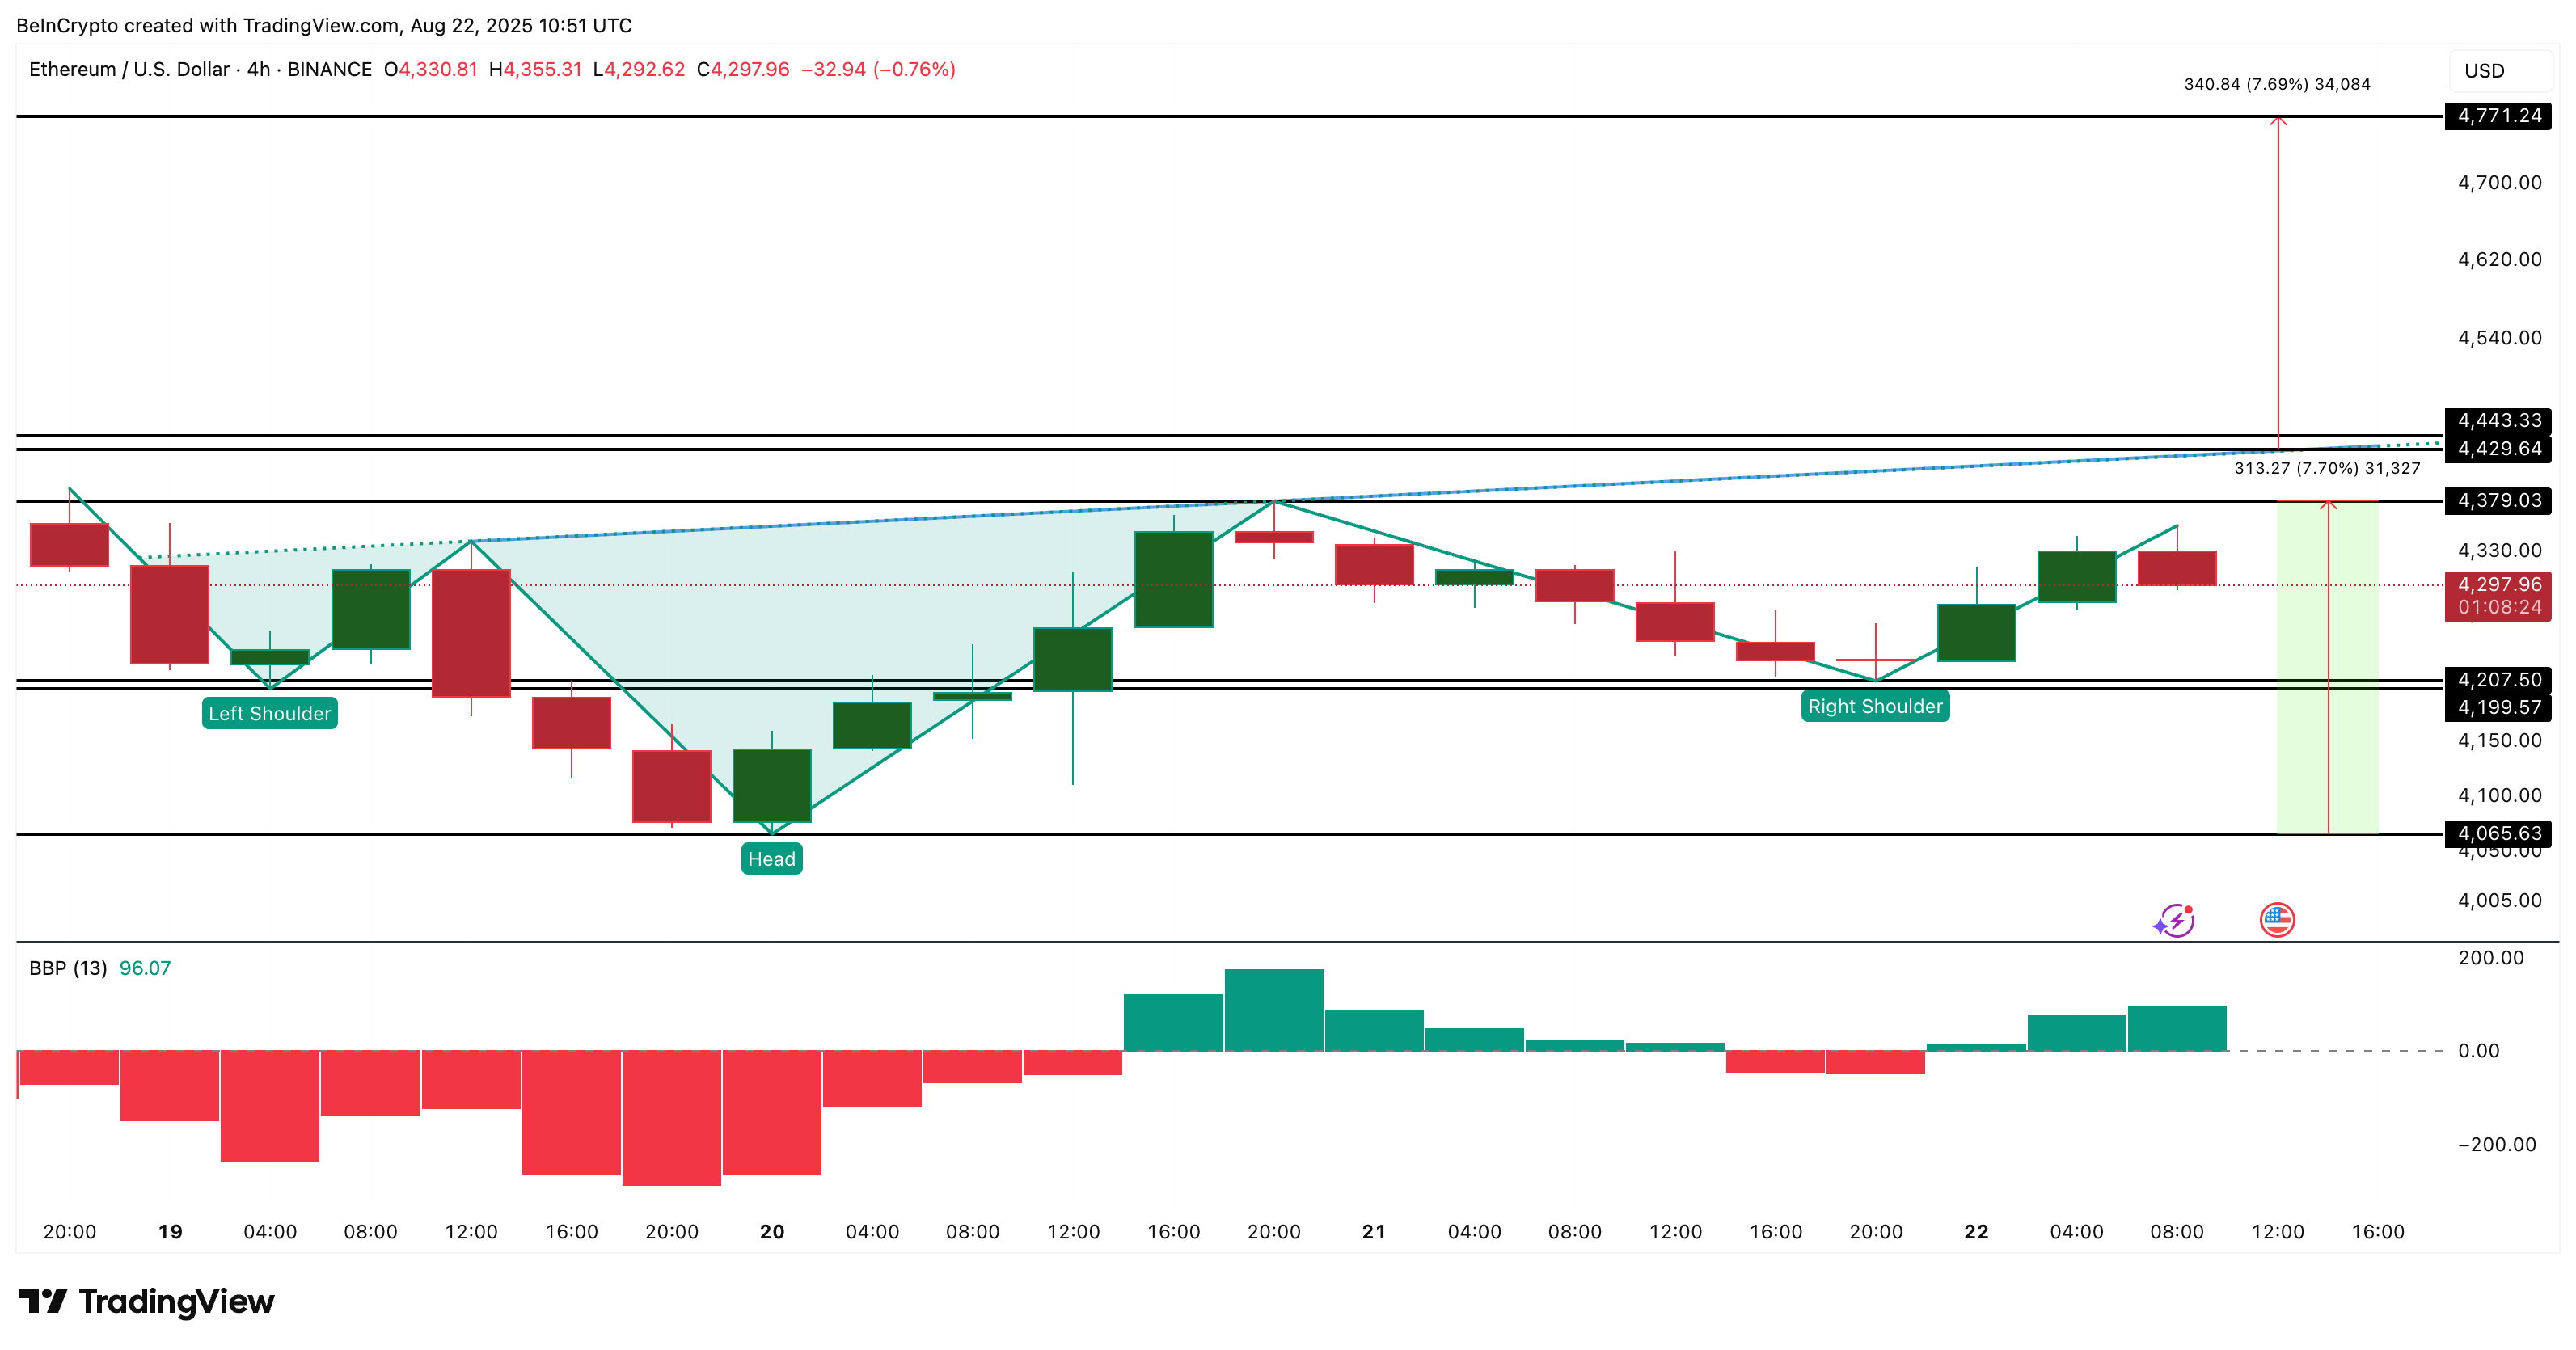
For confirmation, the ETH price needs to clear $4,443. If that happens, the technical target points toward $4,770, calculated from the distance between the neckline and the head. This lines up with the broader bullish signals from short-term buyers and SOPR. Even the increase in the bullish momentum, while the Ethereum price flirts with a breakout pattern, strengthens the bullish case.
The increase in bullish momentum can be exhibited by the rising green bars in the Bull Bear Power indicator, which measures the gap between the highest price and a moving average to show whether buyers or sellers are in control.
Still, traders should watch the invalidation level. If ETH slips below $4,207 (the base of the right shoulder), the pattern fails and the bullish thesis weakens.
