Bullish Crossover Rescues Pi Coin - But Hidden Trends Reveal the Real Story

Pi Coin's technical breakout sparks rally—yet deeper metrics hint at underlying turbulence.
Technical Rebound or Mirage?
The crossover pushed prices upward, catching short-sellers off guard. Momentum indicators flipped green, but volume patterns tell a different tale—thin liquidity plagued the surge.
Behind the Hype
While retail traders cheer the bounce, on-chain data exposes weak holder accumulation. Large wallets continue distributing—smart money isn’t buying the rebound narrative.
Market Realities
Tokenomics remain inflationary, and mainnet delays linger like a bad hangover. Even in crypto, hope isn’t a strategy—unless you’re fond of buying high and praying higher.
Final Take: Bulls celebrate the chart rescue, but the real story unfolds off-screen. Always does.
1-Hour Crossover Gives Short-Term Relief
On the 1-hour chart, Pi showed a bullish crossover when the 20 EMA, or Exponential Moving Average, moved above the 50 EMA. This pushed the price up to about $0.37, helping it hold ground through the last session.
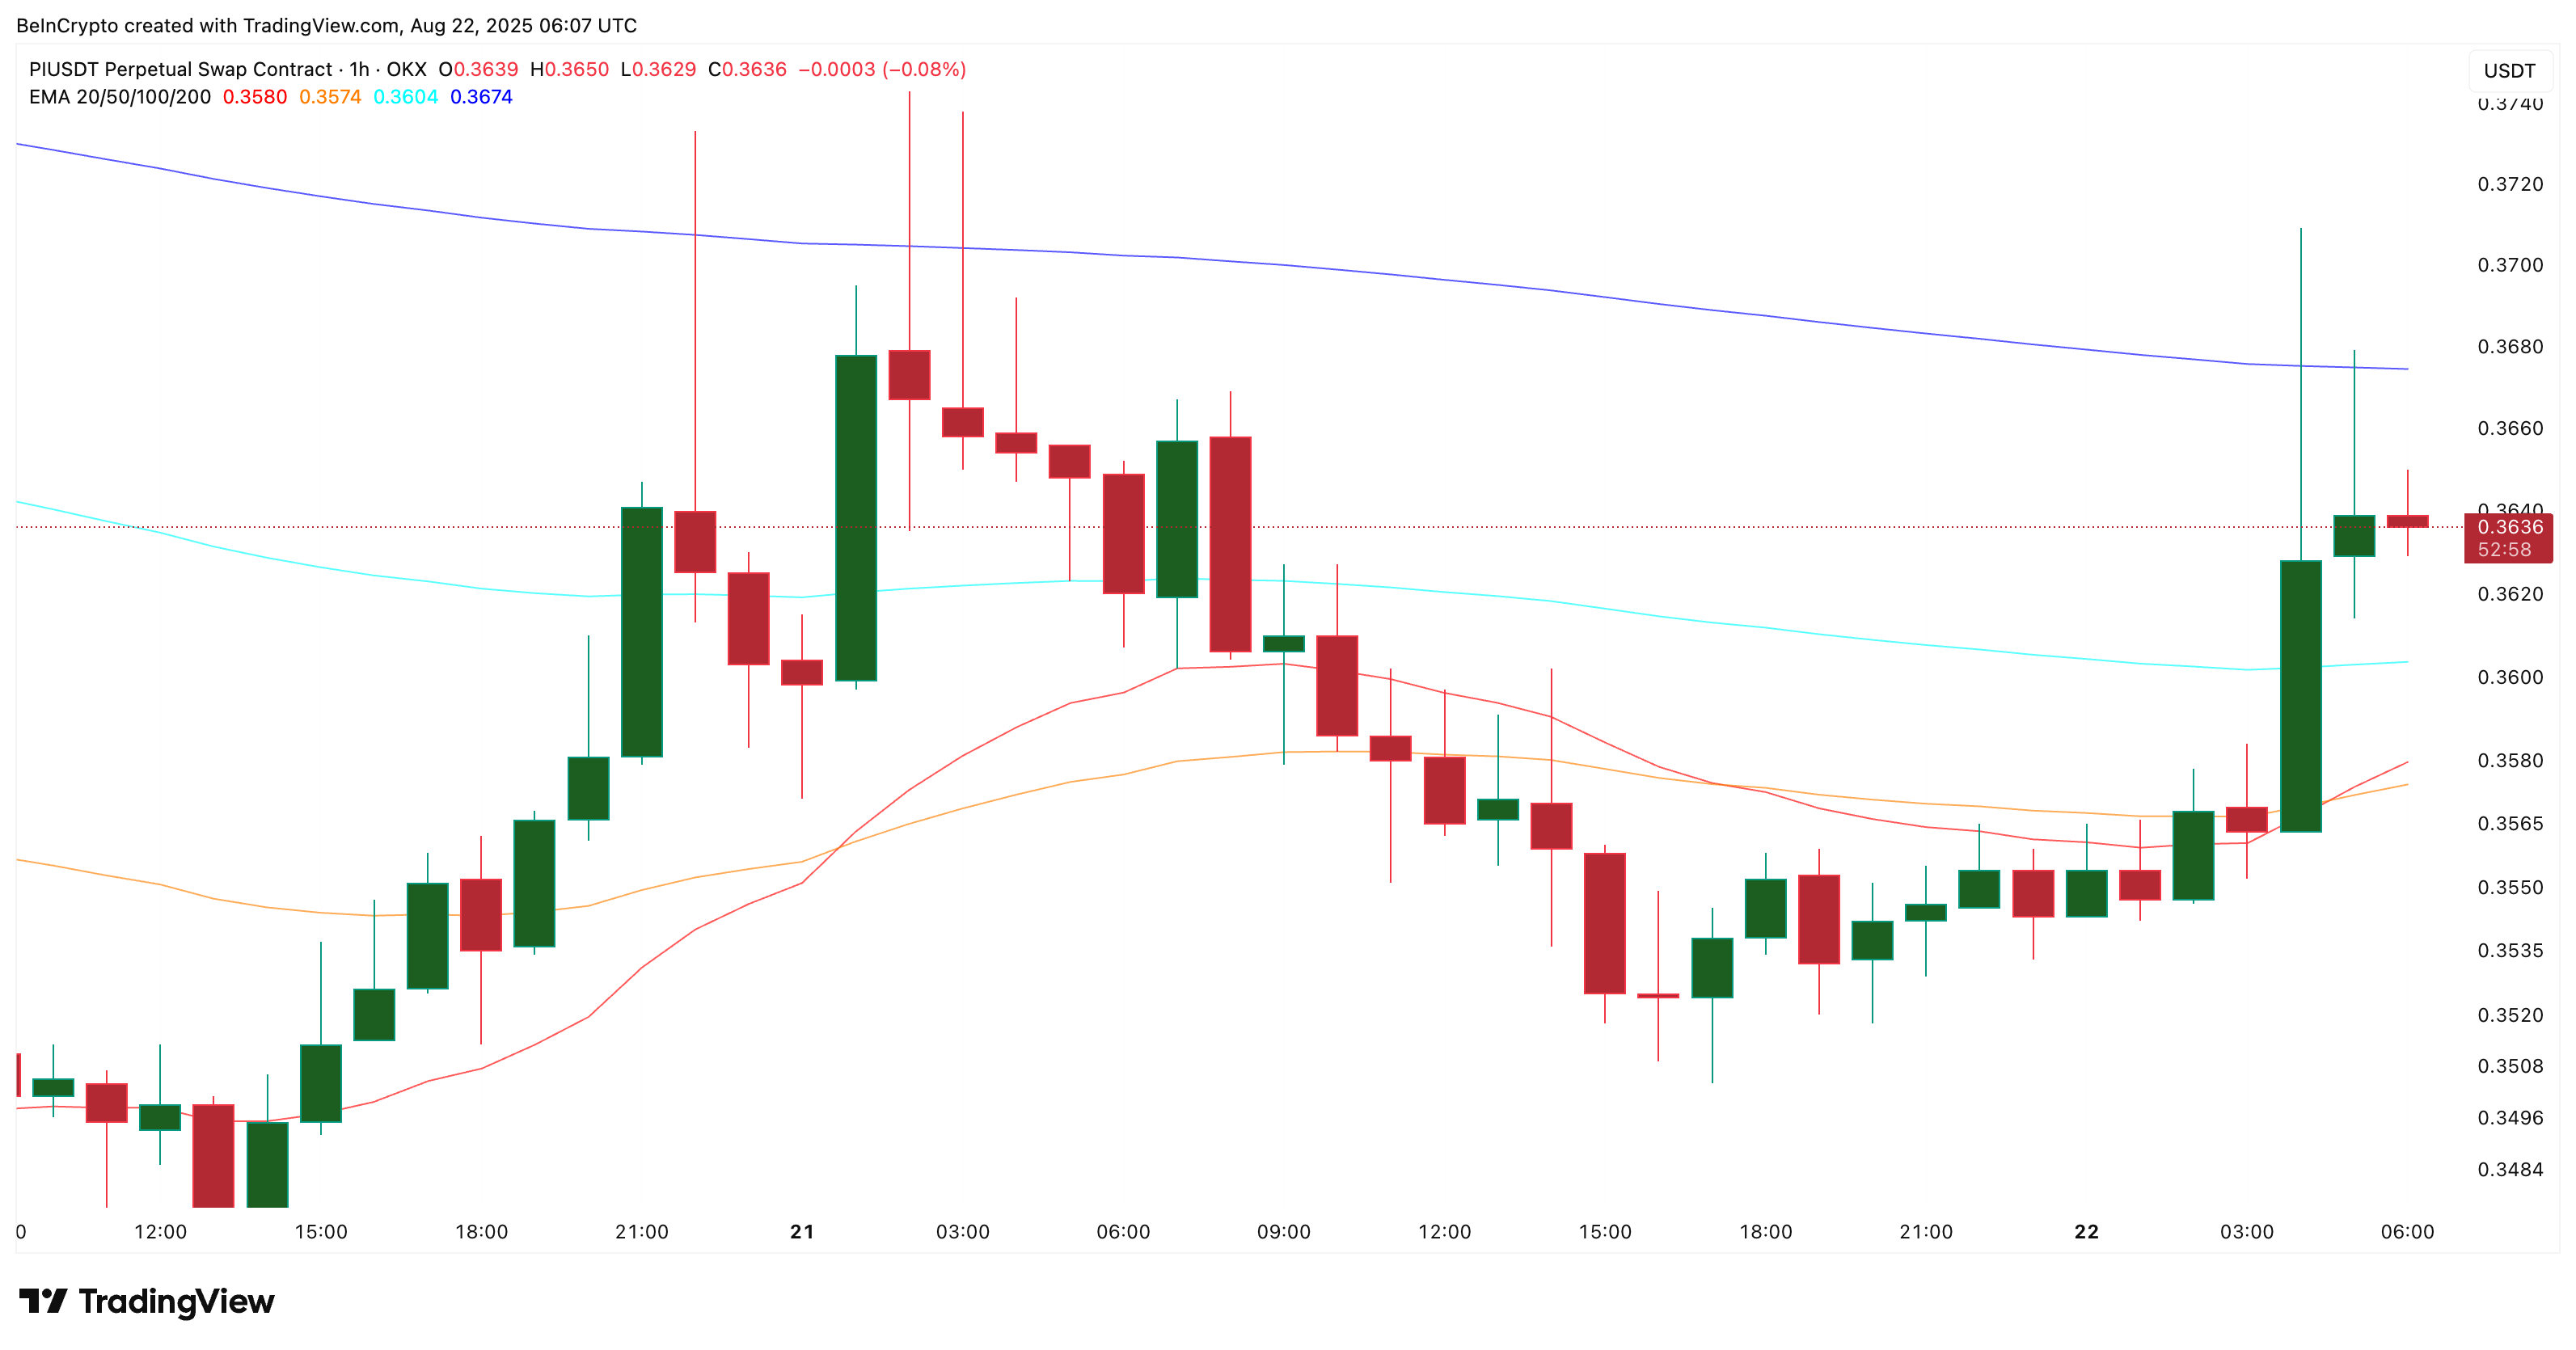
An Exponential Moving Average (EMA) tracks price by giving more weight to recent moves. A bullish crossover happens when a shorter EMA climbs above a longer EMA, often seen as an early sign of buyer strength.
This is not the first time it has happened. On August 20, a similar crossover lifted PI from $0.35 to $0.37. The bounce lasted only briefly. Prices slipped back soon after. The pattern shows that short-term crossovers can spark bursts, but they have not changed the larger trend for Pi Coin.
That is why today’s move, while helpful, may not be enough on its own. For a better view, we need to look deeper.
: Want more token insights like this? Sign up for Editor Harsh Notariya’s Daily crypto Newsletter here.
Longer Timeframe Chart Shows Bullish Divergence
The 12-hour Pi Coin price chart reveals a deeper trend. On August 20, PI touched $0.3739, and on August 22, it peaked at $0.3712. These are lower highs in price.
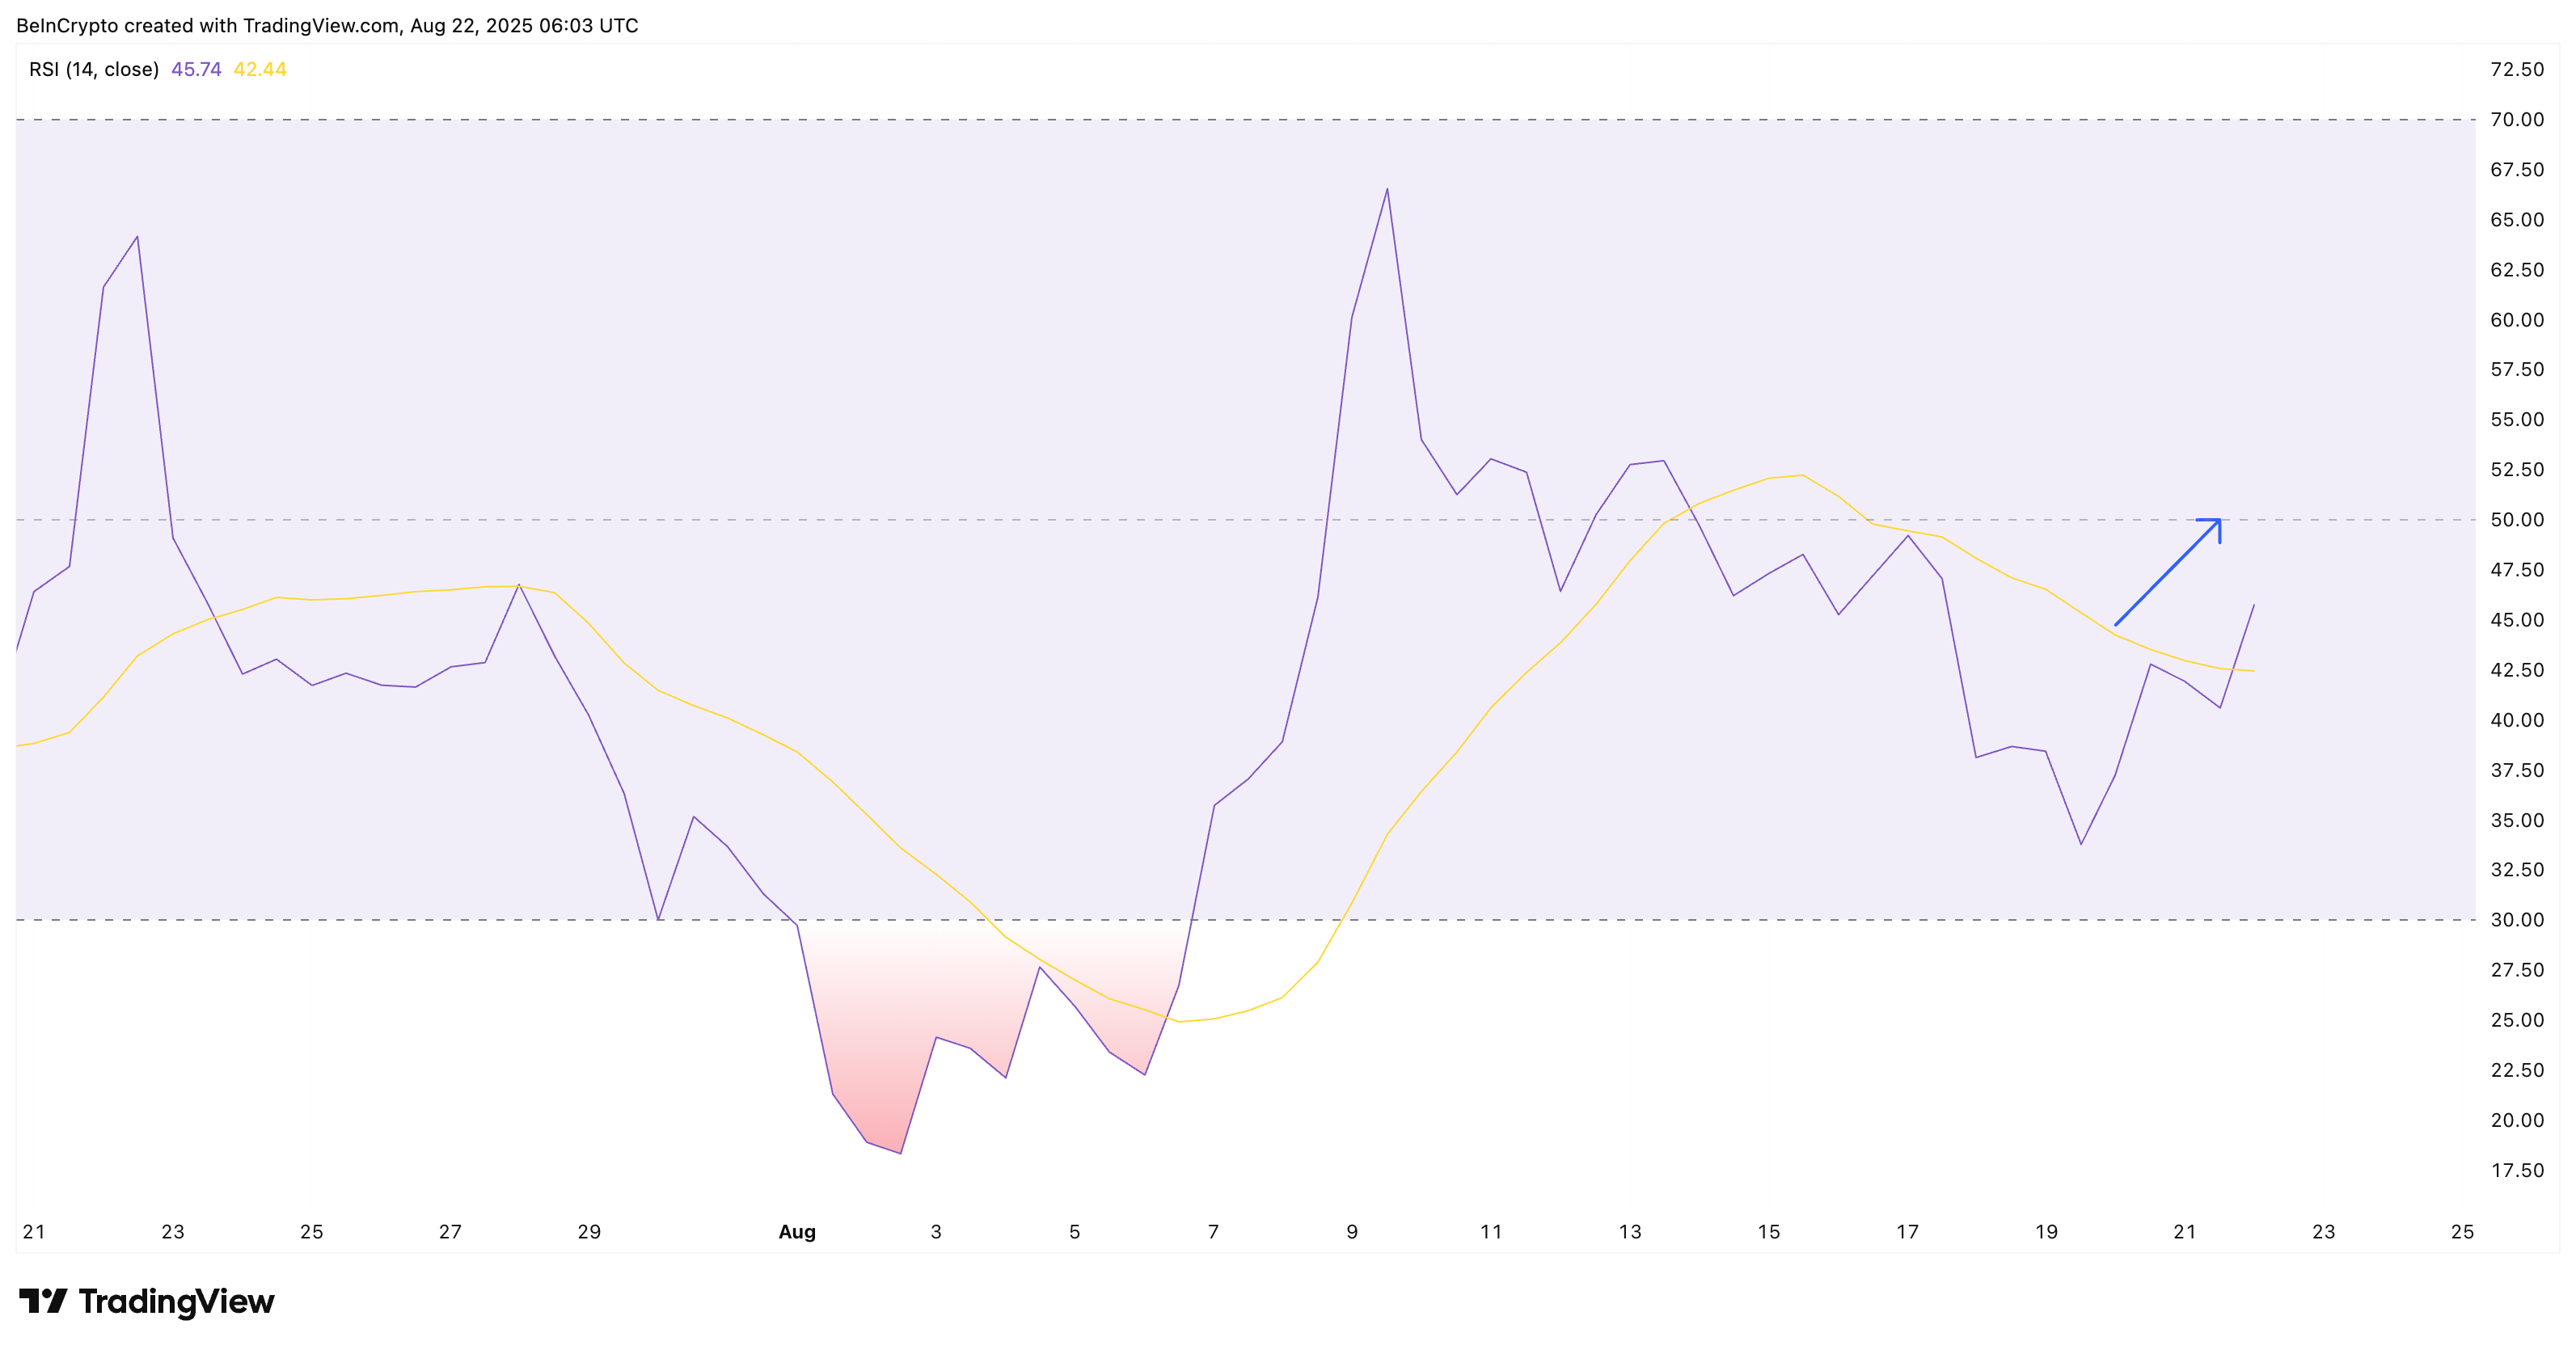
In the same period, the RSI made higher highs. This is called a bullish divergence, meaning sellers pushed prices down, but buyers quietly gained strength.
For Pi Coin, this is unusual. The token has spent much of the year making new lows. The divergence on a slightly longer timeframe shows that buyers may finally be resisting the pressure. And this trend means that the 1-hour crossover, encountered earlier, might hold more weight now.
The Relative Strength Index (RSI) measures momentum on a scale of 0 to 100. A bullish divergence happens when the price makes lower highs, but the RSI makes higher highs, suggesting buyers are quietly gaining ground.
Key Pi Coin Price Levels To Watch
For the bullish case to hold, PI must clear $0.37 and then $0.38 on the 12-hour chart. The stronger confirmation sits at $0.40. A breakout above this level WOULD show real strength, beyond short-term crossovers.

The bull–bear pattern adds to the bullish view. Bear momentum weakened after August 20. Sellers tried to extend losses, but pressure dropped on August 21 and August 22. At the same time, sentiment improved with the launch of the PI/USDC pair on OKX, which gave buyers a reason to step in.
If the price falls back under $0.33, the setup weakens. Invalidation below that level would likely lead to new lows, which Pi Coin has often shown before.
