OKB Skyrockets to Record $195 Following Massive 93% Supply Burn—But Analysts Spot Red Flags

OKB just shattered records—hitting a staggering $195 after incinerating 93% of its total supply. The token's meteoric rise has traders buzzing and skeptics raising eyebrows.
The Burn Effect
Supply cuts trigger scarcity—and scarcity drives demand. OKB's aggressive token burn sent prices soaring past previous resistance levels. But market watchers note thin liquidity and concentrated holdings could spell trouble ahead.
Warning Signs Flash
While retail investors celebrate new all-time highs, seasoned traders spot worrying patterns—whale-dominated order books, exaggerated price swings, and that classic crypto combo of hype and fragile fundamentals. Another 'healthy correction' waiting to happen? Probably.
Remember—what goes up fast often comes down faster. Especially when traditional finance folks start calling it 'disruptive innovation' while quietly taking profits.
OKB Rally Supercharged by Token Burn
OKB is one of the best-performing crypto assets of the past week. Its price has soared nearly 85% in the past seven days. This price surge comes on the heels of a massive token burn that slashed OKB’s circulating supply by 93%.
This aggressive reduction has intensified investor demand, and technical indicators suggest the likelihood of a sustained rally if this continues. For example, OKB’s Aroon Up Line is 100% at press time, indicating the uptrend is strong and backed by significant capital.
: Want more token insights like this? Sign up for Editor Harsh Notariya’s Daily Crypto Newsletter here.
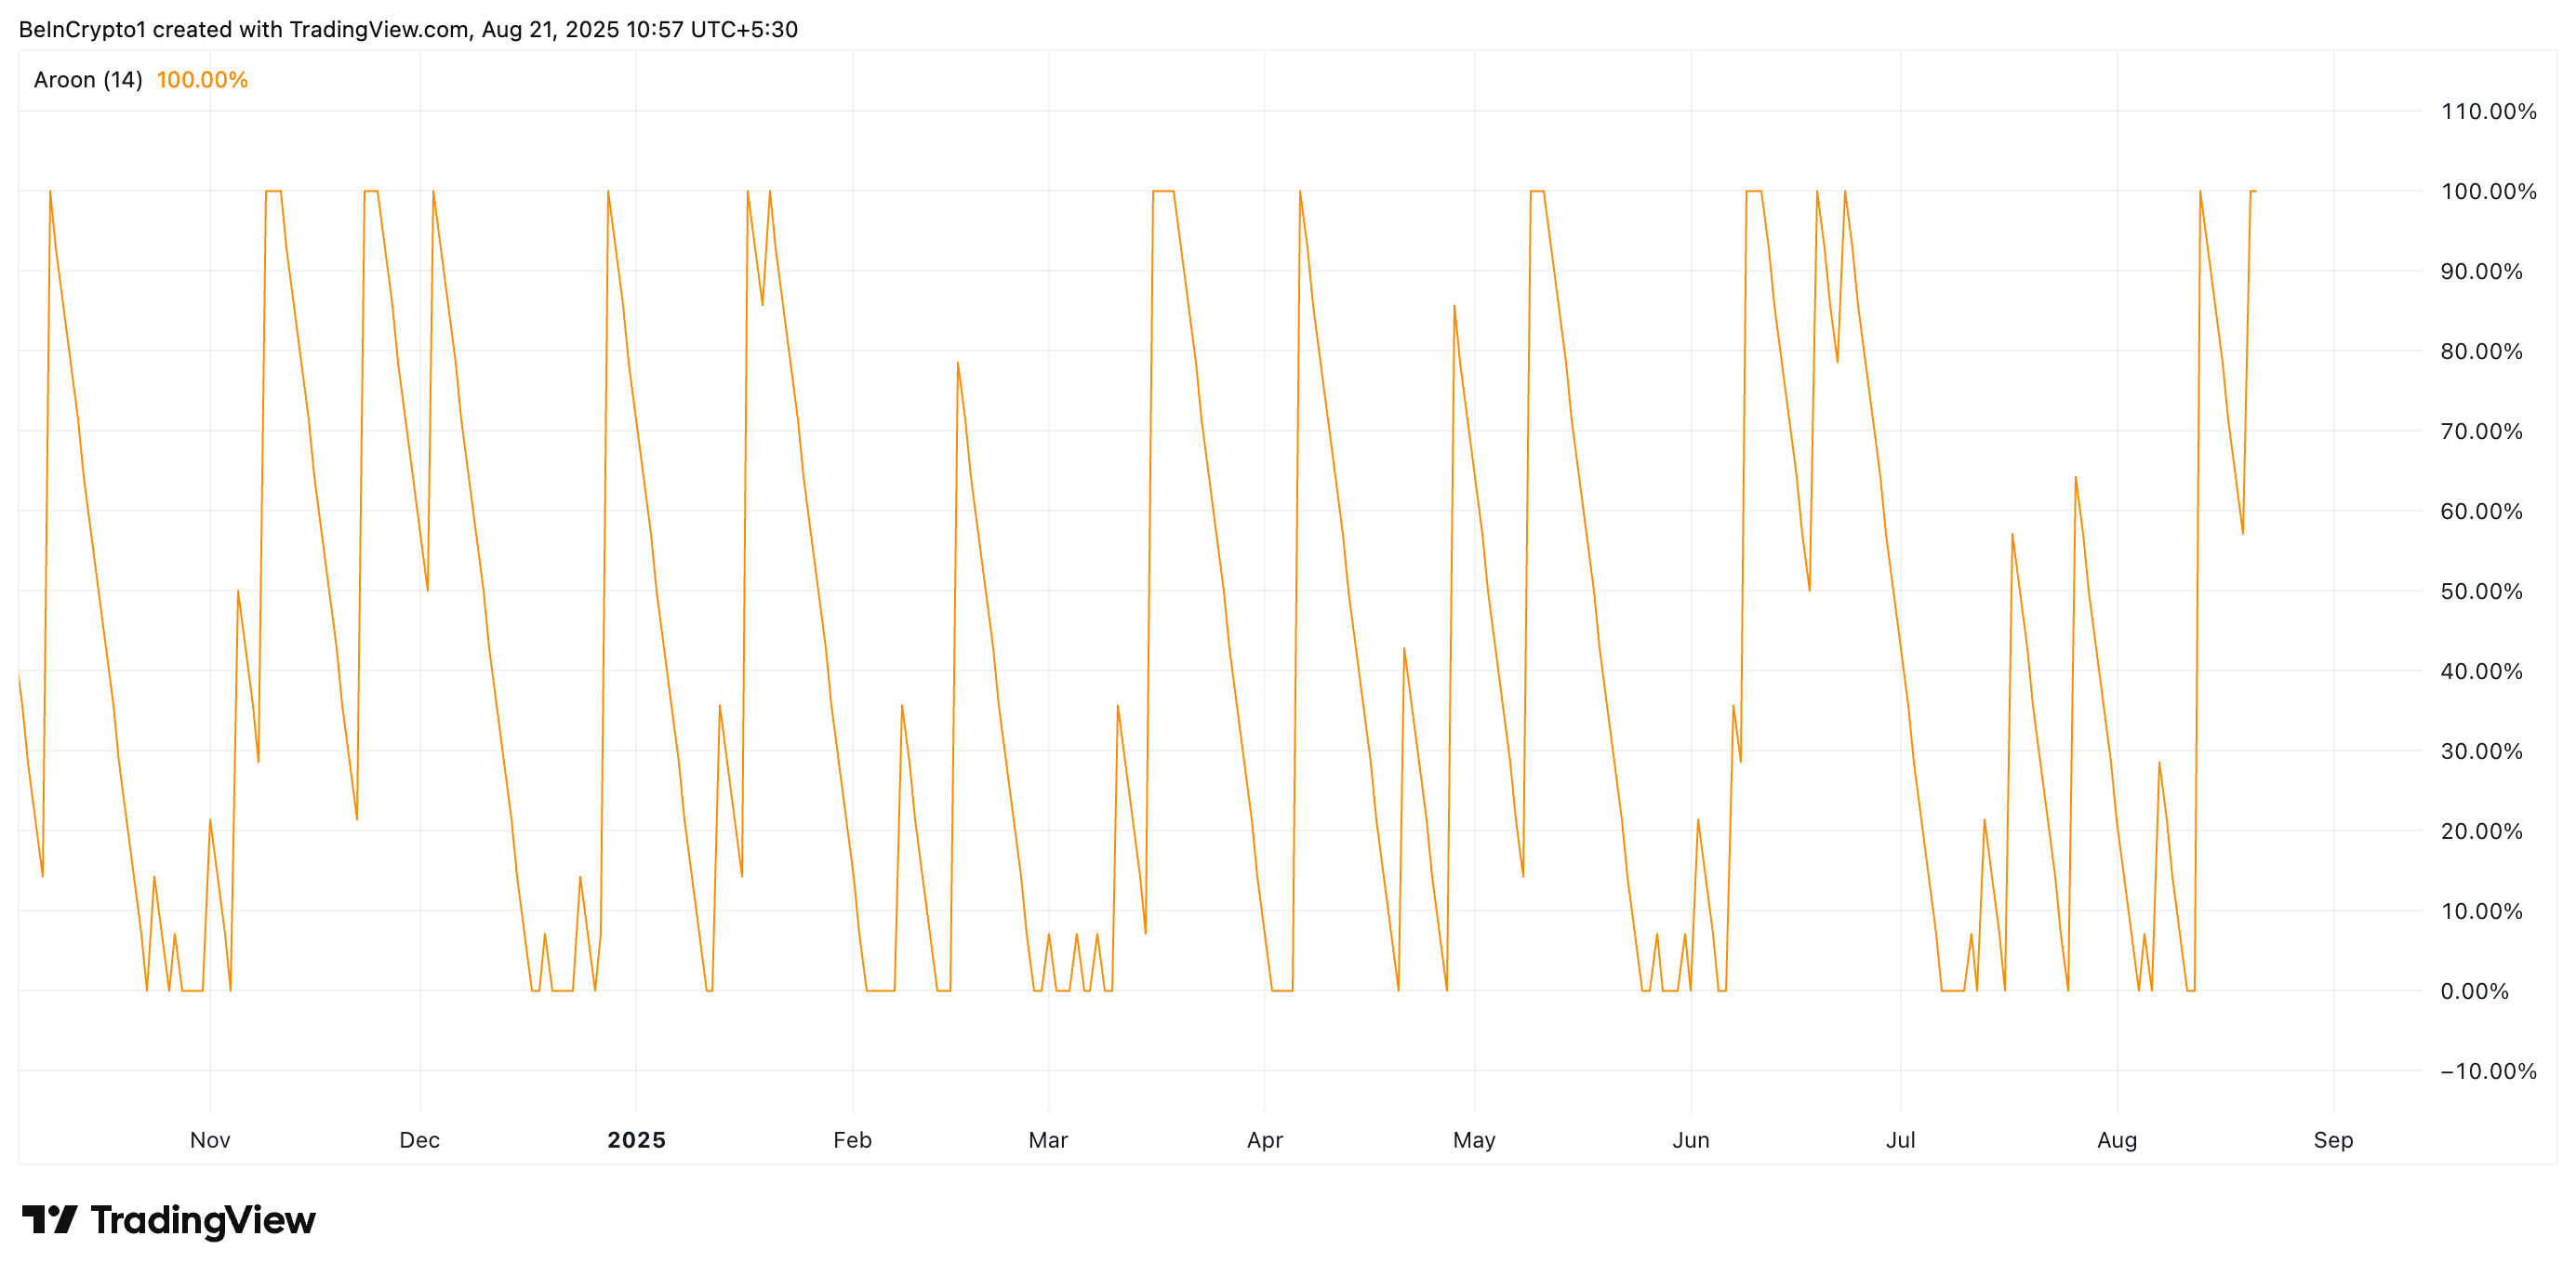
An asset’s Aroon Indicator measures the strength and direction of a trend by tracking the time since the highest and lowest prices over a given period. It comprises two lines: Aroon Up, which measures bullish activity, and Aroon Down, which tracks bearish pressure.
As with OKB, when the Aroon Up line is 100%, the asset has recently hit a new high, signaling a dominant bullish trend. It suggests that buying pressure is high, and the token’s price may continue rising.
Further, OKB’s Chaikin Money FLOW (CMF) sits atop the zero line and is trending higher at press time, confirming the liquidity inflow. The key momentum indicator, which measures how money flows into and out of the market, currently sits at a three-month high of 0.24.
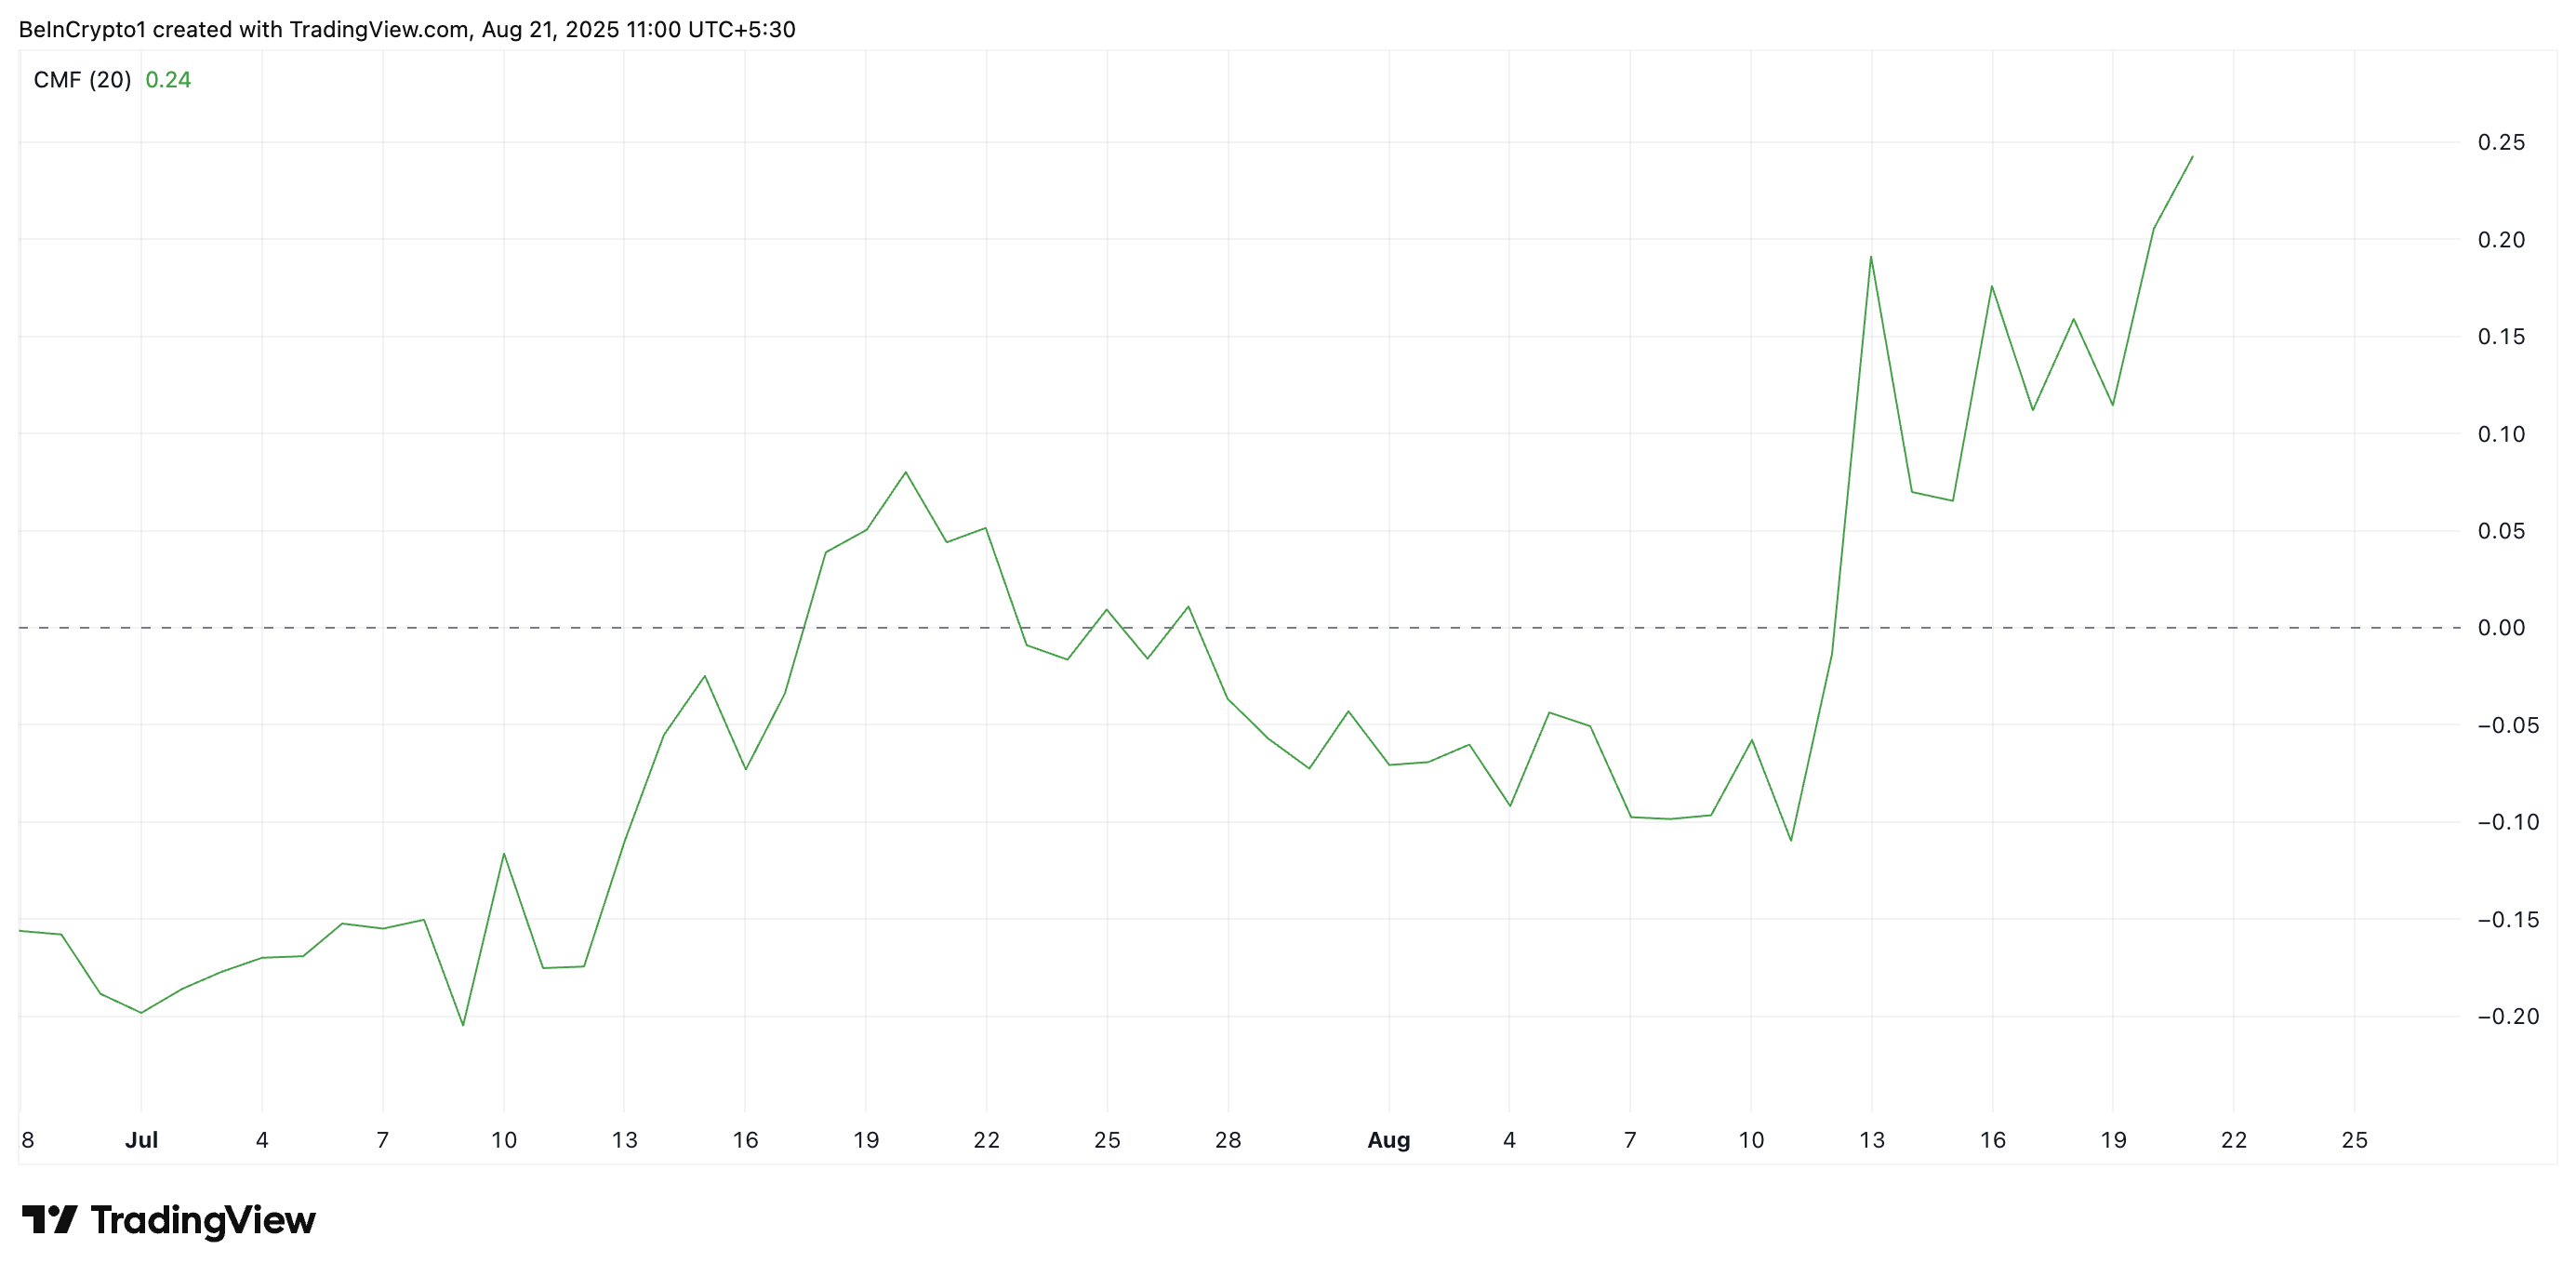
The positive CMF reading signals strong buying pressure and consistent capital inflows. It means OKB holders are accumulating the altcoin and pushing for newer price gains.
OKB Climbs Toward ATH, But Overbought Signals Flash Red
A combined reading of these key indicators suggests OKB’s price may have further room to run. If demand persists, OKB could retest its all-time high and attempt to push past it.
However, caution is advised. The token’s Relative Strength Index (RSI) shows the asset is currently in overbought territory, signaling the risk of a short-term correction if buyer exhaustion sets in. At press time, this sits at 92.66.
The RSI indicator measures an asset’s overbought and oversold market conditions. It ranges between 0 and 100. Values above 70 suggest that the asset is overbought and due for a price decline, while values under 30 indicate that the asset is oversold and may witness a rebound.
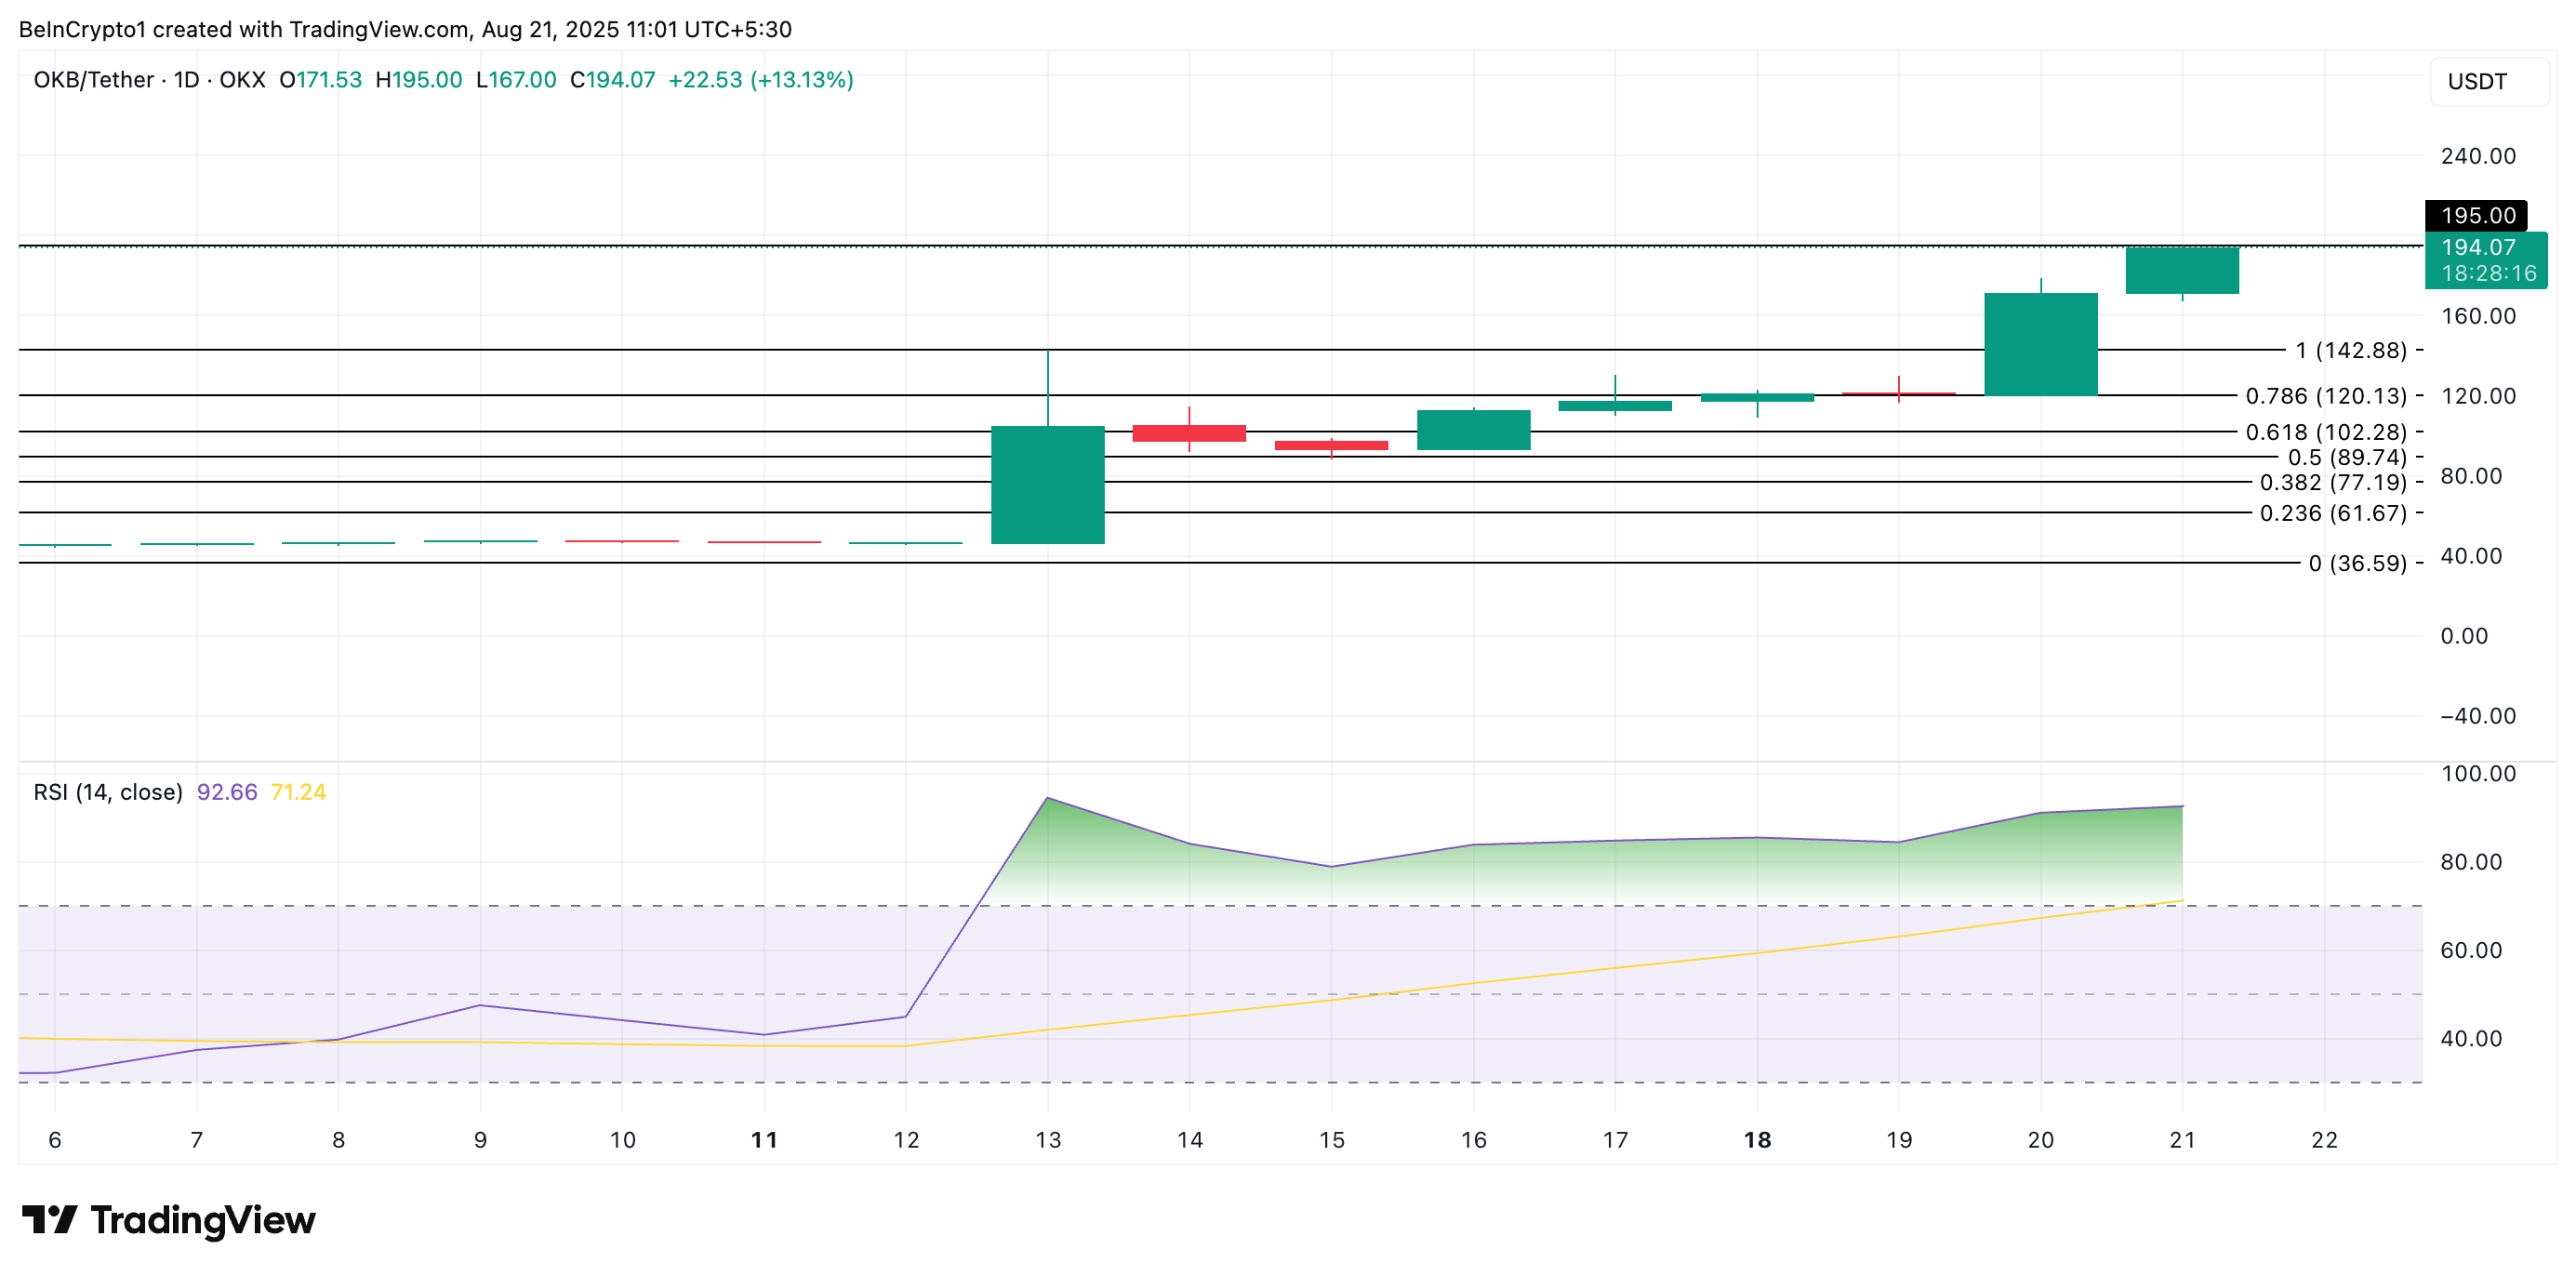
At 92.66, OKB’s RSI confirms that a potential correction is likely in the NEAR term. If that happens, the altcoin’s price could fall toward $142.88.
