Stellar (XLM) Bears Tighten Grip as $0.50 Resistance Holds Firm - What’s Next for the Struggling Asset?

Stellar's bulls just can't catch a break—XLM continues getting hammered as bearish momentum builds. That elusive $0.50 level might as well be on another planet given current market sentiment.
The Resistance Wall
Sellers keep stacking pressure, creating a brutal ceiling that's turning into XLM's personal nightmare. Every attempted rally gets smacked down faster than a rookie trader's first leverage position.
Market Realities Bite
While traditional finance types pat themselves on the back for 'predicting' crypto volatility, XLM's struggle highlights the brutal efficiency of decentralized markets—no government bailouts coming for this one. The asset either finds support soon or risks testing lower lows that'll make current levels look nostalgic.
Sometimes the market doesn't need complicated analysis—it just needs to remind everyone who's really in charge.
XLM Bears Push Price Deeper Below Key Levels
On a daily chart, XLM’s double-digit dip has pushed its price below the 20-day exponential moving average (EMA). The 20-day EMA now forms dynamic resistance above the token’s price at $0.4187, increasing the market’s downward pressure.
: Want more token insights like this? Sign up for Editor Harsh Notariya’s Daily crypto Newsletter here.
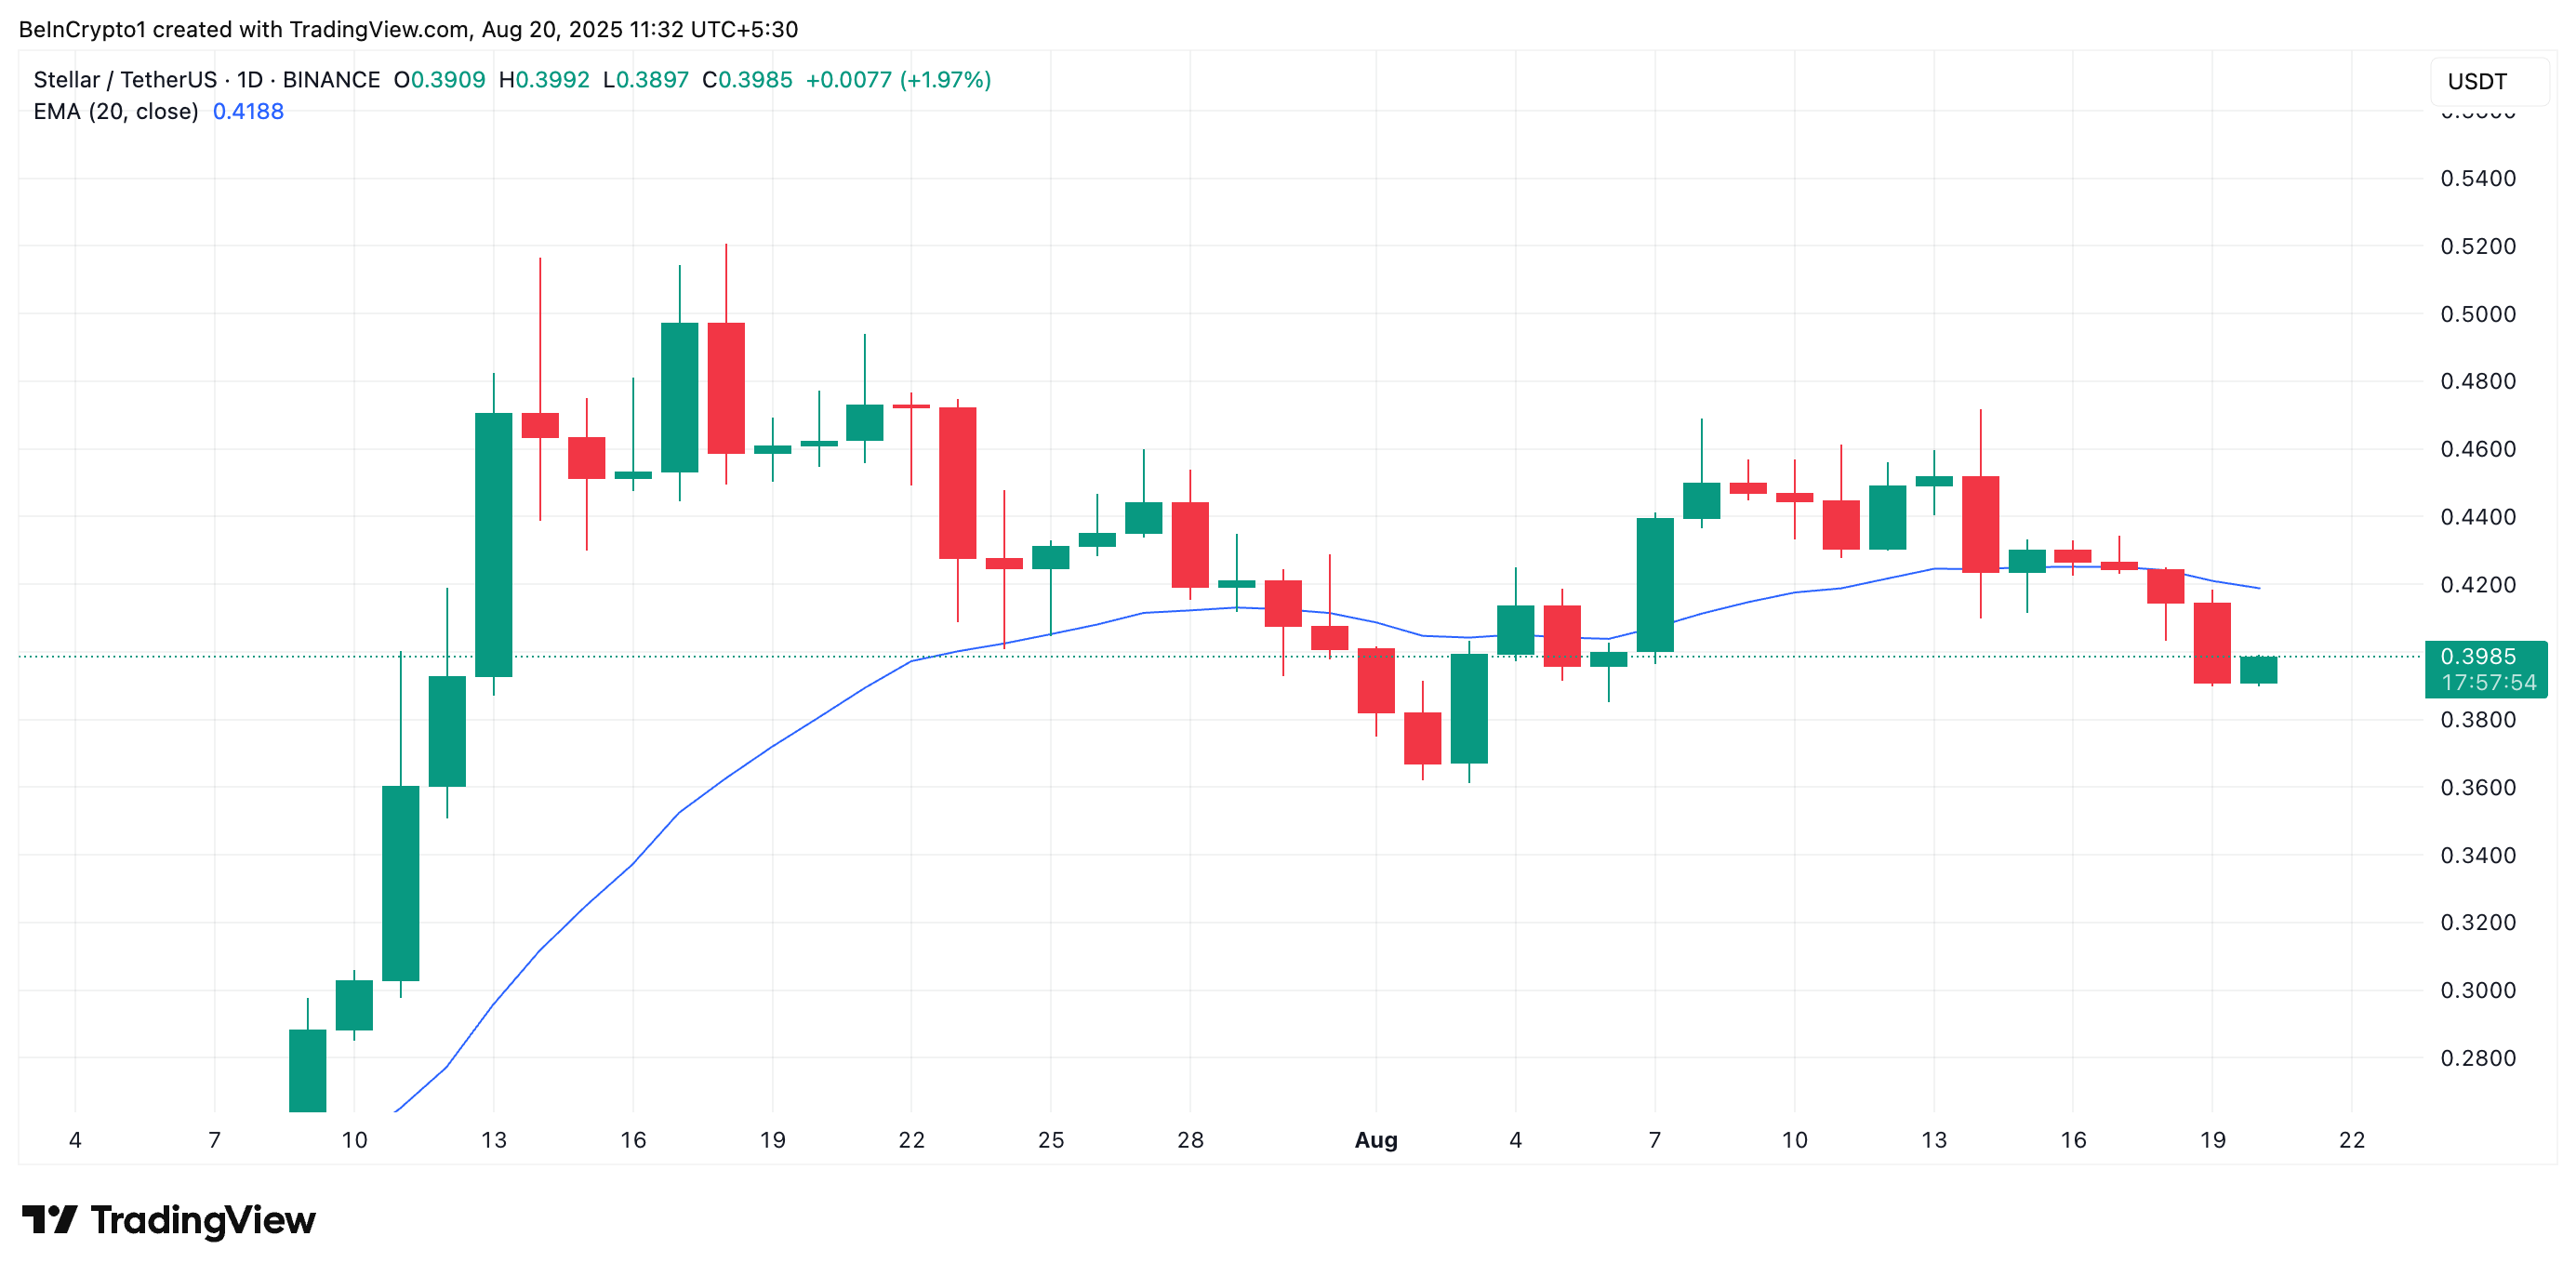
The 20-day EMA measures an asset’s average price over the past 20 trading days, giving weight to recent prices. When price trades above the 20-day EMA, it signals short-term bullish momentum and suggests buyers are in control.
On the other hand, when an asset’s price falls under this level, the market experiences increased sell-side pressure and weakening short-term support. This puts XLM at risk of falling further over the next few days.
Further, XLM’s price has broken below the Leading Span A of its Ichimoku Cloud and is trending lower towards the Leading Span B, confirming the weakening accumulation.
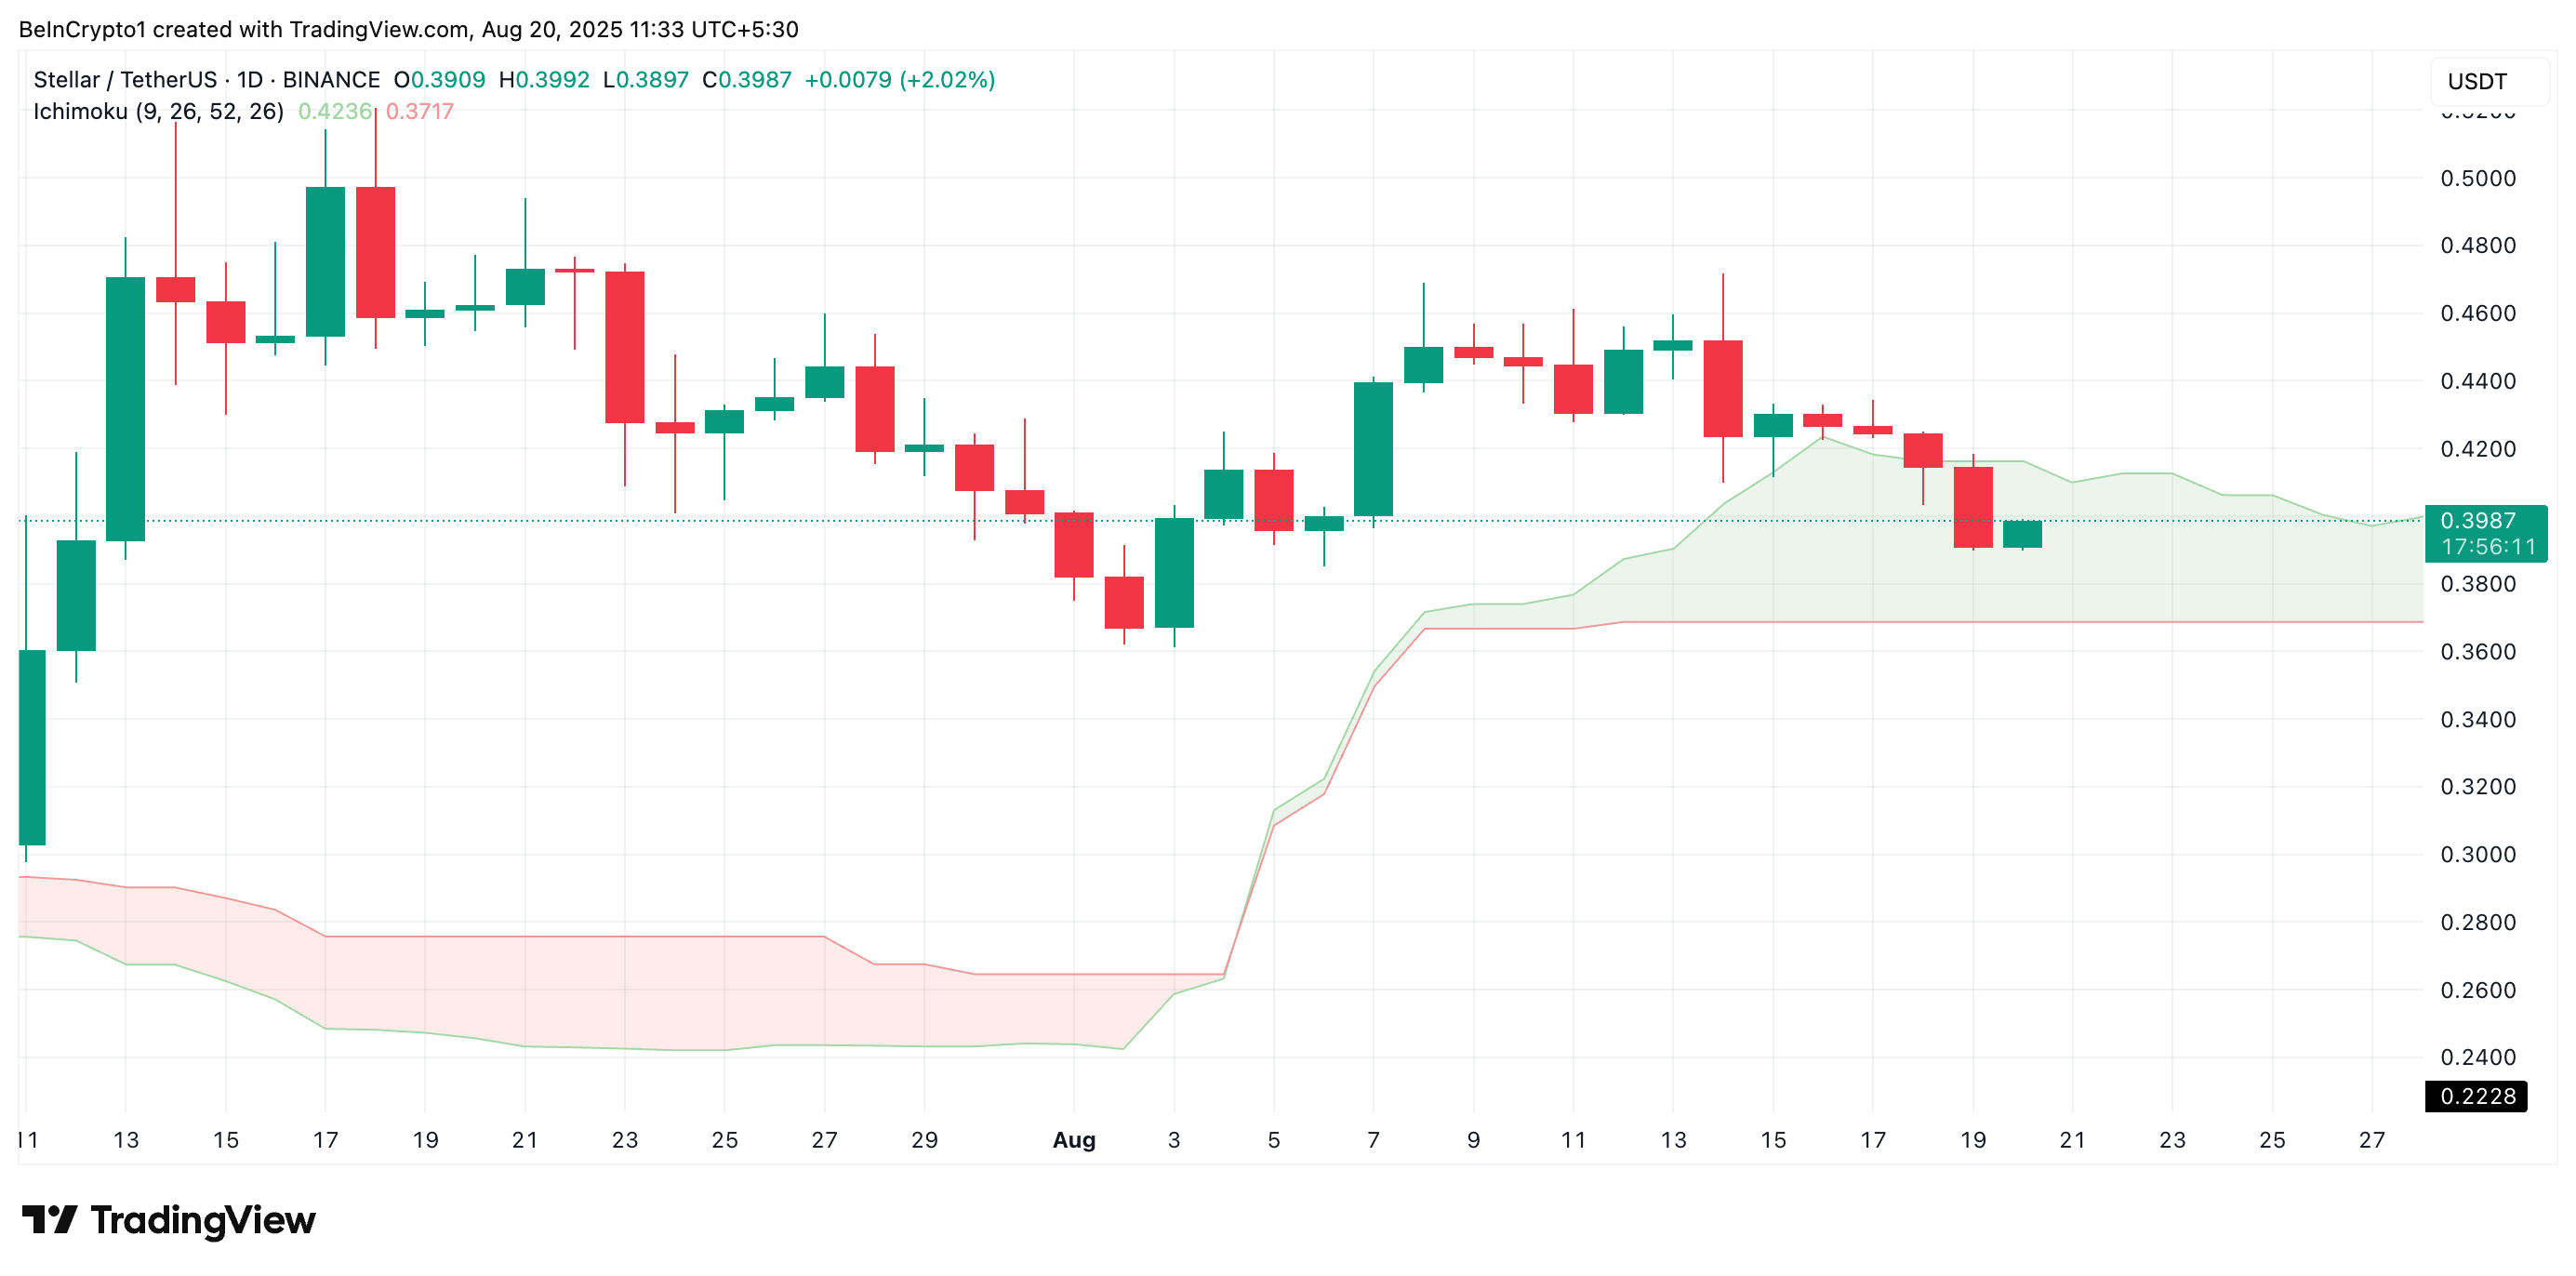
The Ichimoku Cloud tracks the momentum of an asset’s market trends and identifies potential support/resistance levels.
When an asset’s price falls beneath the Leading Span A of this indicator, it signals that bearish forces are gaining strength. A subsequent MOVE toward the Leading Span B raises the likelihood of a deeper downside.
Therefore, this trend suggests that XLM’s bearish trajectory could persist unless it manages a decisive rebound above the cloud.
XLM Slides Deeper Into Bear Territory
These indicators highlight a market environment where XLM buyers are increasingly sidelined, giving sellers the upper hand. Unless bulls reclaim control above the Cloud, the altcoin will likely remain in a decline.
In this case, its price could fall toward $0.3717, where the Leading Span B still forms dynamic support. If this level fails to hold, XLM’s value could drop to $0.3620.
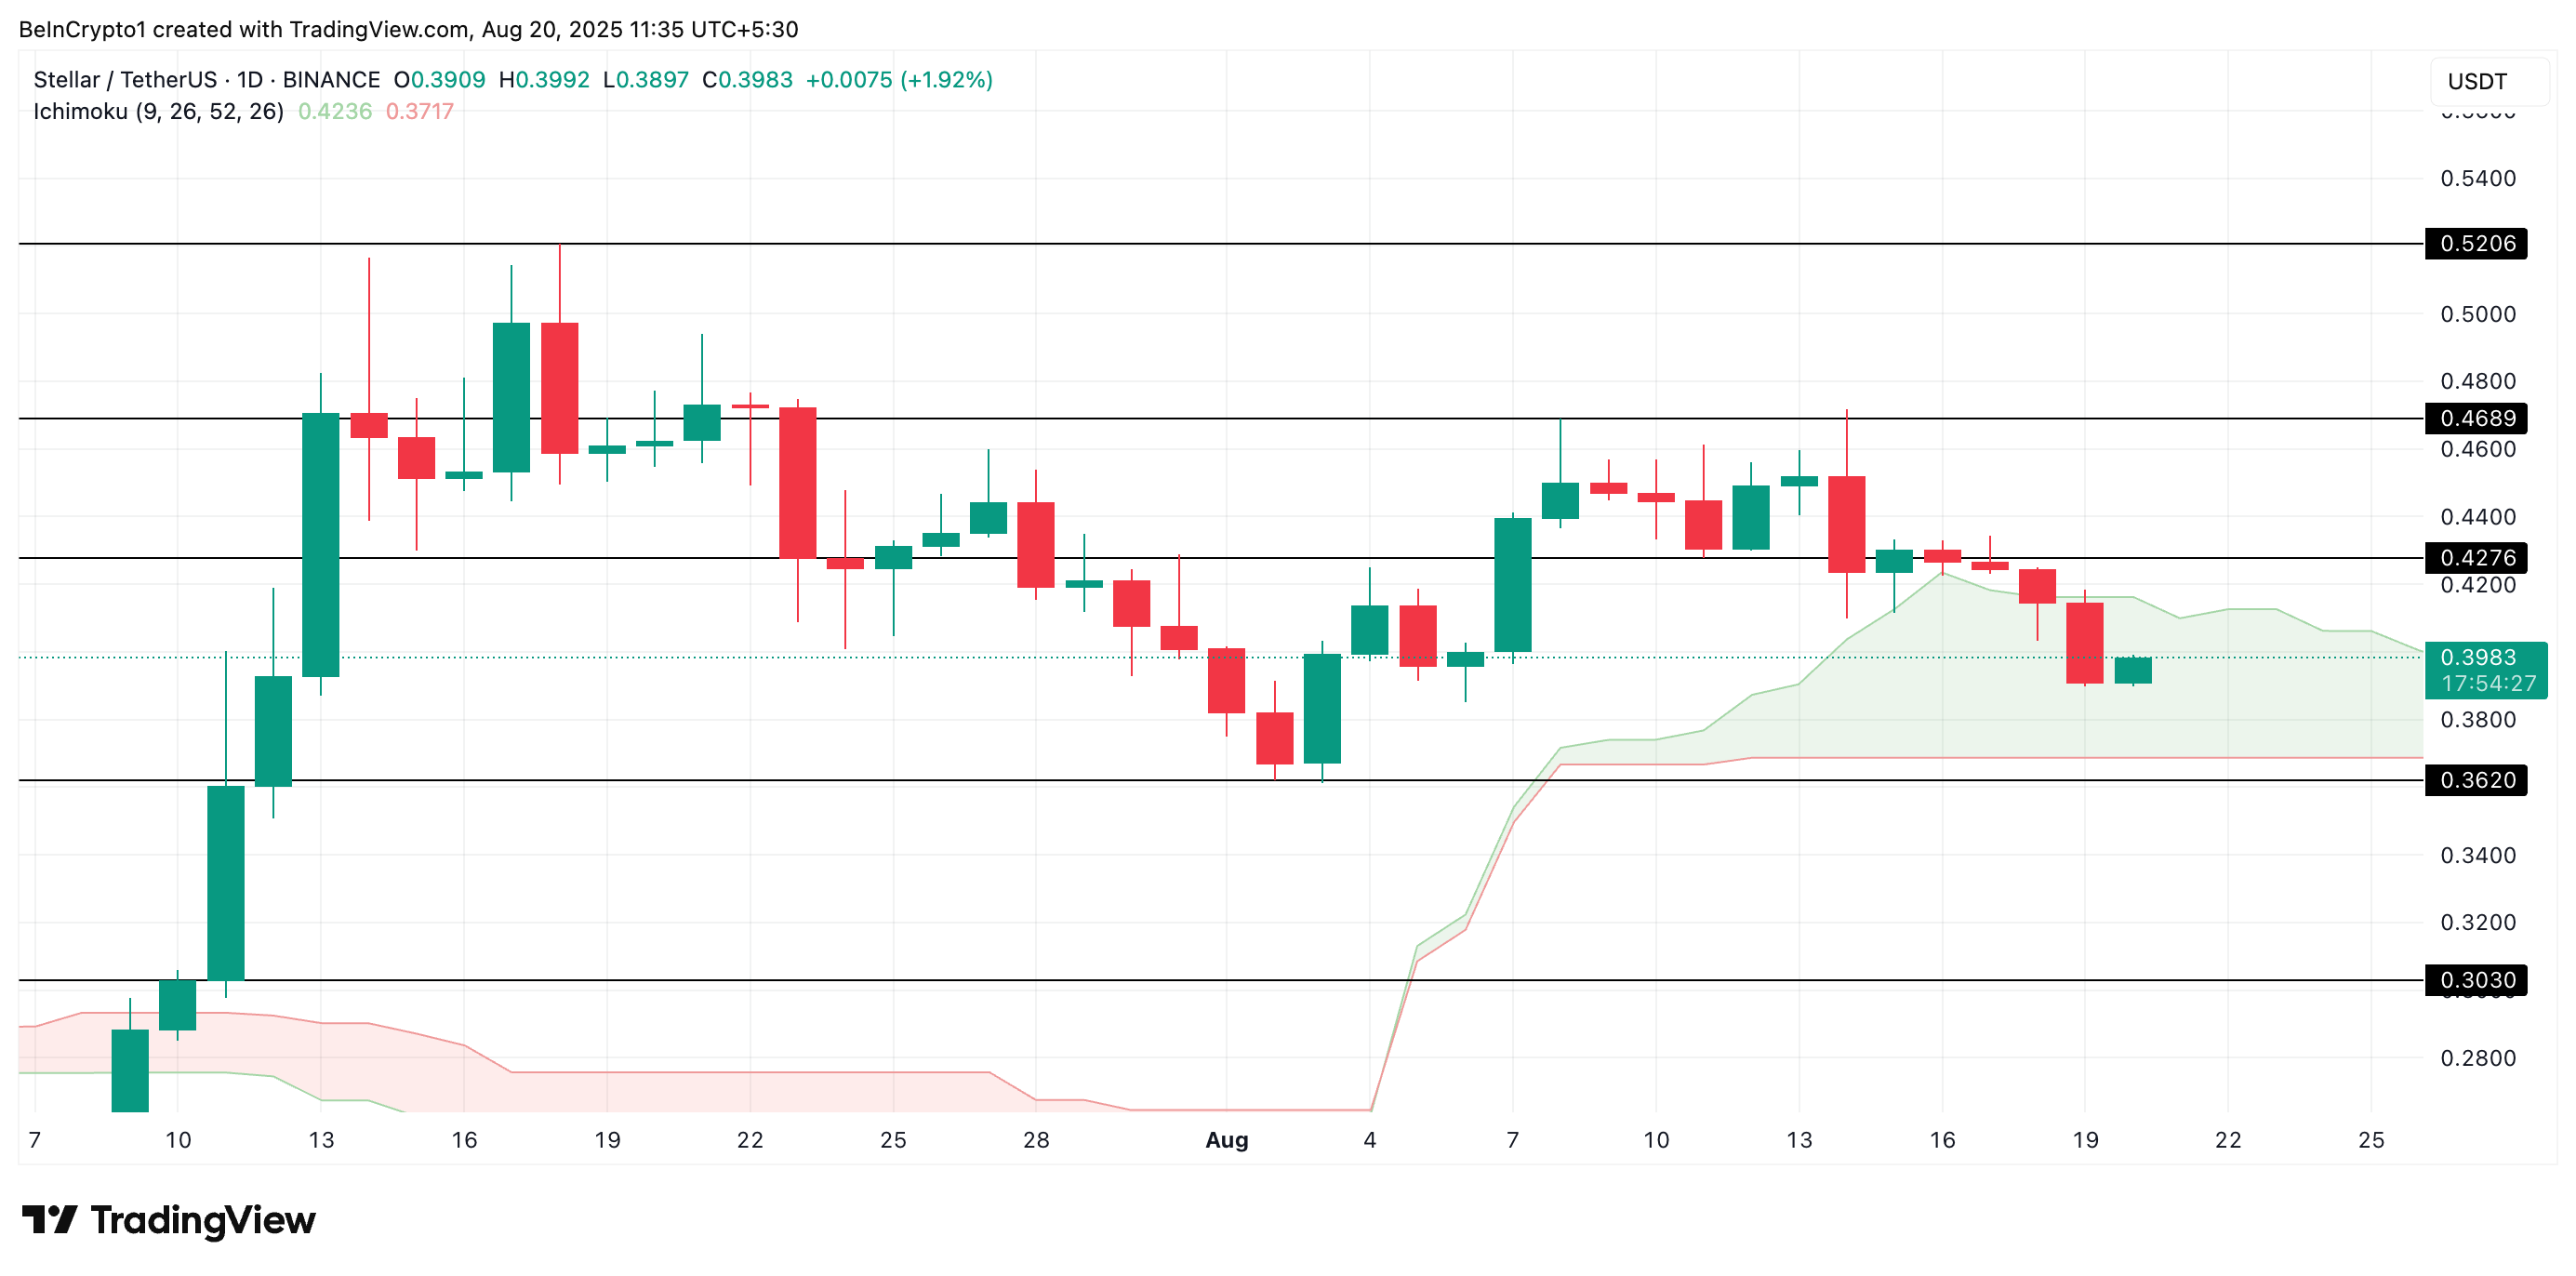
On the other hand, the token’s price could regain and climb above the Leading Span B at $0.4236 if the bulls regain control.
