XLM’s Bleak Price Forecast Holds One Unexpected Shot at Revival
Stellar's native token faces brutal headwinds—but one catalyst could defy the bears.
The Setup
XLM trades at a fraction of its former highs, crushed under macro pressure and fading hype. Volume dries up. Sentiment sours. Another altcoin circling the drain? Maybe not.
The Wild Card
Rumors swirl around a major CBDC partnership—yes, the kind bureaucrats love to announce right after denying for months. A real ‘move fast and break regulations’ moment.
Why It (Might) Matter
Institutional adoption remains crypto’s favorite bedtime story, but this one has teeth. Real-world utility beats speculative froth—even if most traders just want a quick pump.
Bottom Line
Don’t count Stellar out yet. Sometimes the darkest charts hide the sharpest reversals. Or, as they say in traditional finance: ‘It’s not a loss until you sell’—the mantra of every bagholder from here to Wall Street.
EMA Crossover Flashes a Clear Warning, Bearish Power Builds
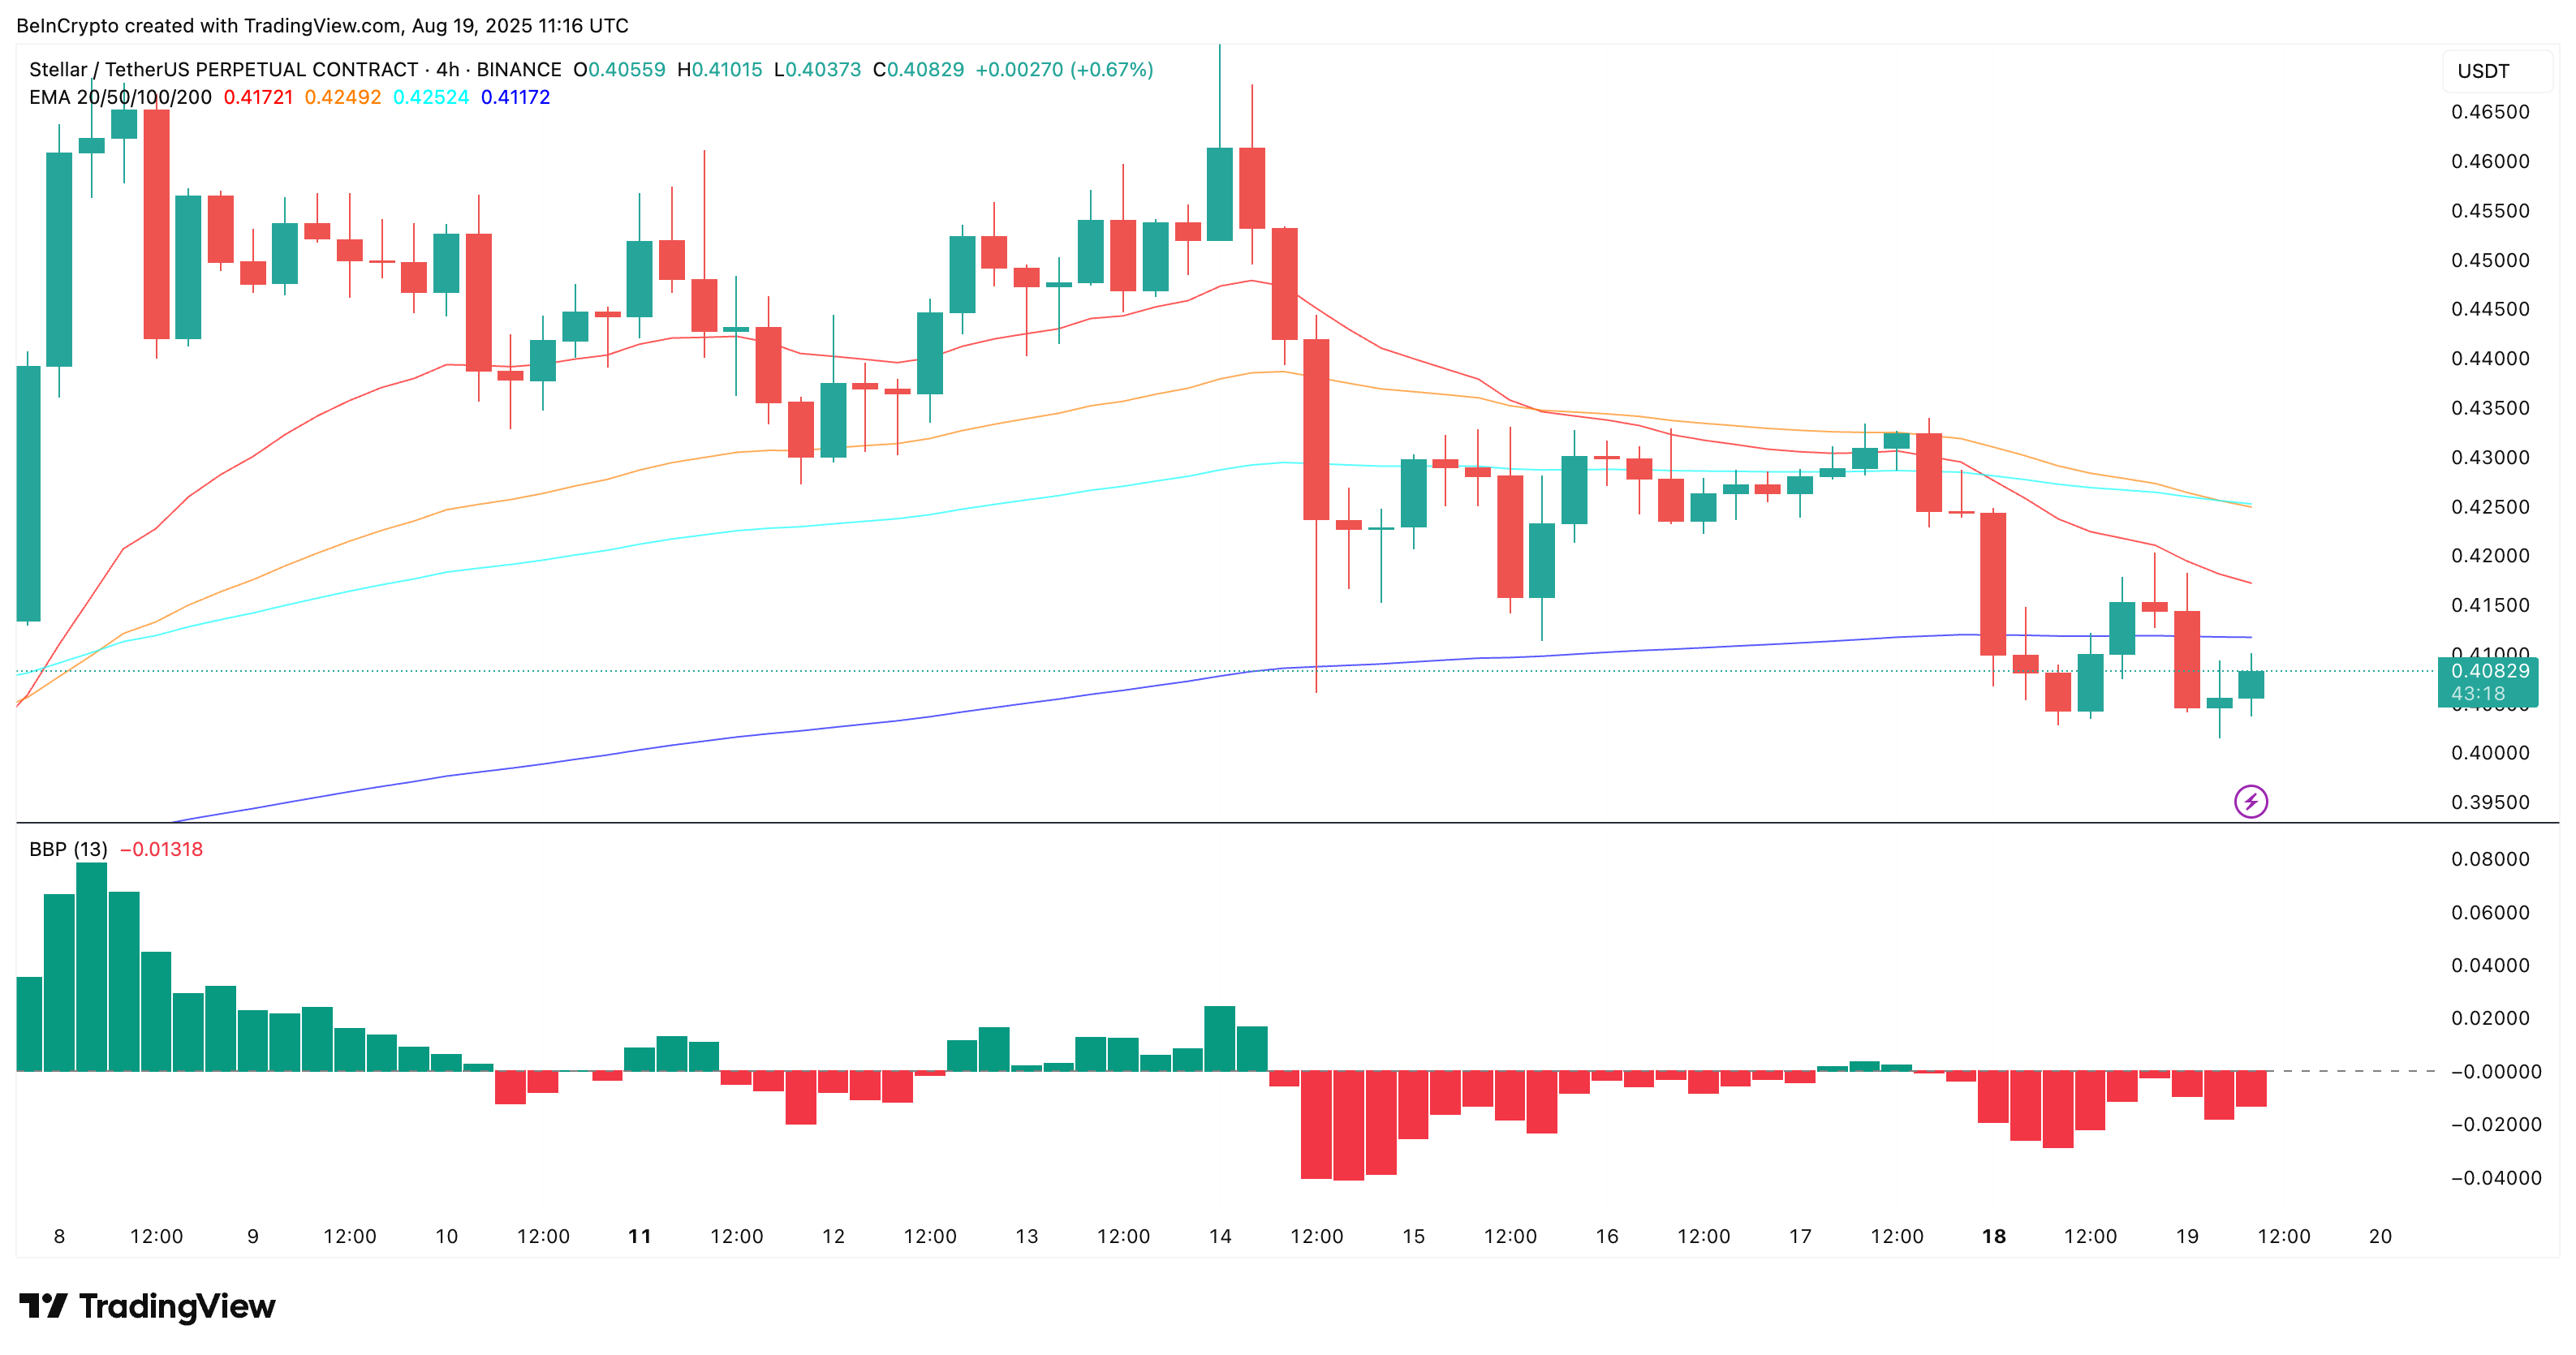
On the 4-hour chart, the XLM price has now fallen below all four EMAs – the 20, 50, 100, and 200-period exponential moving averages. Most notably, a bearish EMA crossover has just formed, where the 50 EMA (orange line) has dropped below the 100 EMA (sky blue line).

This kind of crossover, also termed the “Death Cross,” is infamous for triggering sharp corrections.
An Exponential Moving Average (EMA) gives more weight to recent price data to better capture momentum. When a shorter-term EMA crosses below a longer-term EMA, it’s seen as a bearish signal, suggesting that recent prices are declining faster than longer-term trends.
When shorter-term averages like the 50 EMA dip under longer-term ones like the 100 EMA, it’s often seen as a momentum flip, where buyers lose control and sellers start dominating. But that’s not all.
The same chart also shows DEEP “reds” in the Bull-Bear Power (BBP) indicator. This metric compares recent highs and lows to a trend-following average to gauge buying or selling dominance. XLM’s BBP is now in negative territory, confirming that bears have taken control of the short-term price structure.
So far, the price action shows weakness. But that’s only half the story.
Liquidation Map Shows Shorts Dominating, And That’s the Only Hope
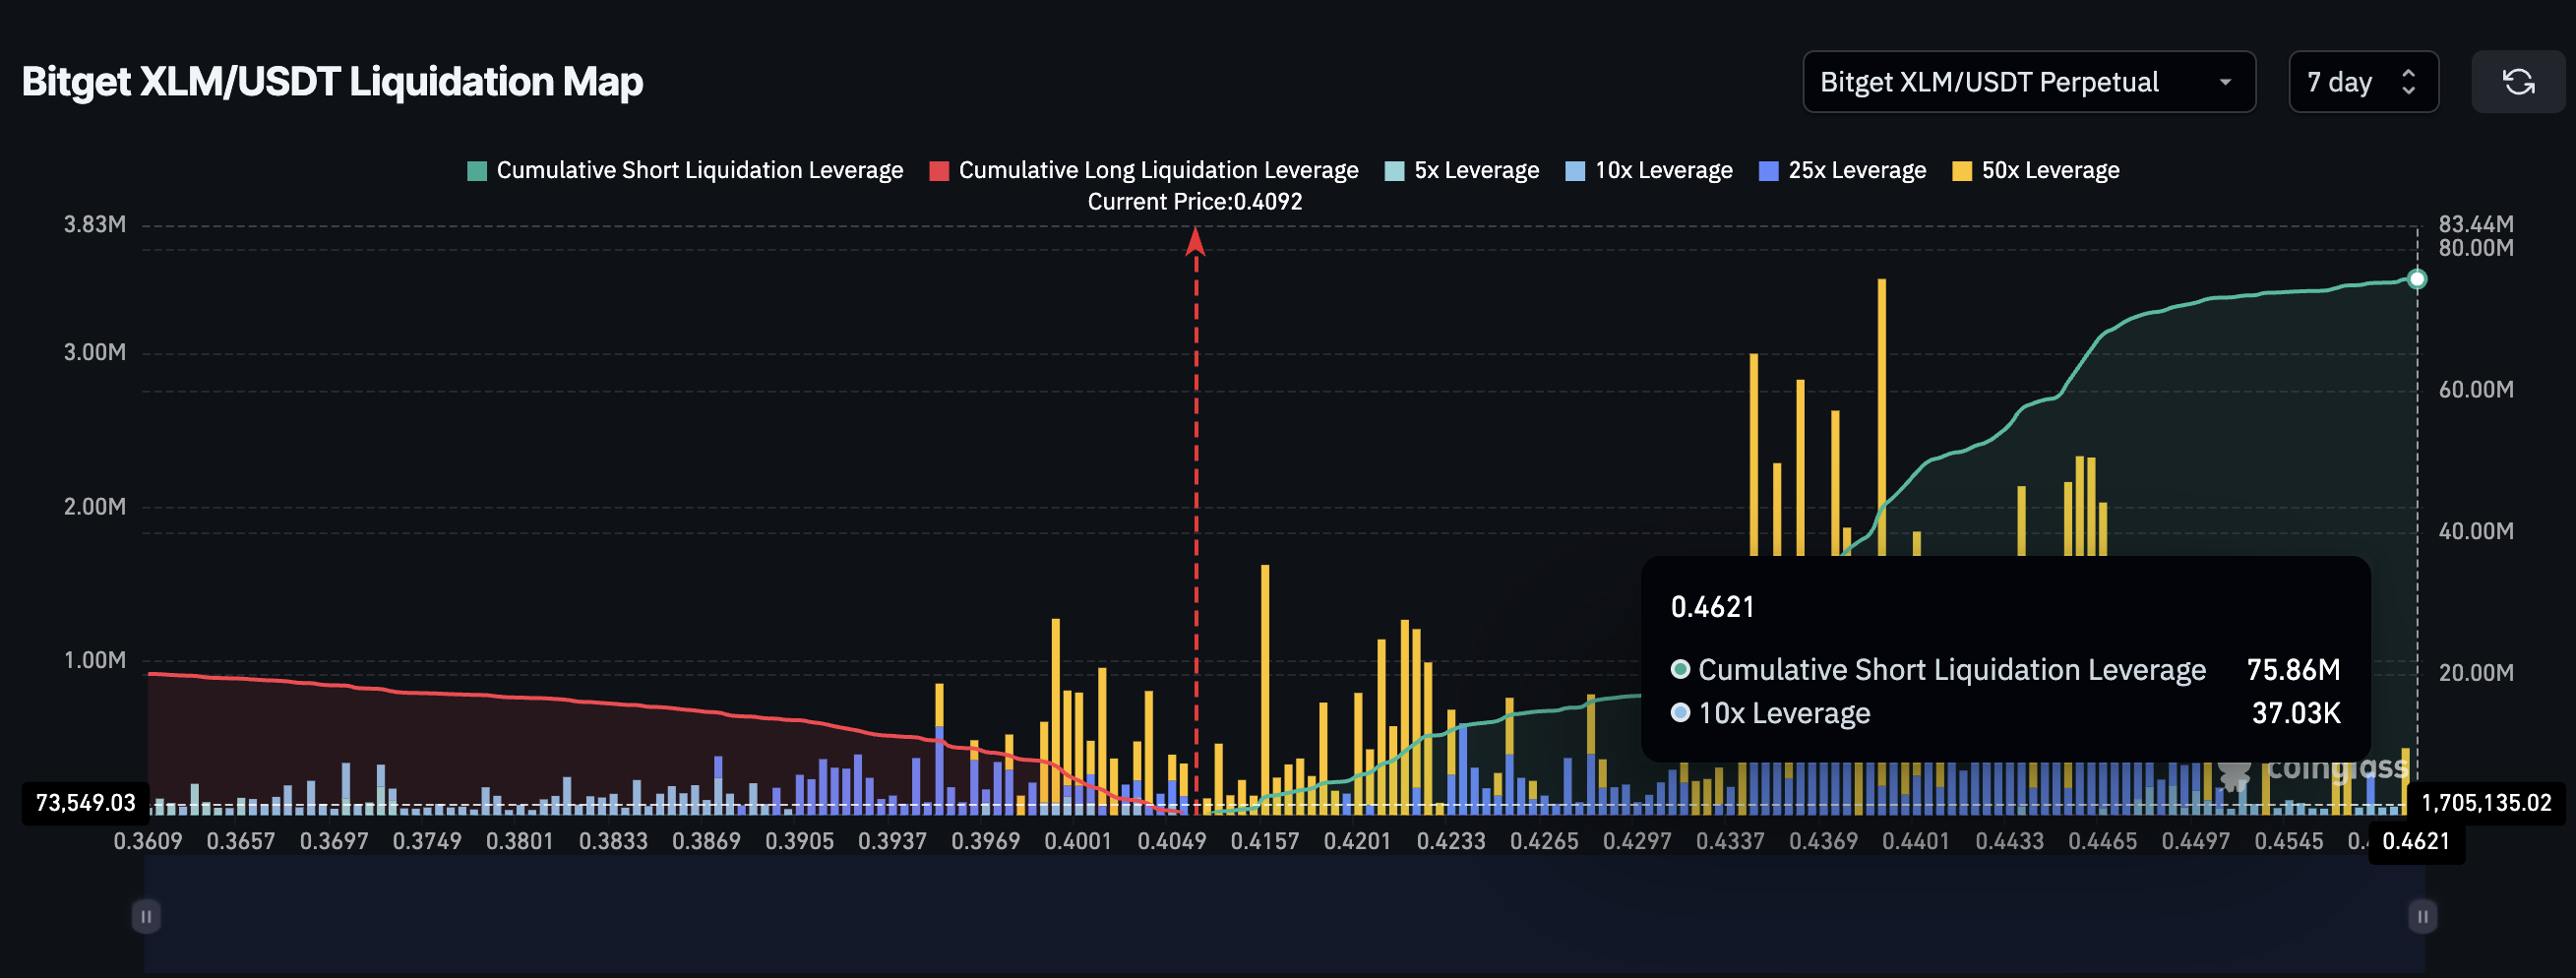
On Bitget, XLM has seen nearly $75.82 million in short liquidations and close to $20 million in long liquidations over the past 7 days — highlighting a heavy bearish bias in trader positioning.
Right now, that’s the only bullish angle in XLM’s setup. If broader market momentum lifts the price even slightly, shorts may begin getting squeezed, causing forced liquidations and pushing prices higher.

A short squeeze happens when too many traders bet on a price drop (open shorts), but instead the price moves up, forcing them to buy back in a hurry. This panic buying drives prices even higher, often suddenly.
XLM Price Pattern Breaks Down, But Critical Levels Remain in Sight
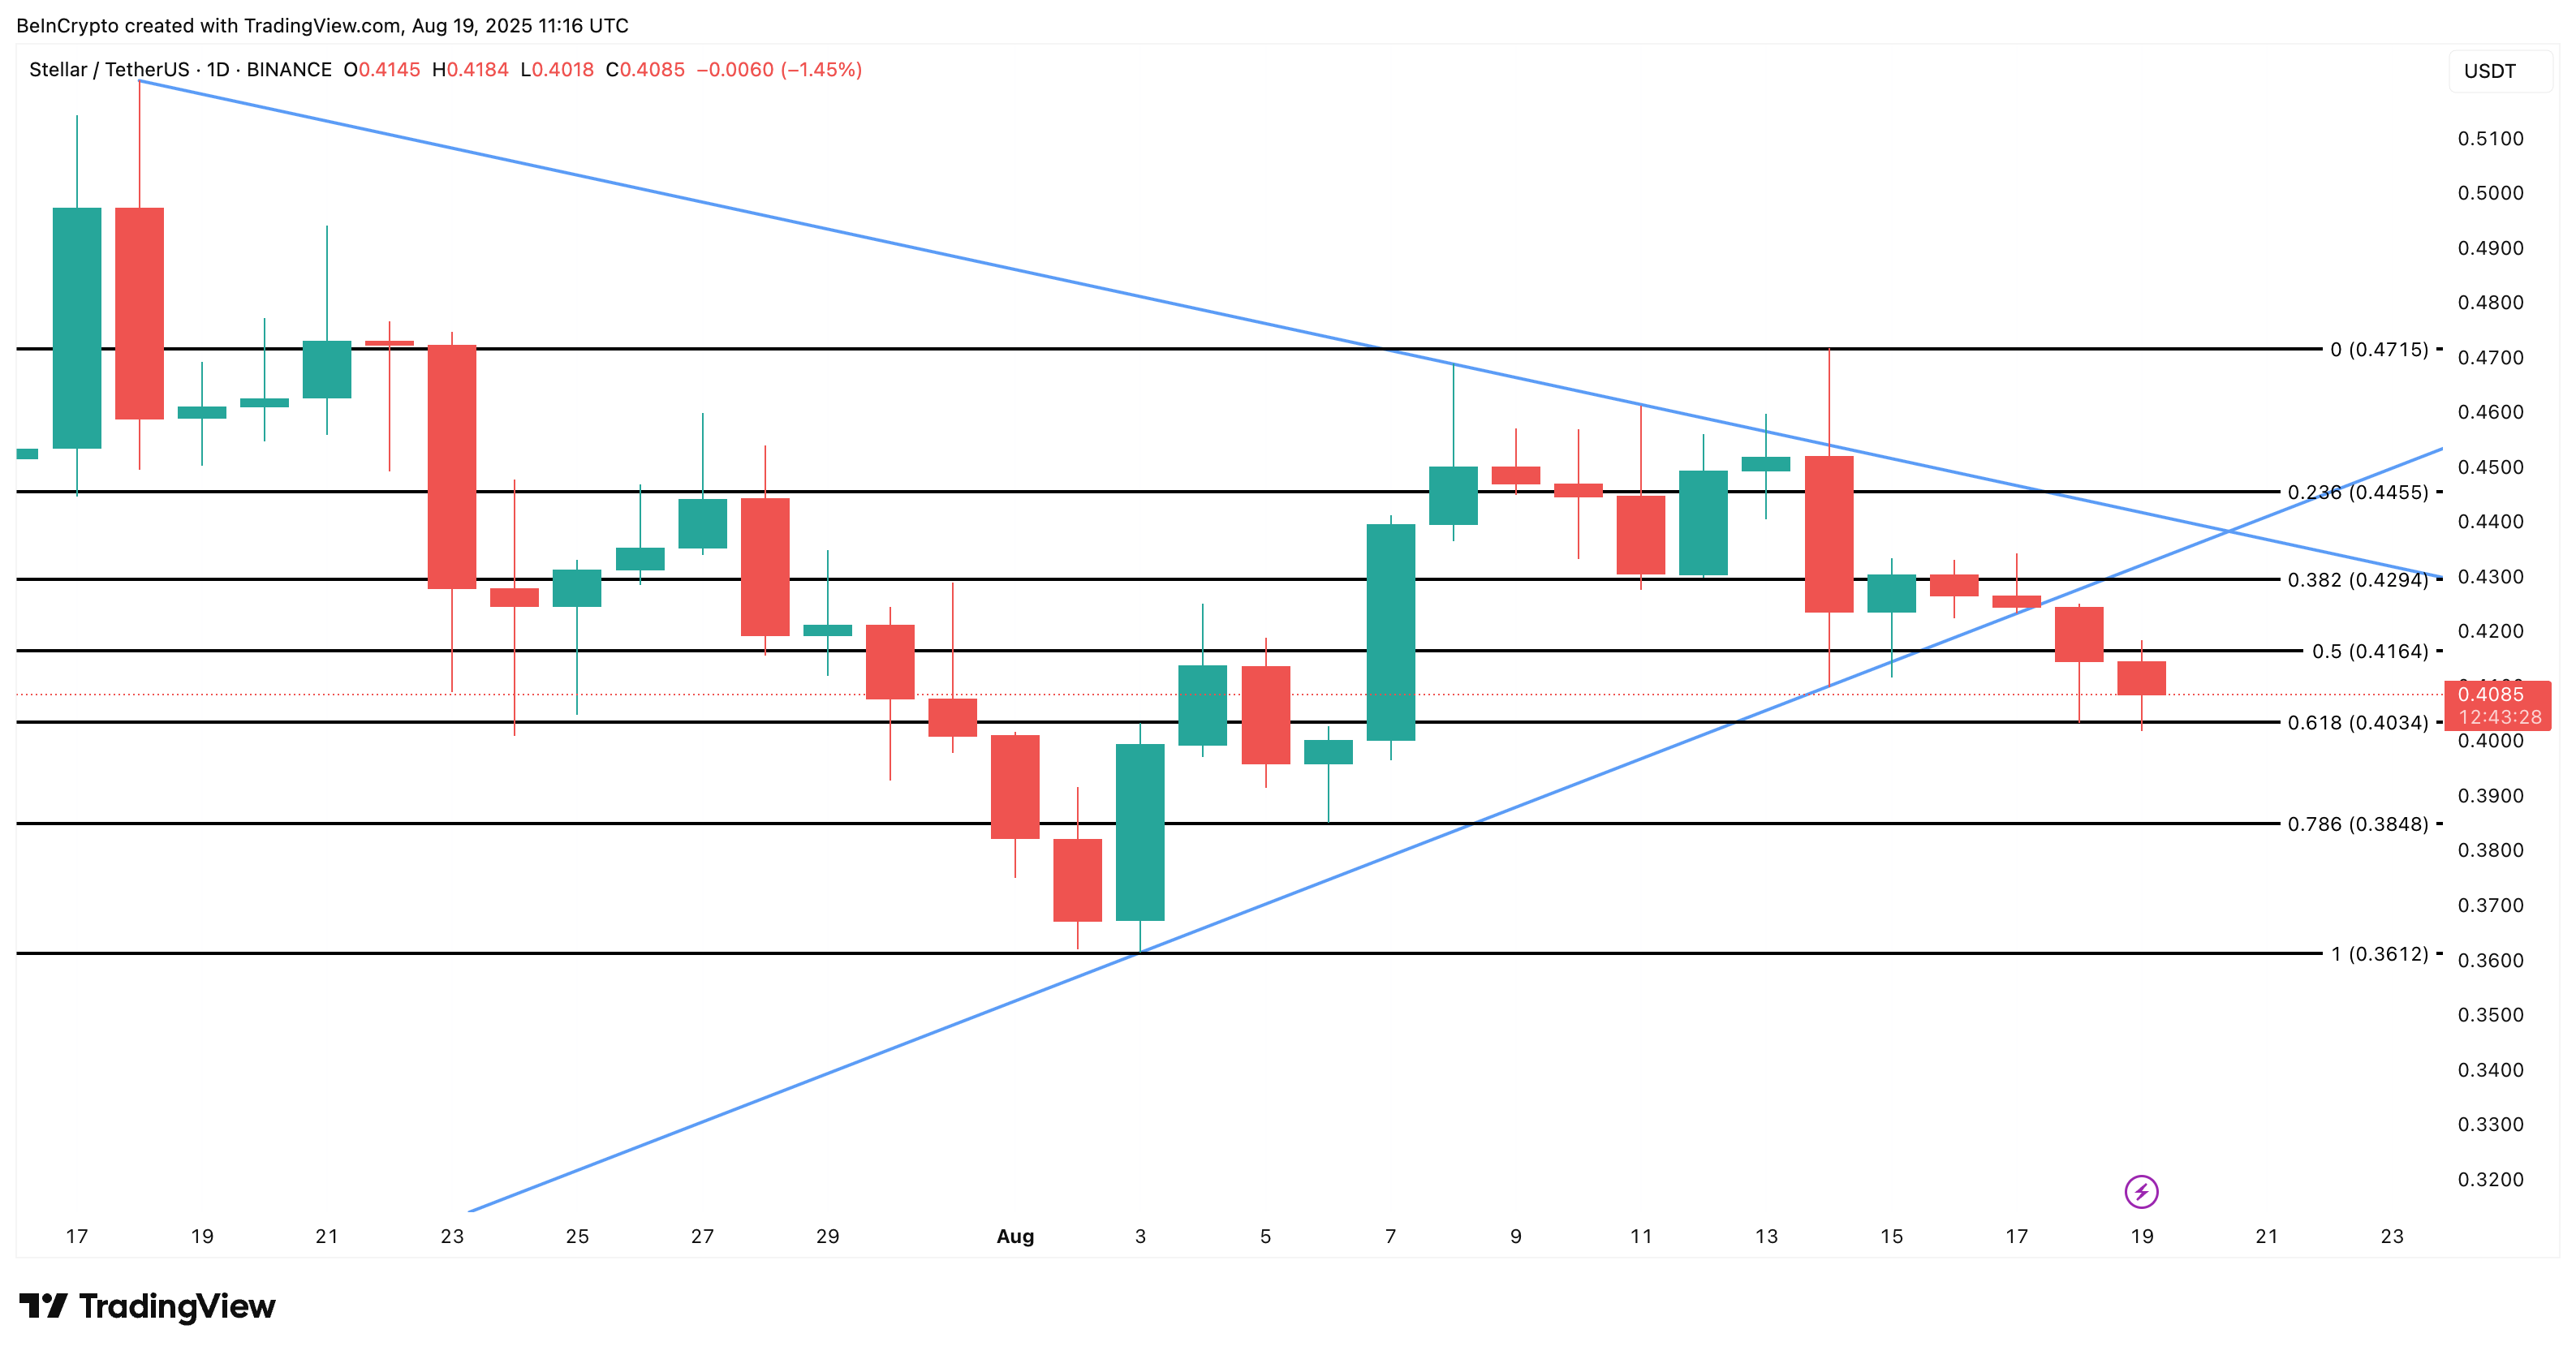
XLM has clearly broken down from its recent pennant formation on the daily chart. The immediate support level now sits at $0.40. If this breaks cleanly, the bearish crossover and BBP pressure could drive a MOVE towards $0.36 in the coming sessions.

However, if a short squeeze does kick in, and XLM manages to reclaim the $0.42 to $0.44 zone, the near-term bearish structure WOULD be invalidated. This would flip short-term sentiment and possibly trigger aggressive buys.
Until that happens, though, the bears remain firmly in control, with only one unusual imbalance offering any reason to hope.

