Solana’s Price Plunge Bottoming Out? 2 Key Metrics Scream Bullish Rebound Ahead

Solana's brutal correction may be running out of steam—on-chain data reveals two telltale signs of accumulation.
The capitulation playbook: Network activity and exchange reserves paint a textbook reversal setup. Whales aren't just buying the dip—they're loading barges.
Liquidity chess: While retail panics, institutional wallets quietly execute the oldest play in crypto: buy when there's blood in the streets (even if that blood is from overleveraged degens).
Market makers smell opportunity—Solana's infrastructure upgrades position it as the high-performance chain du jour. The only question now: Will the rebound outpace Bitcoin's next leg up?
Funny how 'decentralized' markets always seem to bounce when the big boys finish filling their bags.
Big Holders Are Sitting Out the Dip Dump
On August 17, Solana’s Coin Days Destroyed (CDD) metric dropped to 161.79 million, the second-lowest daily value this month. Just a day earlier, on August 16, CDD had peaked at 1.16 billion. That’s an 86% single-day collapse in coin day destruction.
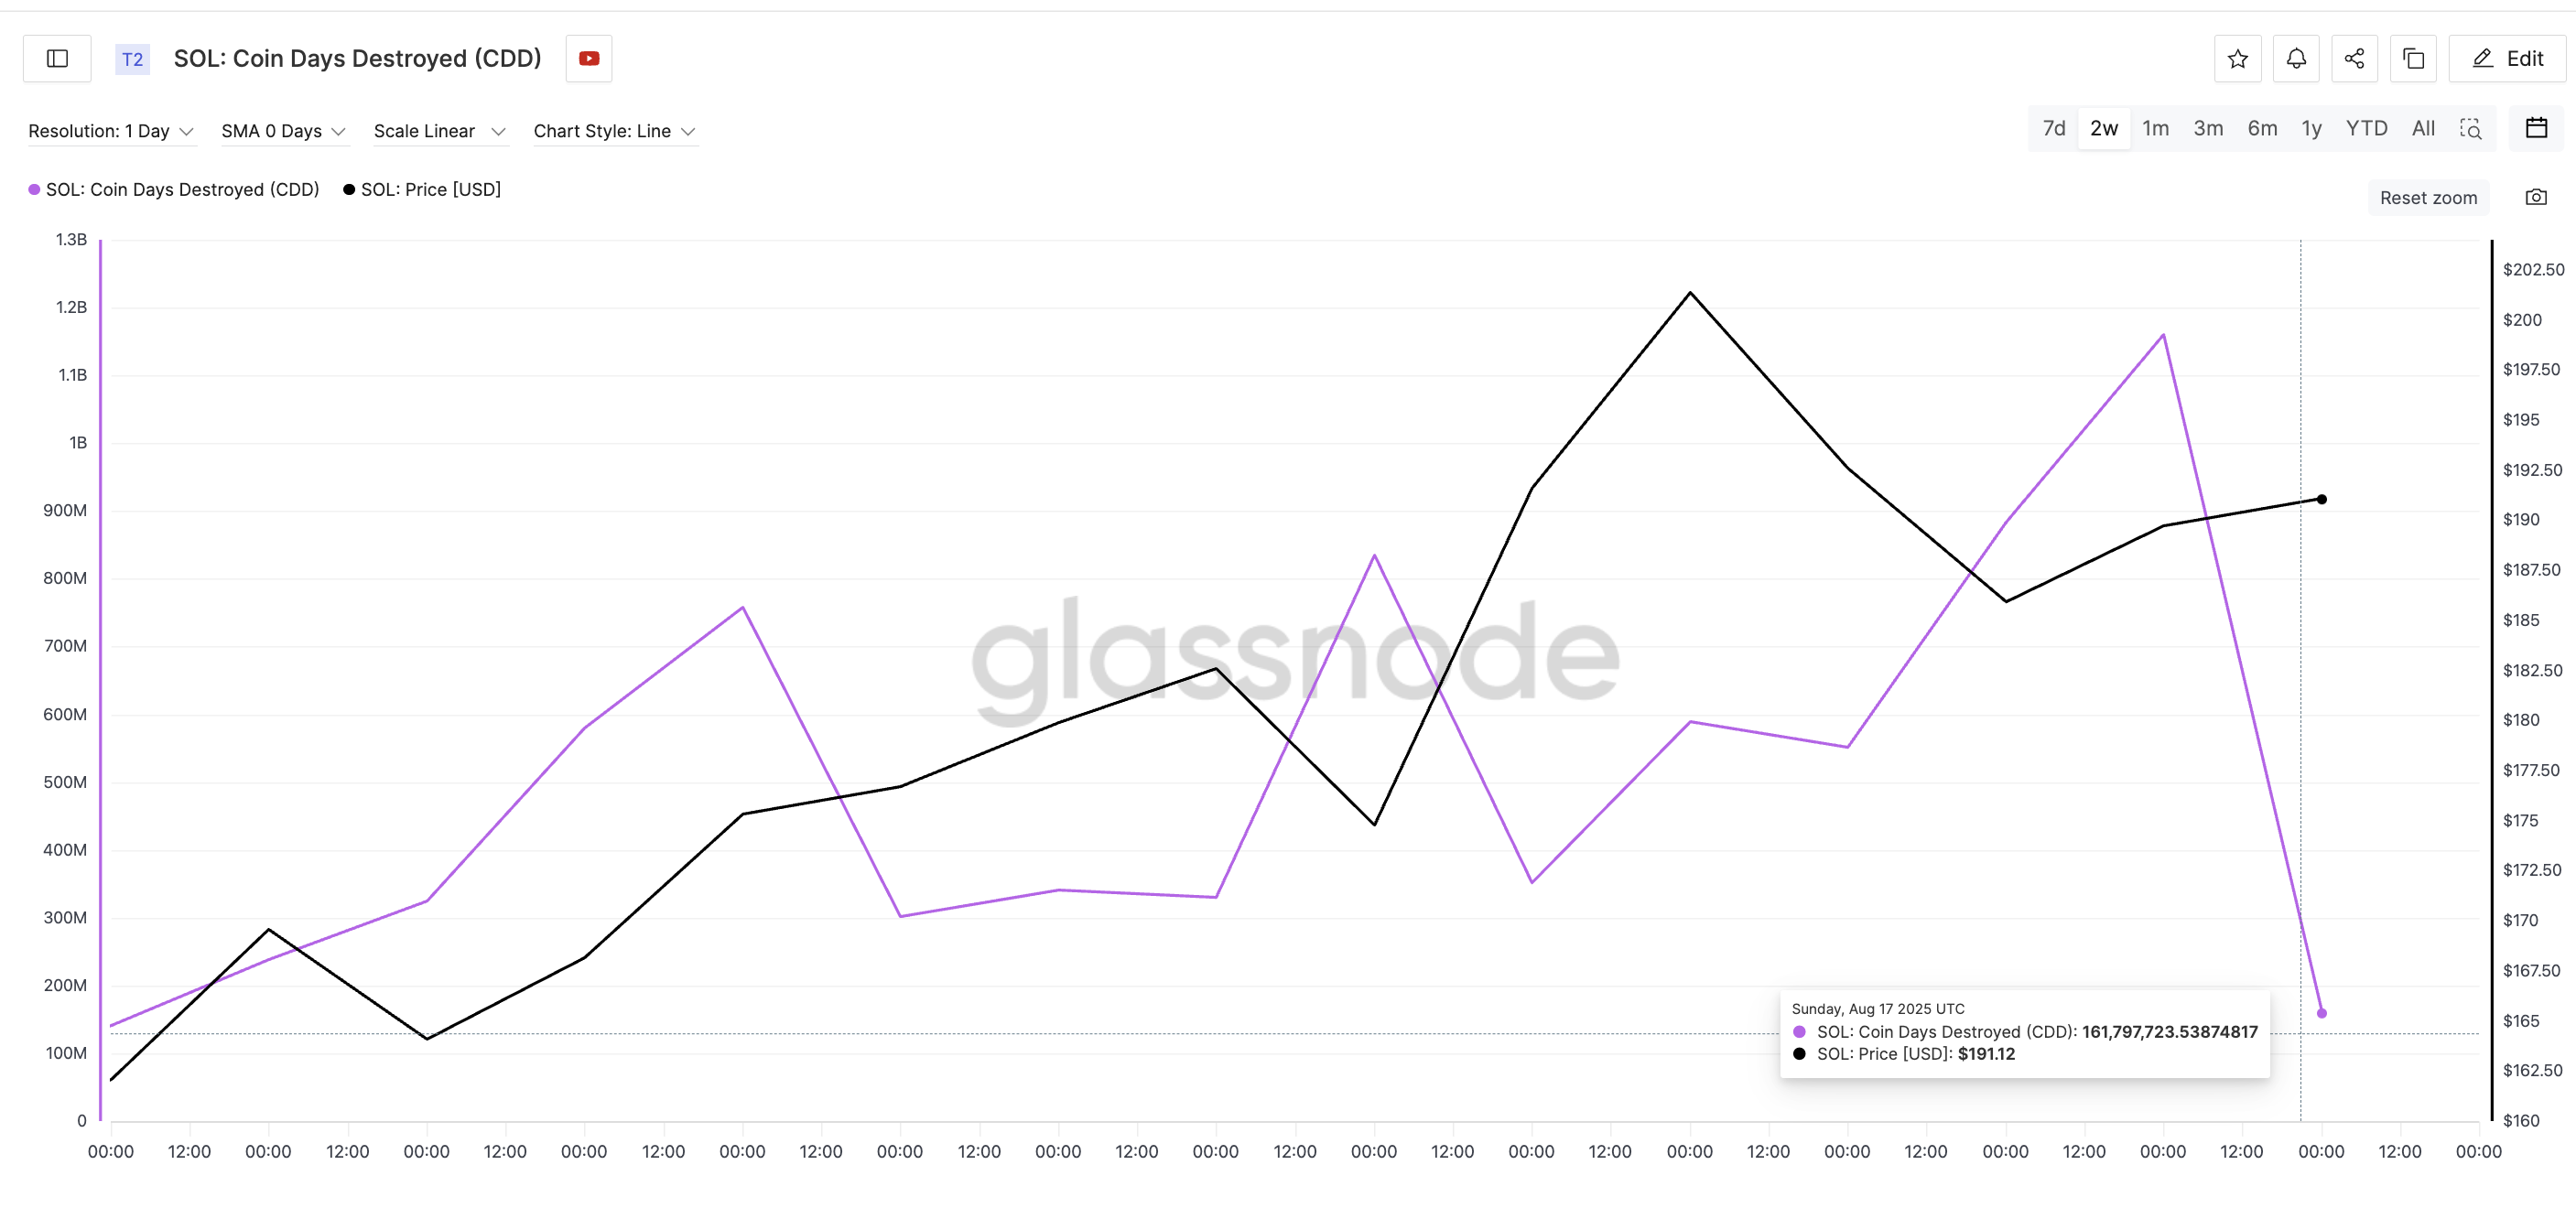
This kind of move typically happens when long-held coins are not being sold. If holders who’ve kept SOL idle for weeks or months were suddenly dumping, this number WOULD rise sharply. Something that happened between August 12 and August 16.
The drop in CDD from August 16 to August 17 indicates most coins being moved are either short-held or recent buys, and the majority of dormant supply remains untouched. However, the metric’s bullishness would be confirmed better if the CDD remains low or doesn’t spike immediately. That would mean that long-term holders are done with profit booking or selling.
Looking back at early August, similar dips in CDD coincided with Solana price consolidation phases that preceded fast recoveries.
Coin Days Destroyed (CDD) measures how much coin age is lost when tokens are spent. The longer a coin is held, the more “coin days” it accumulates. When it’s finally moved, those coin days are “destroyed.” Higher values indicate old coins are on the move; lower values suggest recent or no meaningful spending.
Supply Continues To Move Out
Pair that with exchange balances, and the setup becomes even clearer. Between August 14 and August 16, the total SOL across all exchanges dropped from 32.35 million to 31.23 million. That’s over 1.12 million SOL pulled out — roughly a 3.46% decline in just 48 hours, during a period when the price fell from $192 to $185.
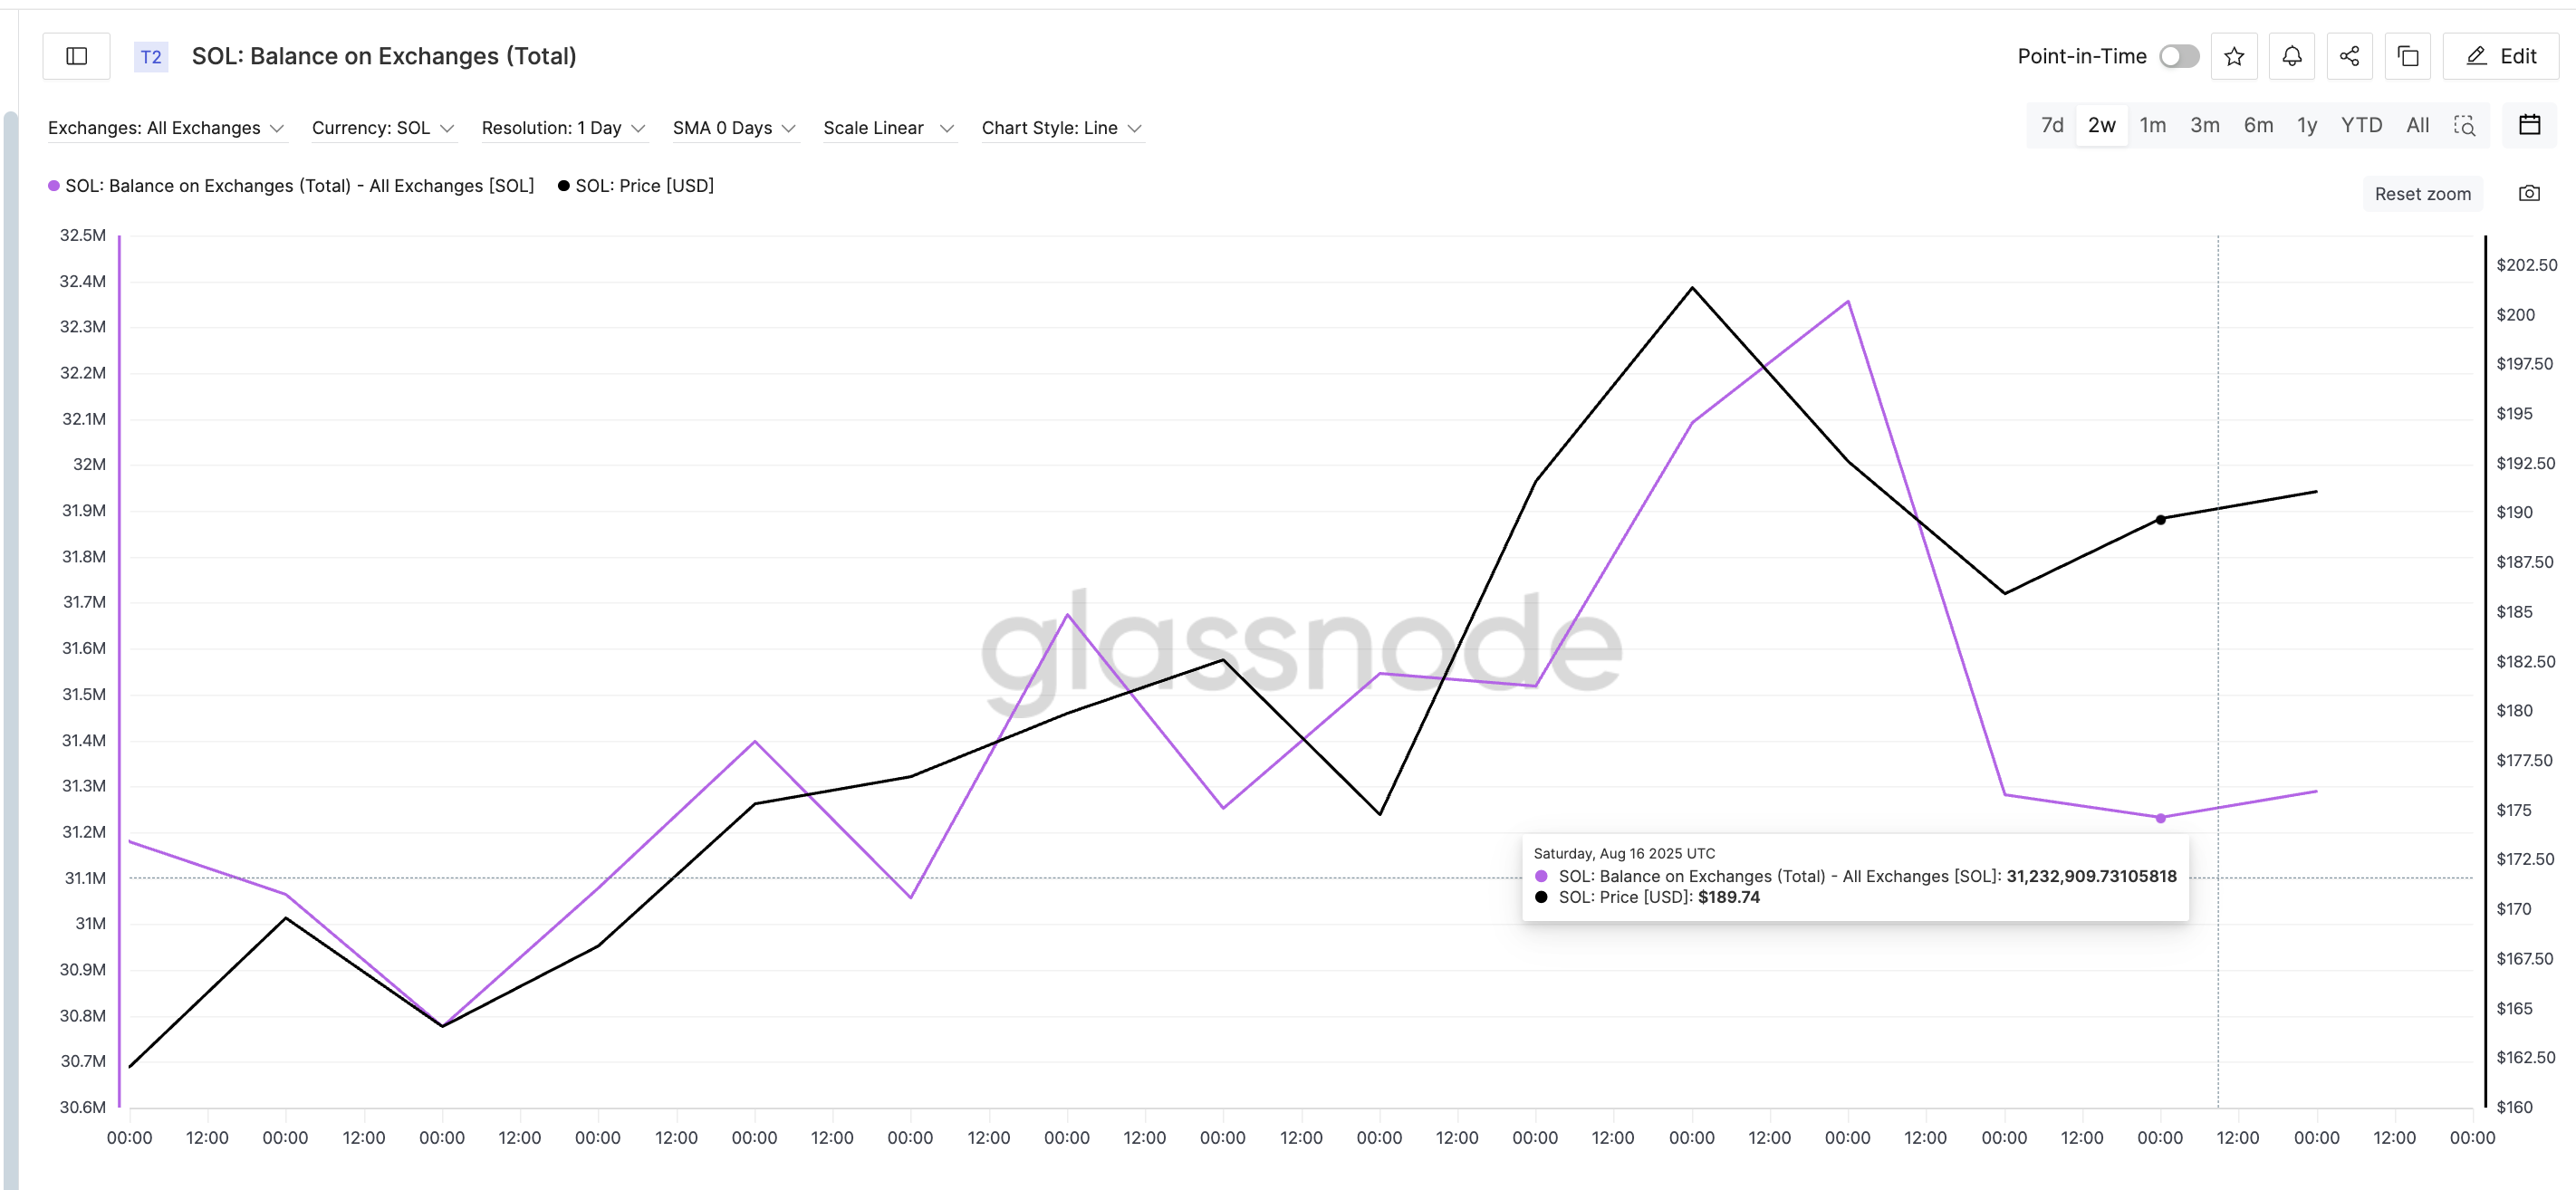
This is significant. In a typical correction, one would expect rising balances as traders rush to exit. But the opposite is happening here. Supply is leaving exchanges, not entering, which implies accumulation (dip buying) or at least, a lack of panic selling.
Together, both metrics tell a story of supply tightening quietly while solana prices correct. Do note that the balance on exchanges has moved up slightly at the time of writing. Yet, it continues to be around the recent lows.
: Want more token insights like this? Sign up for Editor Harsh Notariya’s Daily crypto Newsletter here.
Solana Price: Support Levels Hold as Structure Remains Intact
On the technical side, the solana price has dipped to a local low of $180.89 (August 18), rejecting the $189.95 short-term resistance. Below that, it’s currently sitting between two zones — $178.24 and $173.46, both of which acted as strong reaction levels in early August.
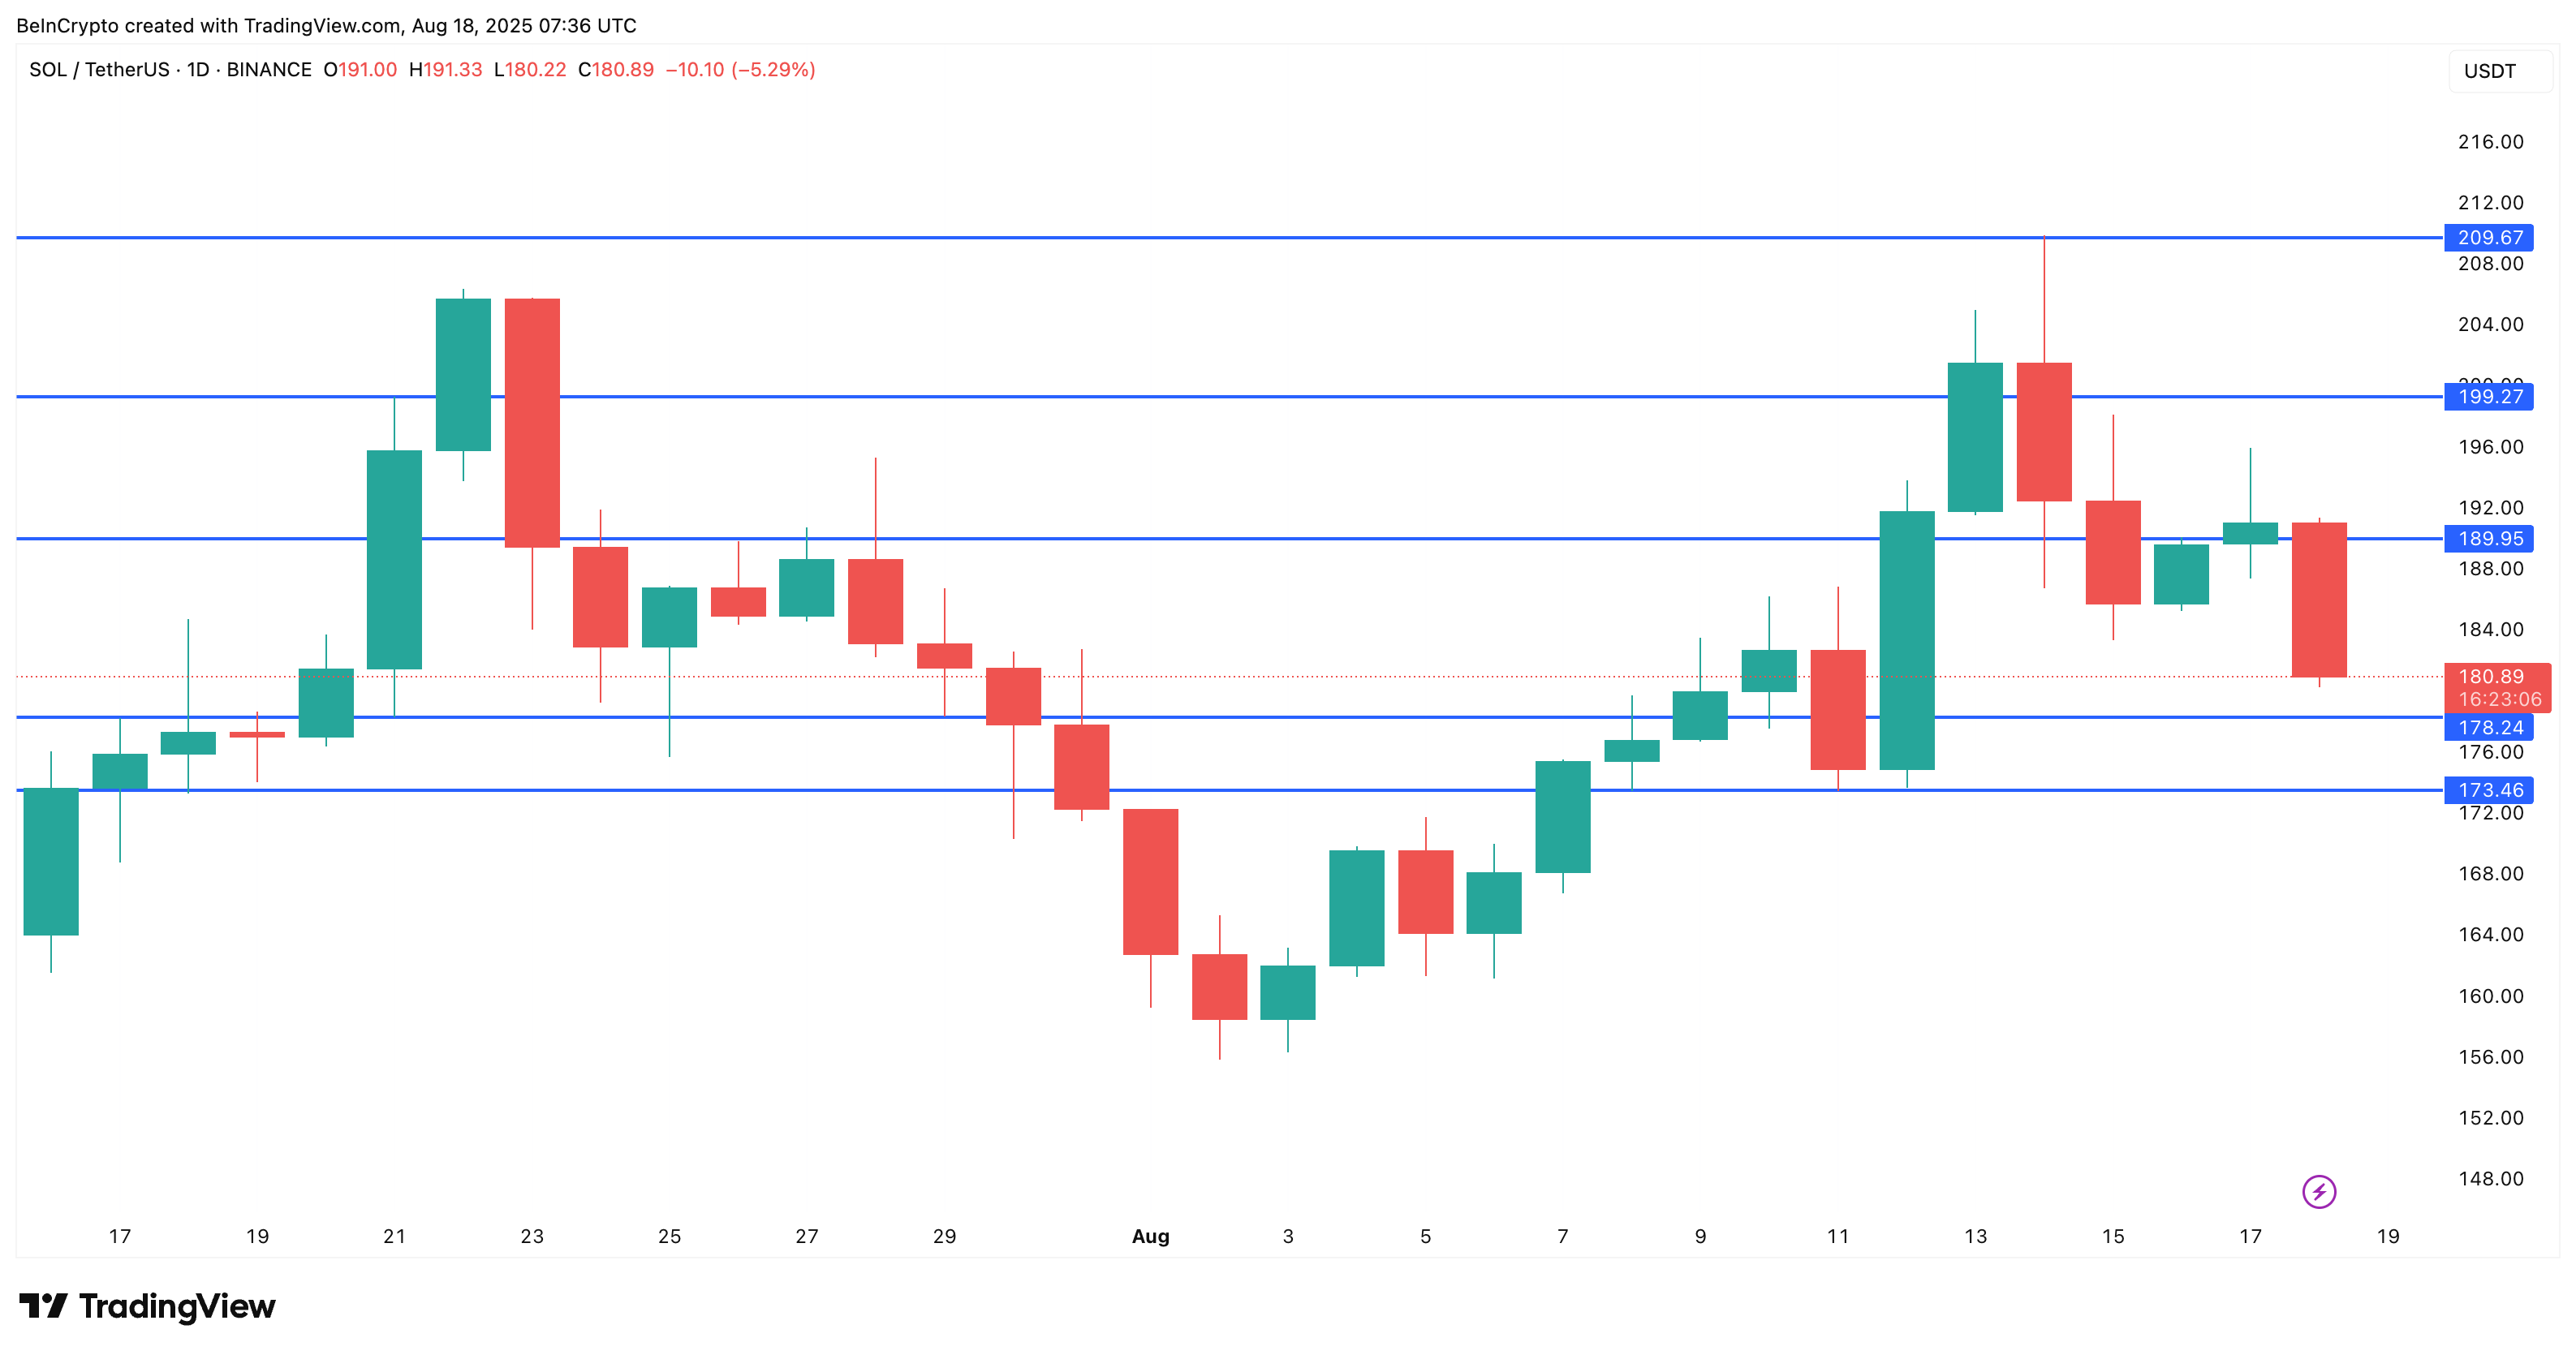
If these levels hold, Solana could revisit the $189–$199 cluster. That zone has been tested a few times over the past month and is still acting as a mid-term resistance band. A clean break above $199.27 would likely push SOL back into the $209+ area.
However, this short-term bullish hypothesis will lose ground if the Solana price breaks the $173.46 level.
