XLM Price Braces for Deeper Correction—But Smart Money Is Gobbling Up the Dip

Stellar's XLM is flashing red—yet someone's loading up while retail panics.
Here's why the 'discount' might not last long.
### Blood in the Streets (But Not for Everyone)
Another day, another crypto pullback. XLM’s price action looks grim on the surface, nosediving toward key support levels. Yet blockchain sleuths spot whale wallets quietly accumulating—classic 'buy when there’s fear' behavior.
### The Contrarian Playbook
While paper hands dump, institutional-grade investors see fire-sale prices. Trading volumes hint at stealthy accumulation, echoing past bottoms where XLM ripped 100%+ off lows. History rhyming—or repeating?
### The Cynic’s Corner
Of course, this could just be hedge funds painting the tape before dumping on retail (again). But hey—in crypto, even conspiracy theories have exit liquidity.
Spot and Derivatives Show Weakness
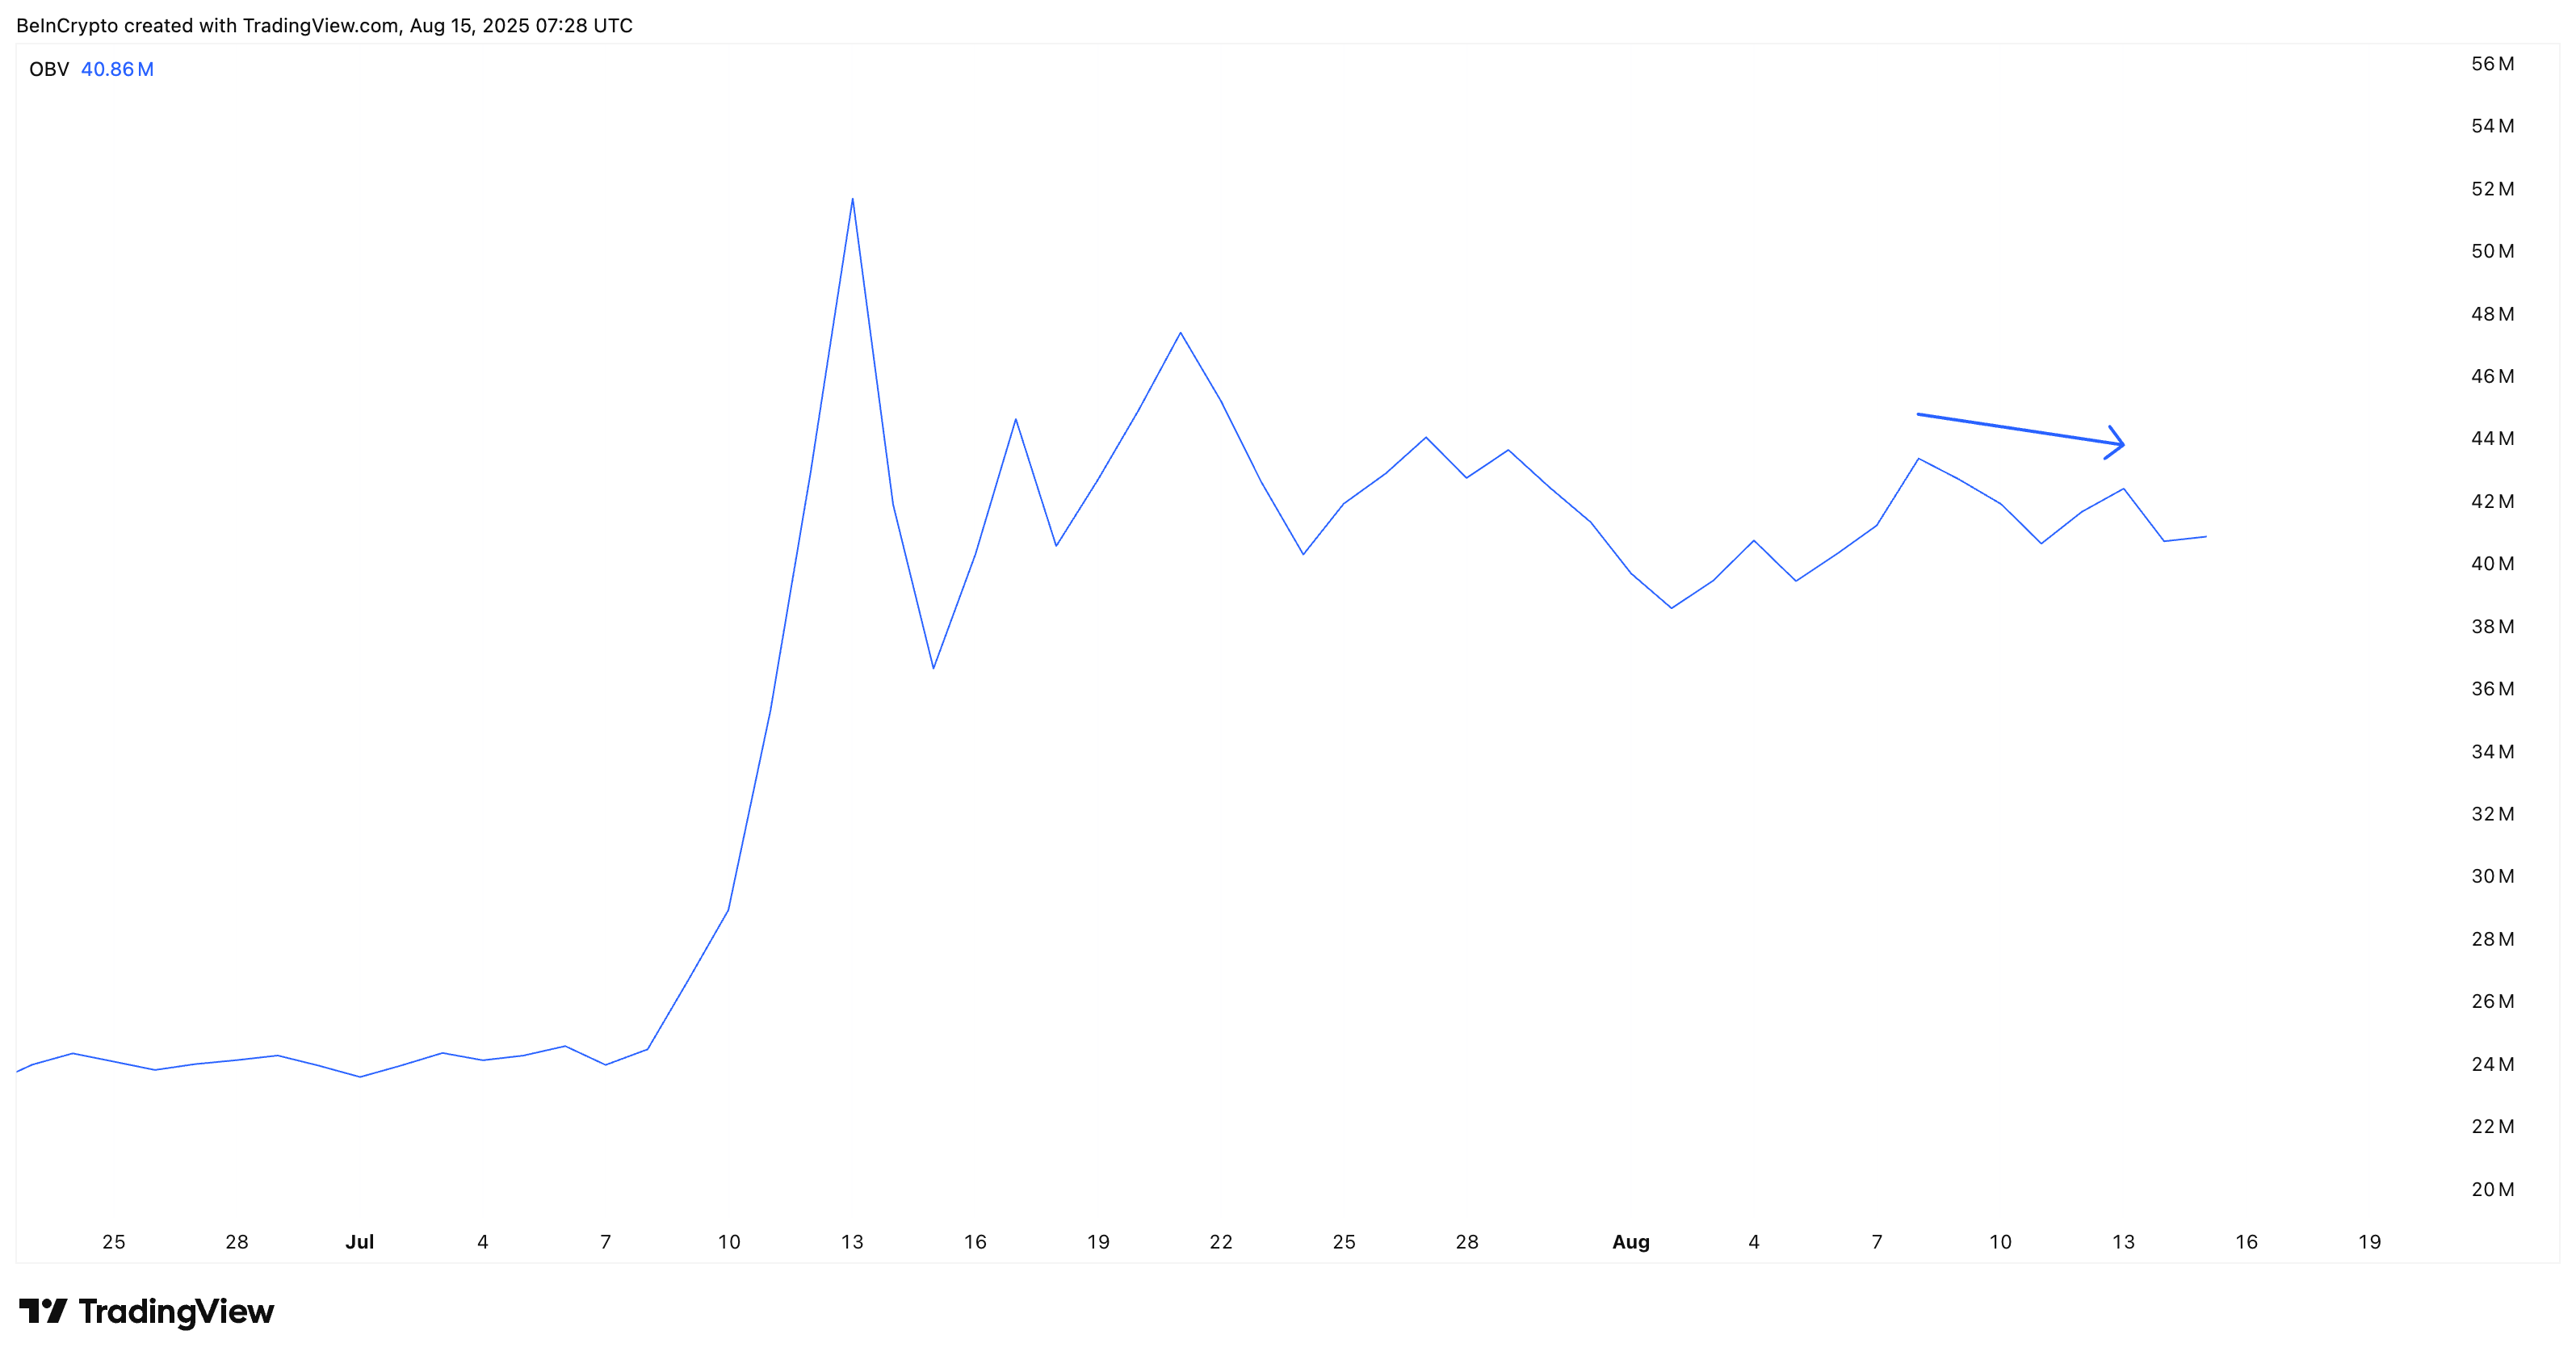
The first red flag is in market participation. While the XLM price made a higher high on the price chart (between August 8 and August 13), On-Balance Volume (OBV) printed a lower high. This suggests that spot buying interest is not following the same momentum. This divergence indicates that rallies have been met with lighter buying pressure, limiting sustainability.
In derivatives, the story is similar. Stellar’s Futures open interest has been on a steady slide, falling from around $420 million in mid-July to roughly $260 million at press time.
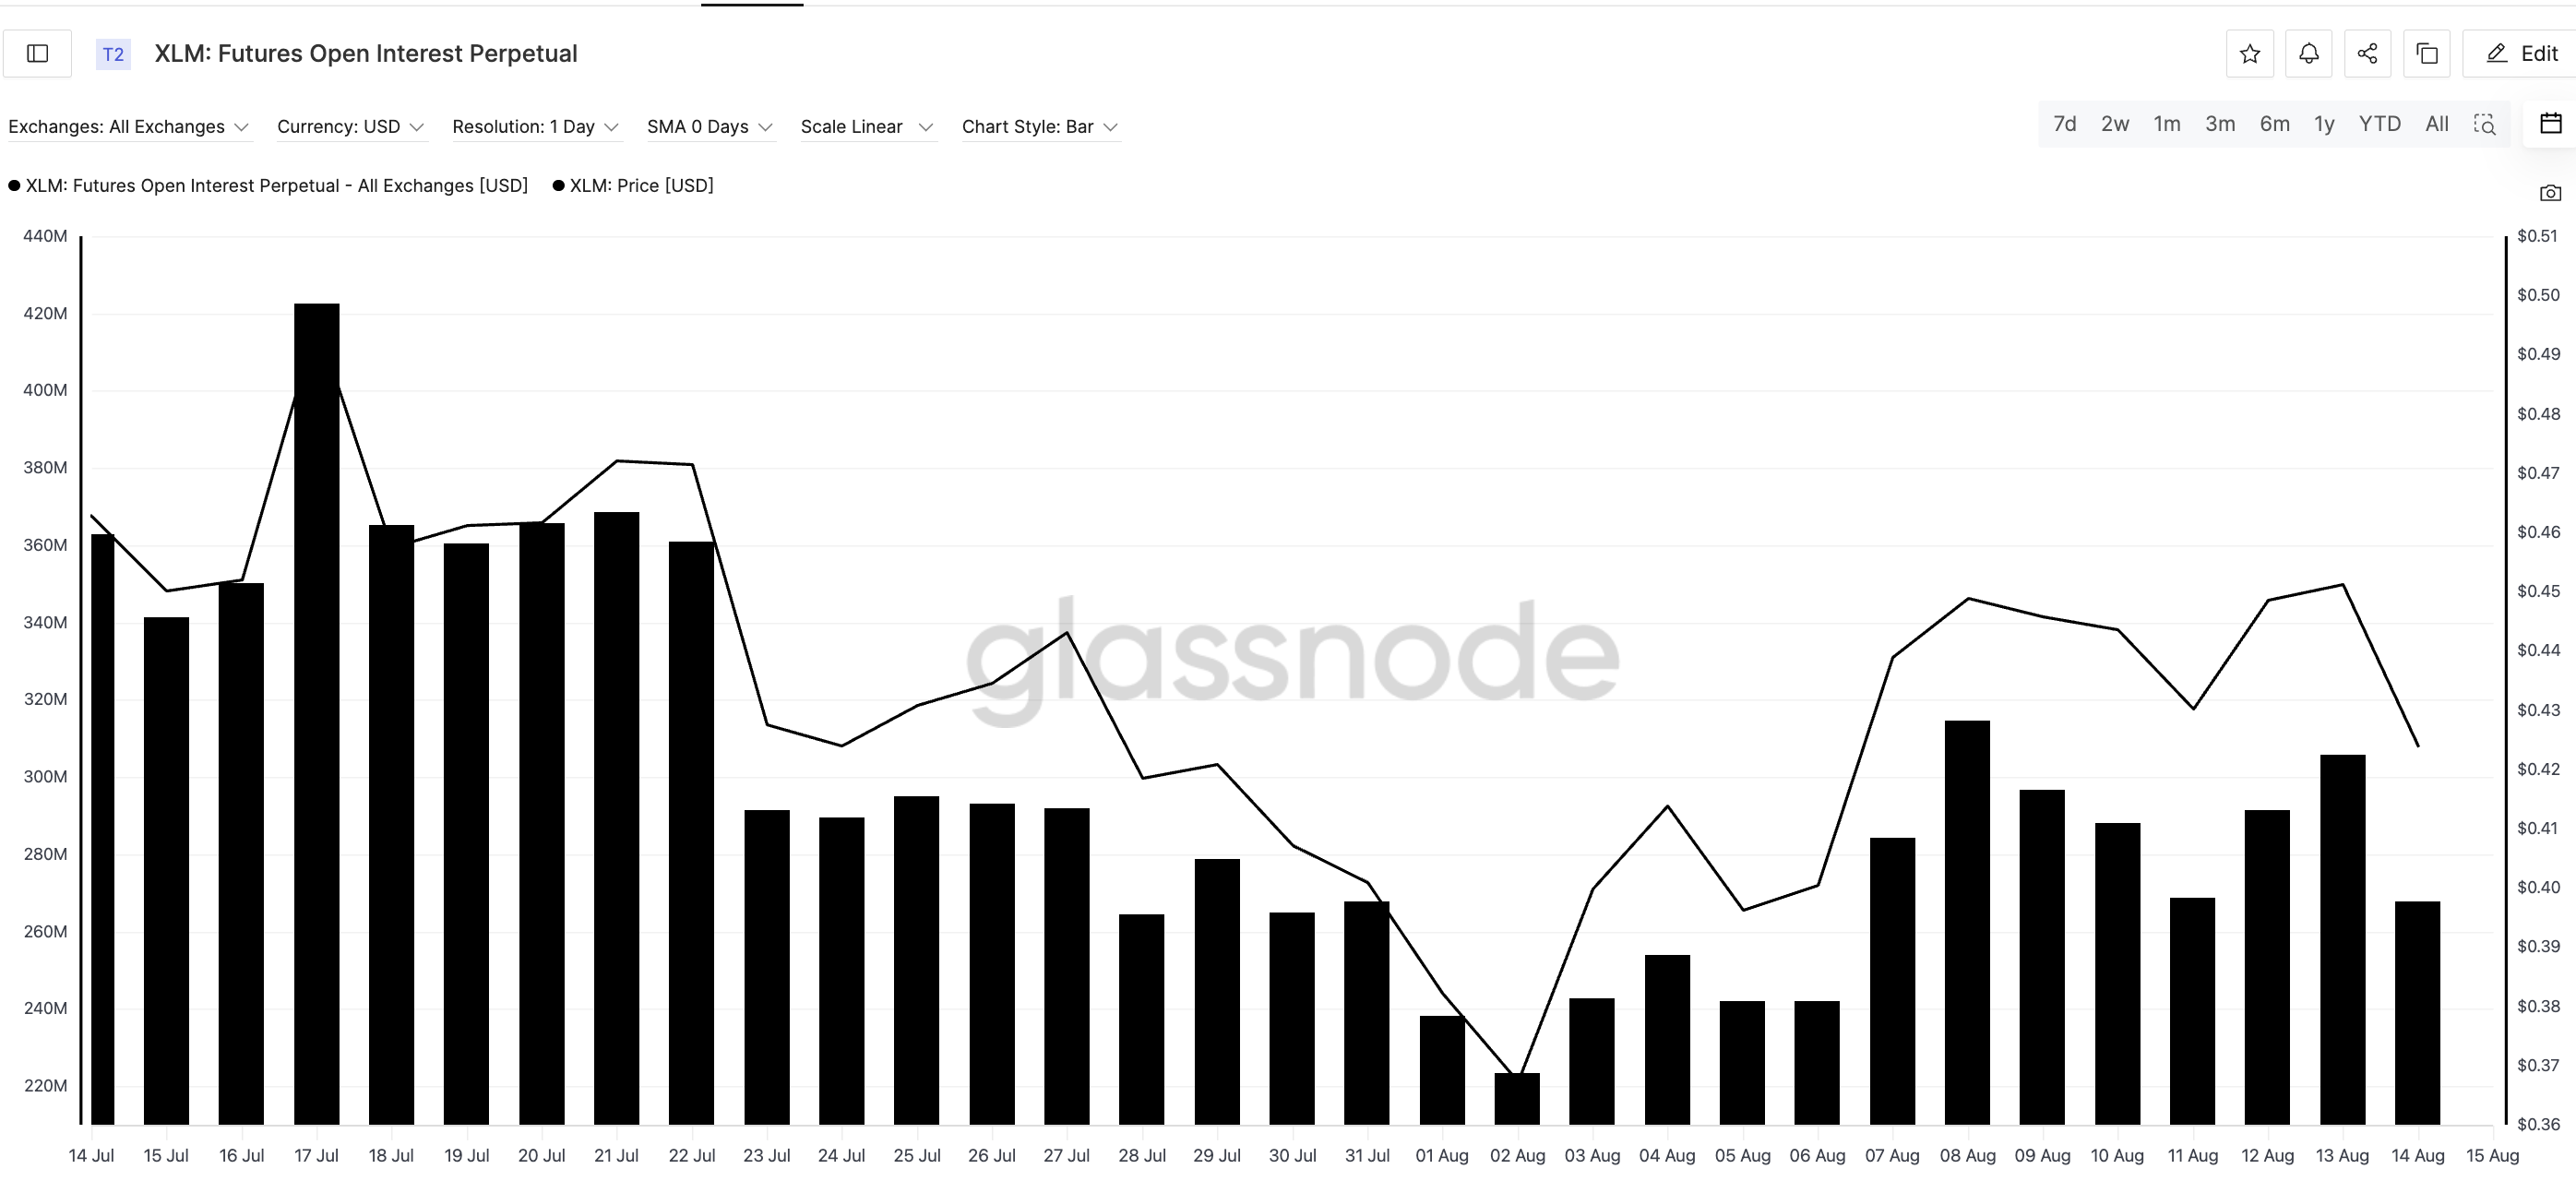
This drop shows Leveraged traders are stepping back, reducing the kind of speculative fuel that often helps sustain breakouts. With both spot demand and leveraged exposure fading, the market’s immediate posture leans cautious.
Futures Open Interest (perpetual) is the total value of all active perpetual futures contracts that haven’t been closed or settled, showing how much capital is committed to the market at a given time.
: Want more token insights like this? Sign up for Editor Harsh Notariya’s Daily crypto Newsletter here.
Long-Term Holders Lighten Up, Short-Term Hands Step In
The HODL Cave metric maps the distribution of historical returns for XLM holders across different percentiles at the current point in time (day 3,837).
For example, a 100th percentile value of 117.67x means that in all historical holding periods for that duration, the best-performing one delivered at least 117.67x gains.
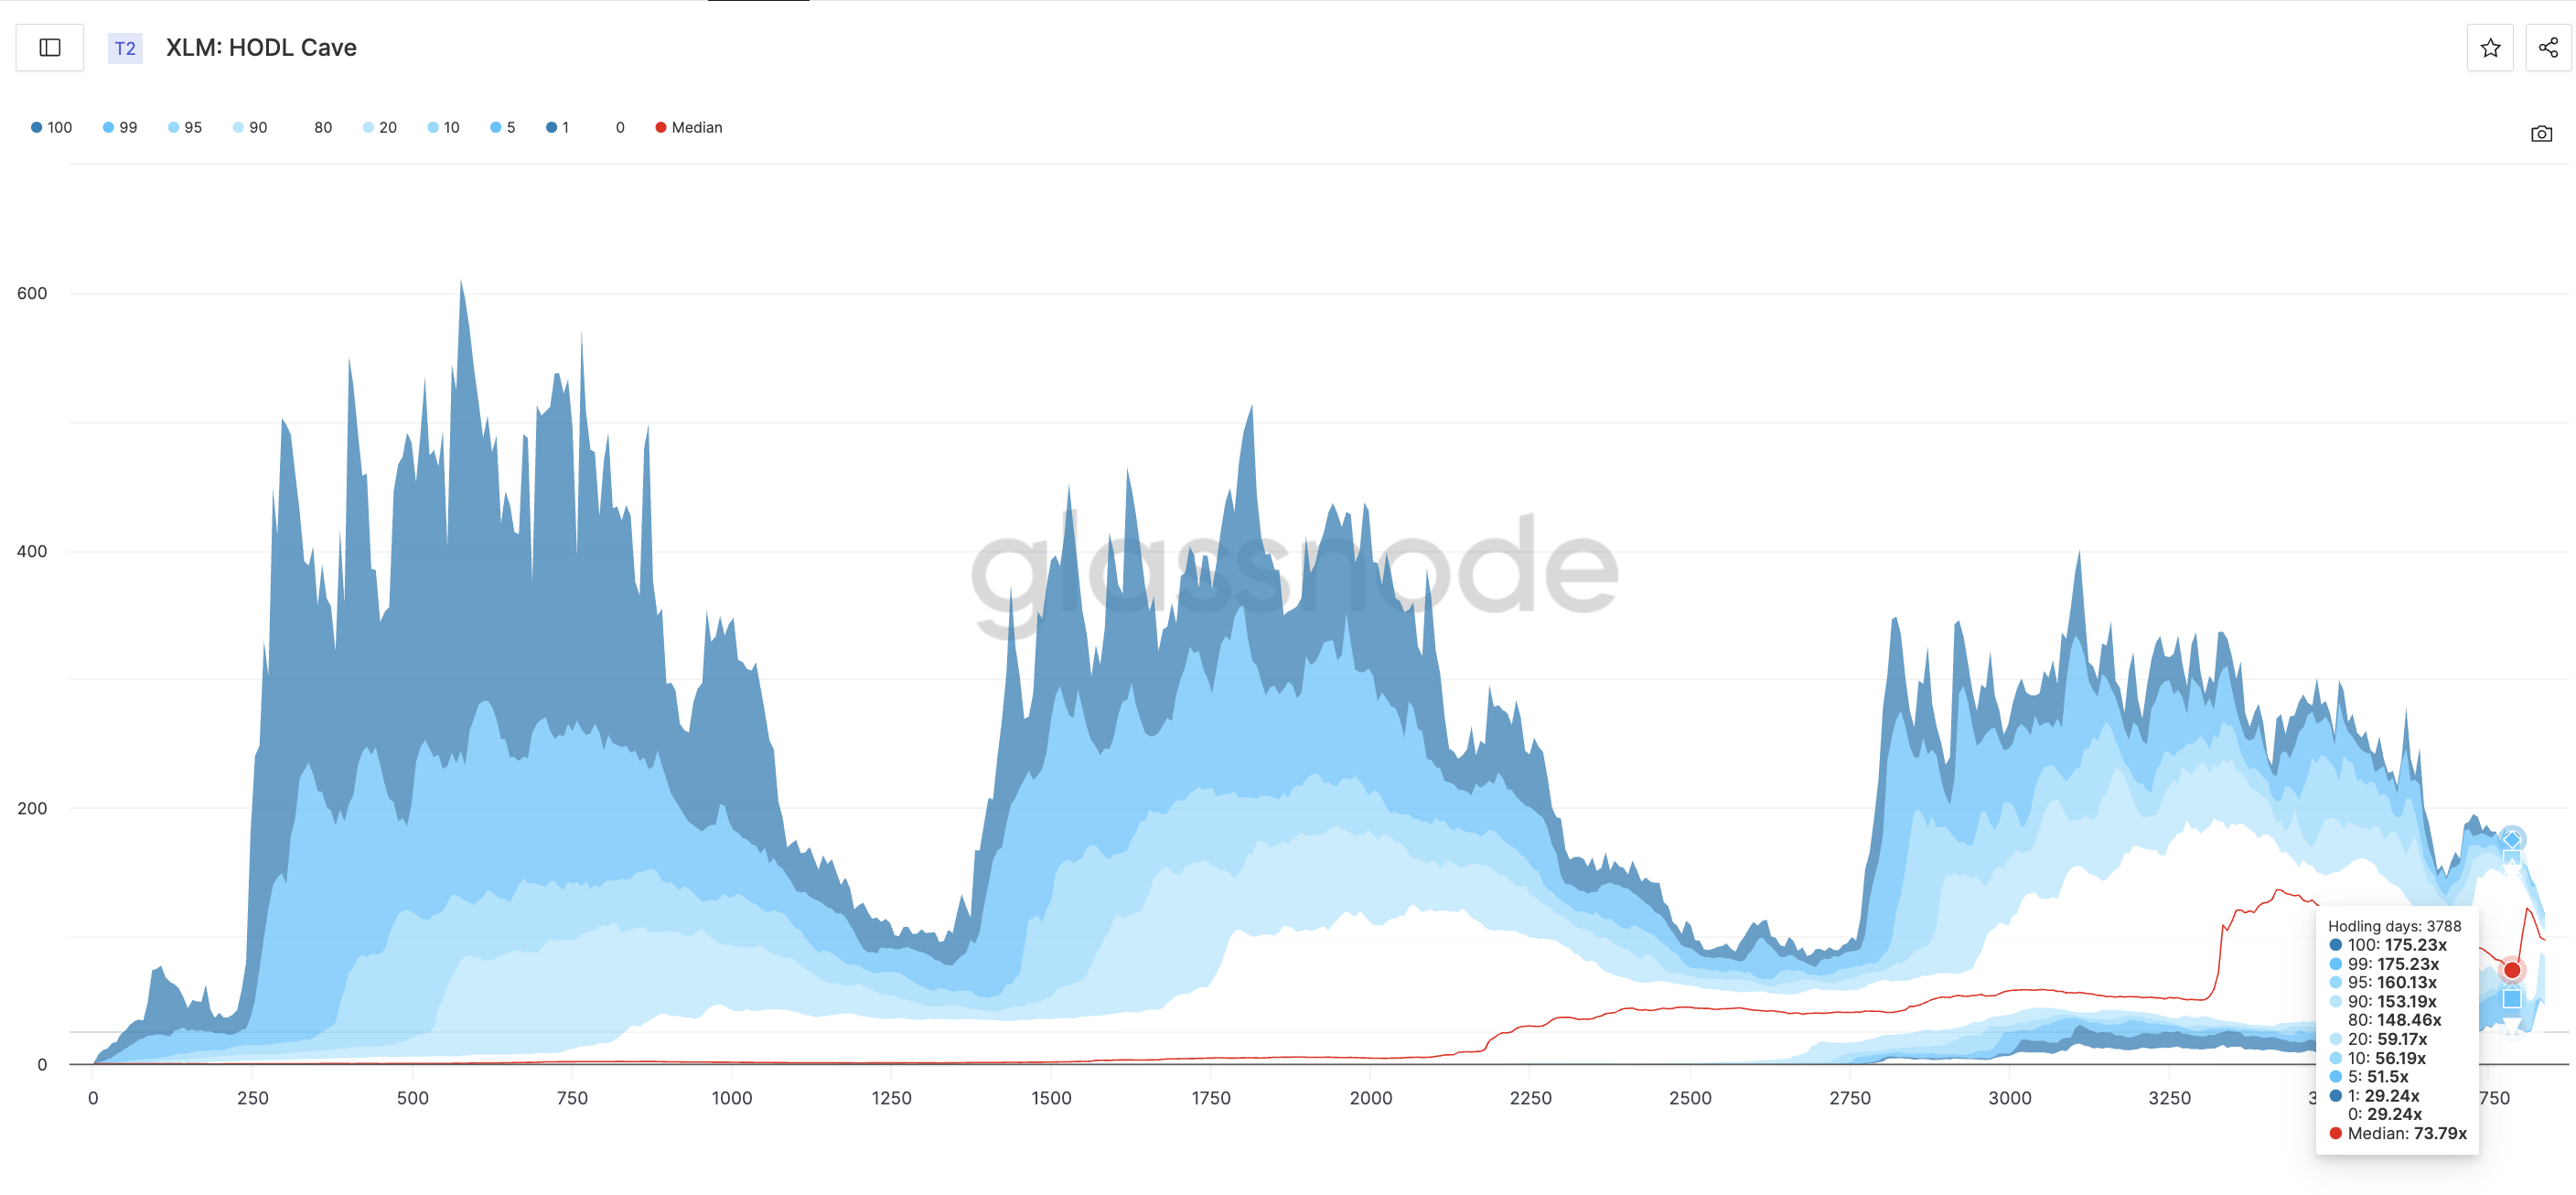
Between holding day 3,788 and 3,837, XLM’s median historical return (50th percentile) climbed from 73.79x to 97.35x — a sign that the typical return across all holding durations has improved. But this increase hides a rotation:
- The highest percentile bands — 100, 99, 95, 90, and even 80 — have fallen sharply. This signals that the very best historical returns for long-term holders are now lower, consistent with profit-taking from older coins.
- The lowest percentile bands — 0, 1, 10, 20 — have risen strongly (e.g., 20th percentile from 59.17x to 84.81x). This indicates that even the weakest historical returns for shorter holding durations are improving.
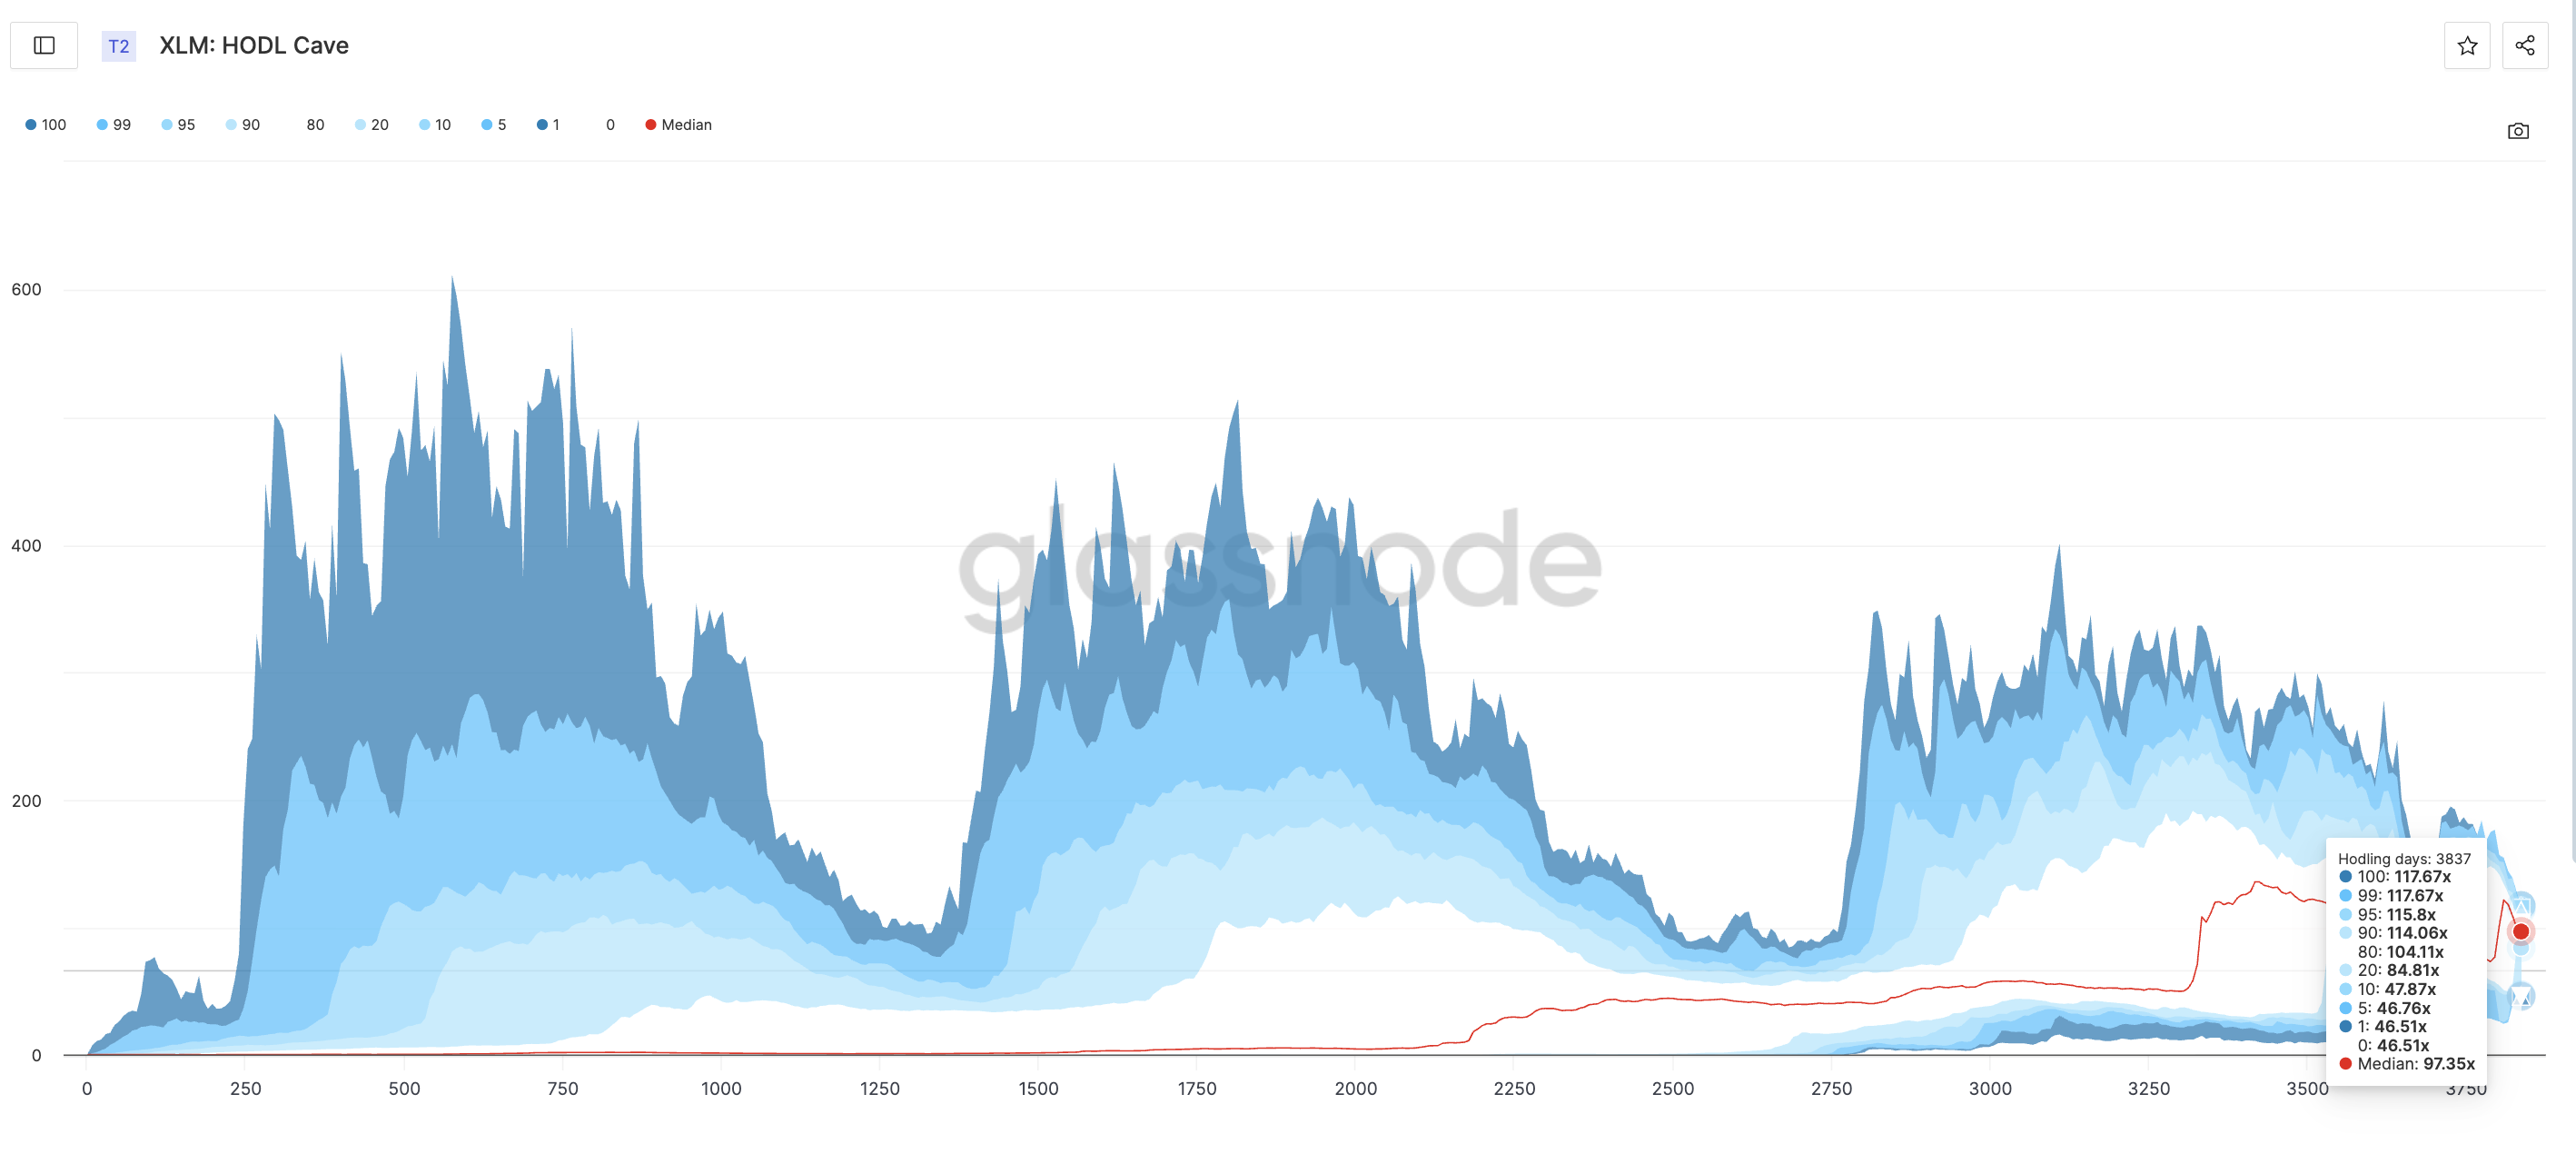
This pattern suggests older, high-return coins are being sold into the market, but newer buyers are stepping in and achieving stronger short-term profit multiples. In other words, long-term holders are distributing, while fresh entrants are selectively accumulating during weakness.
When paired with spot and futures data, the picture is still mixed. Spot volumes and OBV remain soft, while futures positioning has failed to show sustained build-up. Both those metrics show that momentum buyers aren’t yet back in force. However, the improvement in lower percentile bands within the HODL Cave indicates that at least part of the market is quietly positioning.
Key XLM Price Levels Show Rangebound Movement
The XLM price currently trades near $0.42, which is inside two key zones. Losing $0.40 (key support) could trigger a slide toward $0.38 and $0.36. On the upside, reclaiming $0.46 (key resistance) WOULD bring $0.48 into view, and a push through that level could set up a retest of the $0.52 local high.
However, for the past few trading sessions, the XLM price has been moving inside this support-resistance zone, hinting at indecision.
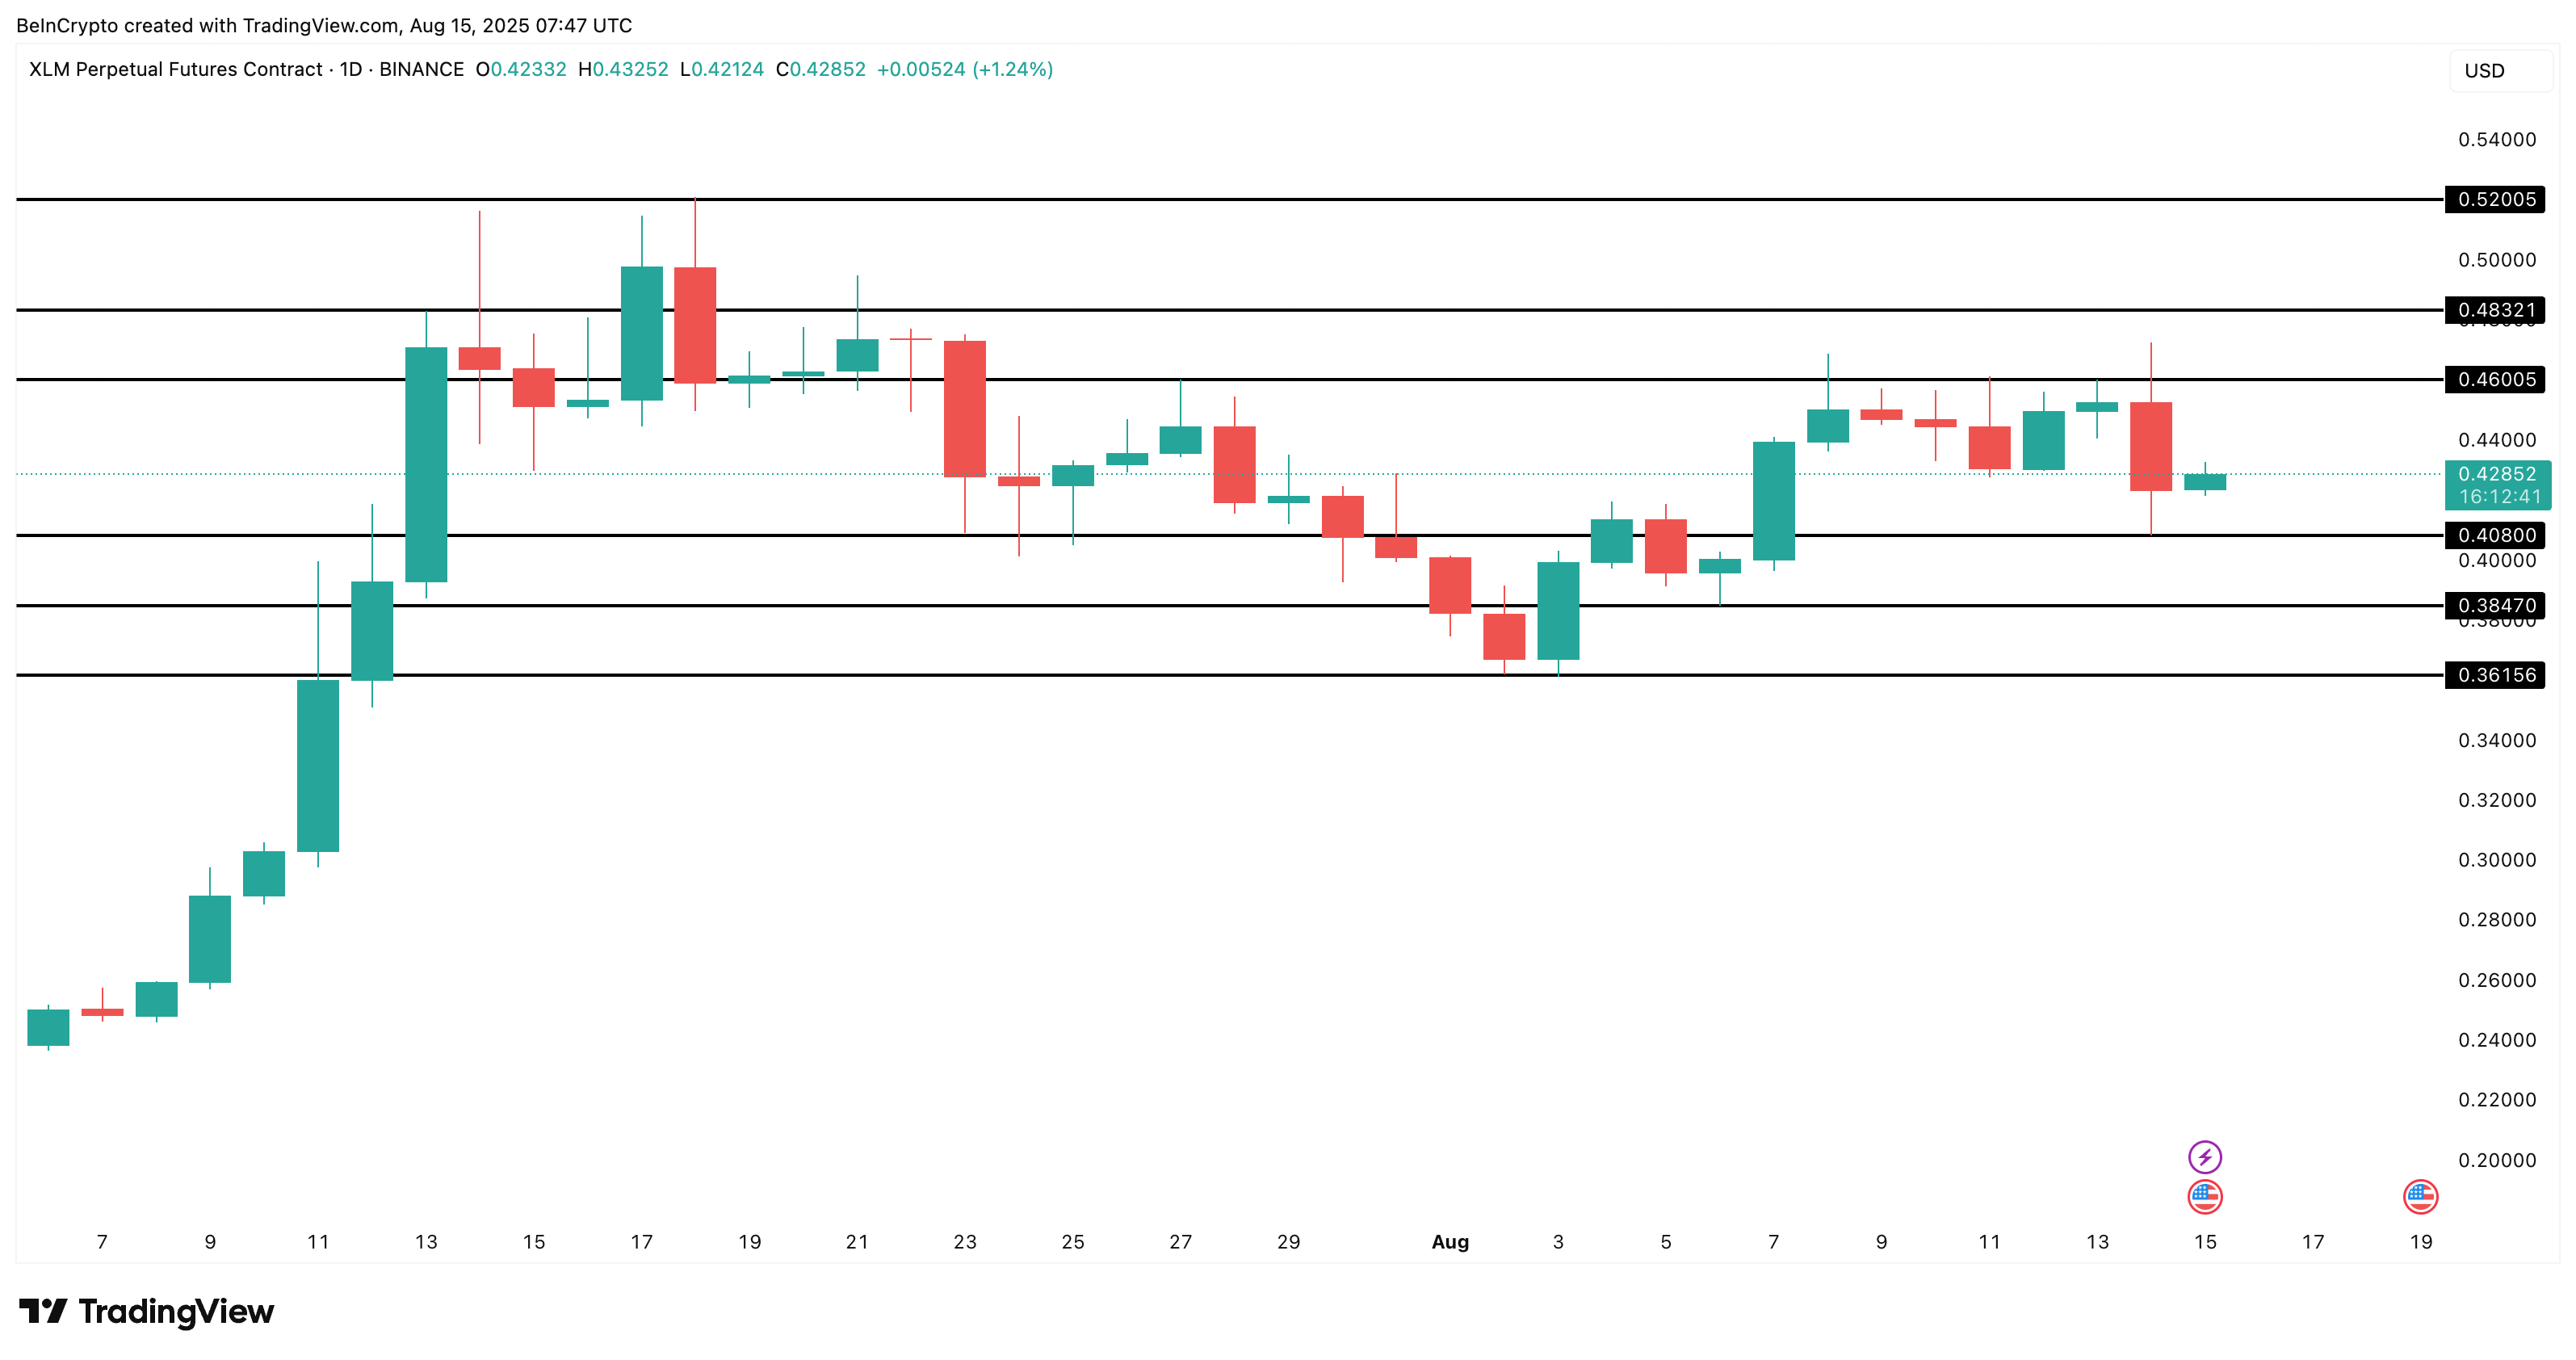
For now, the charts say the base is soft. But the HODL Cave metric hints that short and mid-term buyers may be quietly positioning for the next leg. The entire bullish trend fades if the XLM price loses $0.36, as that would open doors to new swing lows.
