Pi Network Token Primed for Explosive Rally After Hitting Rock Bottom

Buried in the crypto graveyard just weeks ago, Pi Network’s token is flashing bullish signals that could shock skeptics.
From Ashes to Opportunity
After scraping an all-time low that had traders writing obituaries, Pi suddenly shows the volatility curve of an asset waking from hibernation. The same retail miners who were mocked for 'free crypto' dreams now hold the keys to a supply shock.
Technical Breakout Incoming?
On-chain data reveals accumulation patterns eerily similar to Solana’s 2023 comeback playbook. Whispers of mainnet progress add fuel—though veterans know 'coming soon' in crypto years means 'maybe never.'
Just don’t mention the 37 million 'waitlisted users' who still can’t sell. Some decentralization.
Selling Pressure Eases on PI Token
On the one-day chart, PI’s Moving Average Convergence Divergence (MACD) indicator is approaching a positive crossover, signaling a potential shift in momentum toward buying strength.
: Want more token insights like this? Sign up for Editor Harsh Notariya’s Daily crypto Newsletter here.
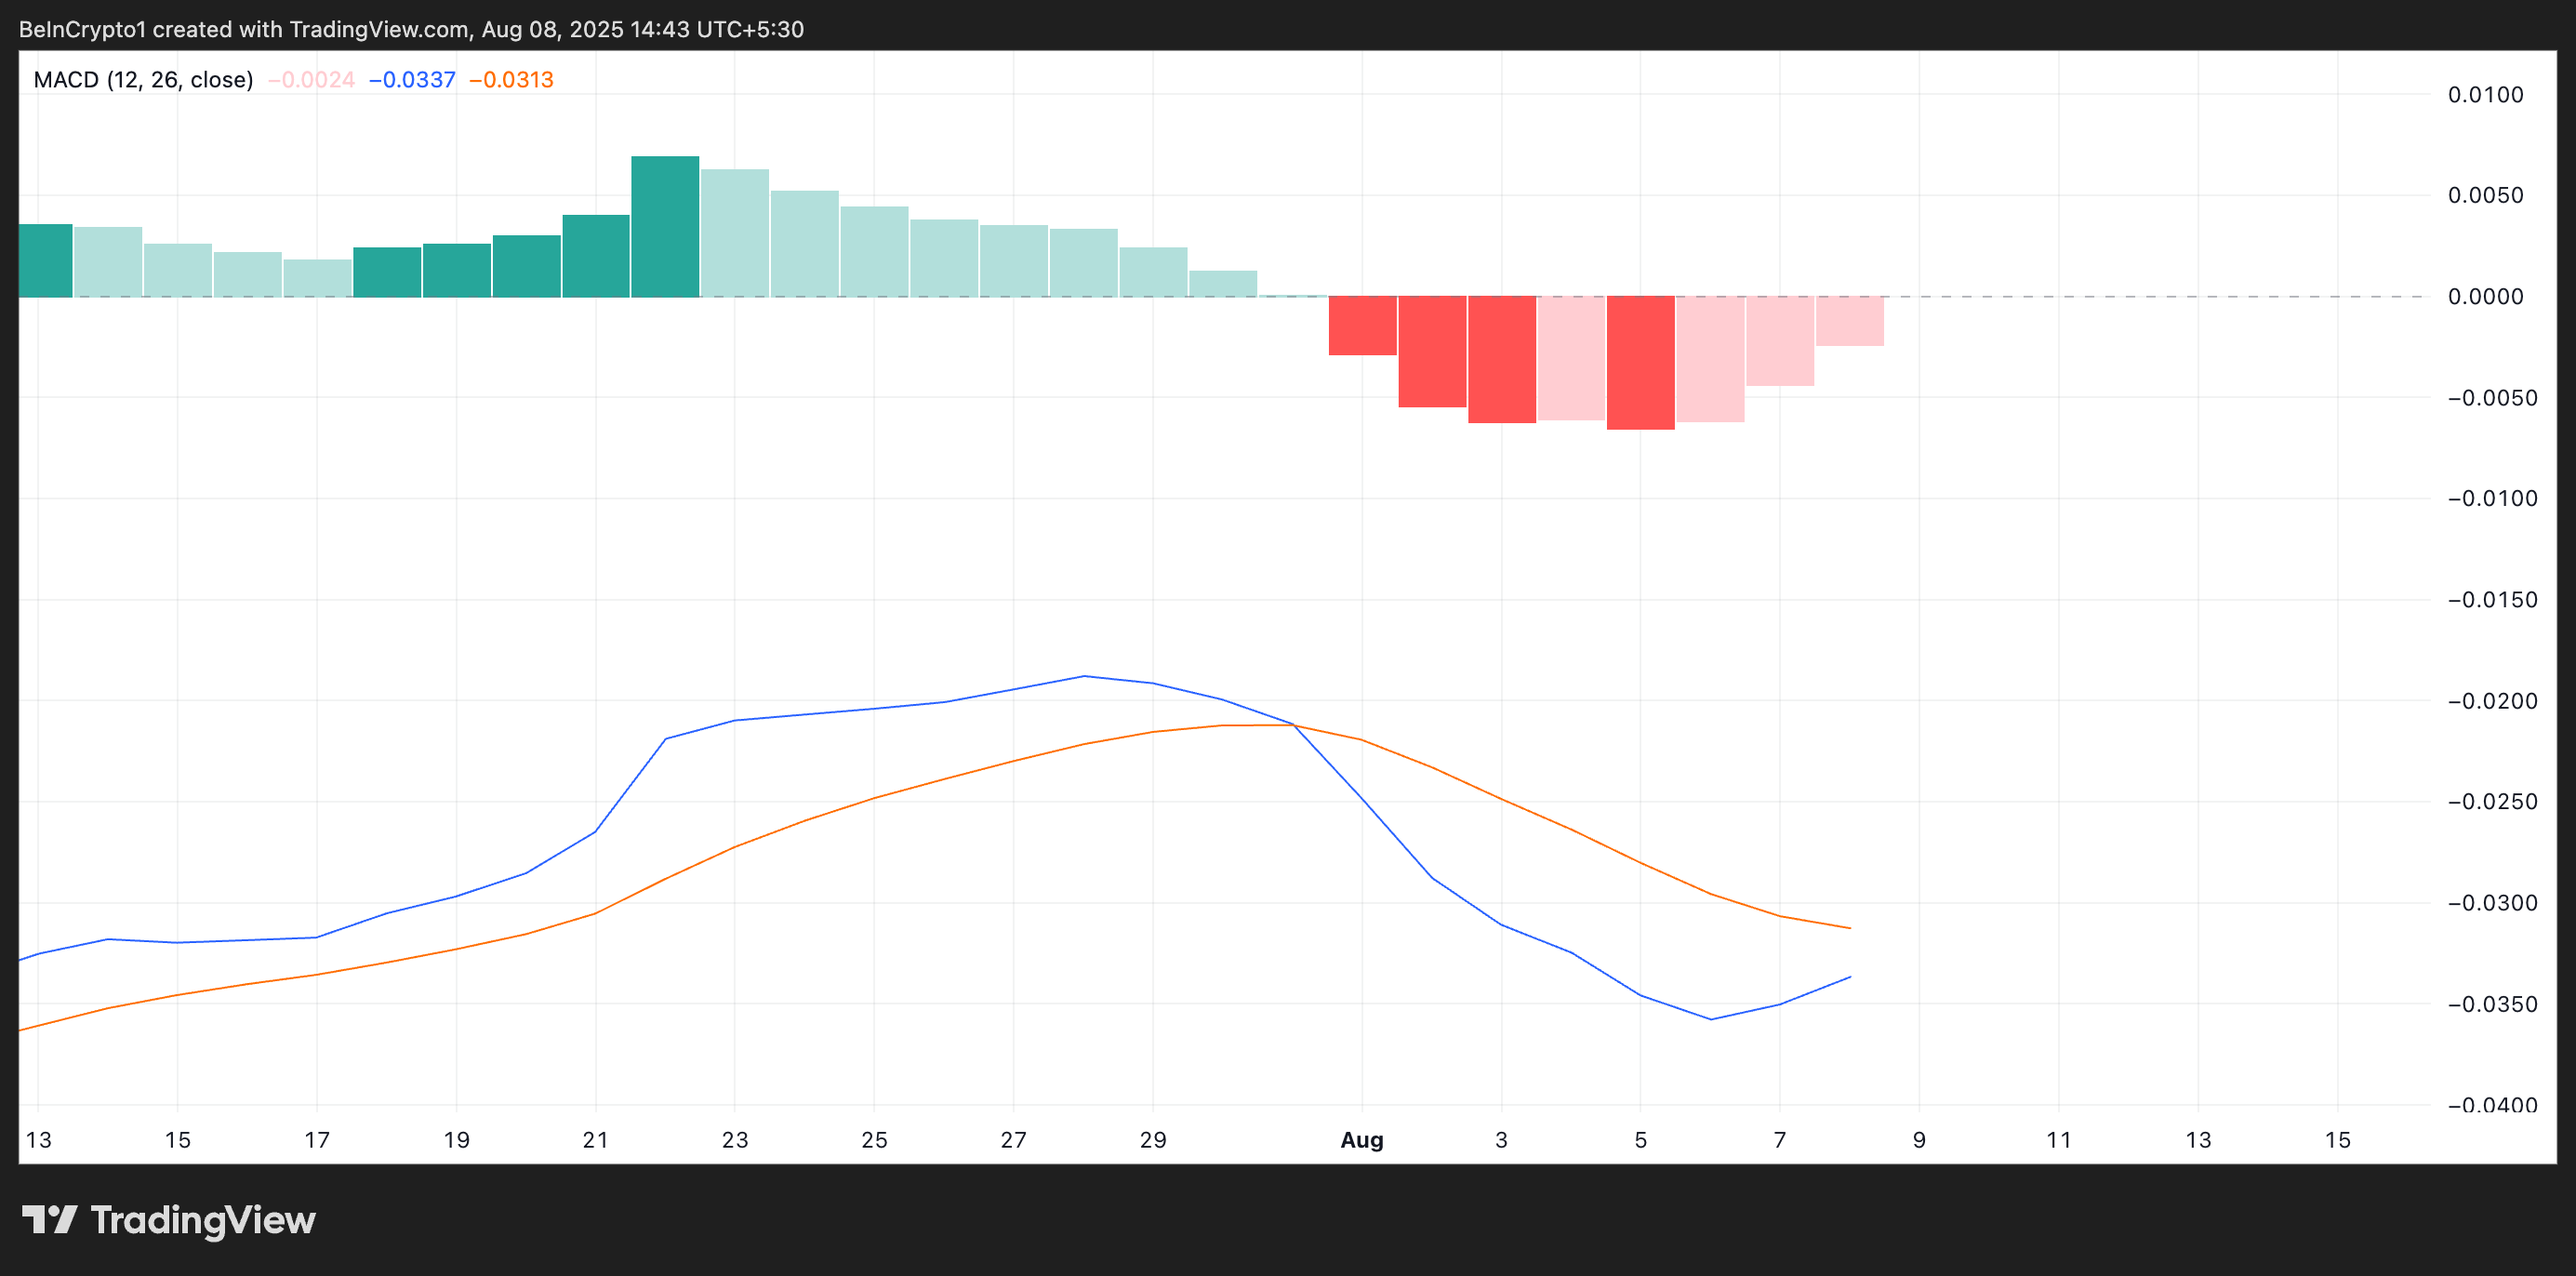
An asset’s MACD indicator identifies trends and momentum in its price movement. It helps traders spot potential buy or sell signals through crossovers between the MACD and signal lines.
A positive crossover occurs when the MACD line (blue) crosses the signal line (orange)
This is a bullish signal because it indicates that the asset’s short-term momentum is gaining strength relative to its longer-term trend. For PI, this means that buying interest is increasing and could push the price higher in the NEAR term.
Additionally, readings from PI’s BBTrend indicator show a steady decline in the sizes of its red bars since the sideways trend began.
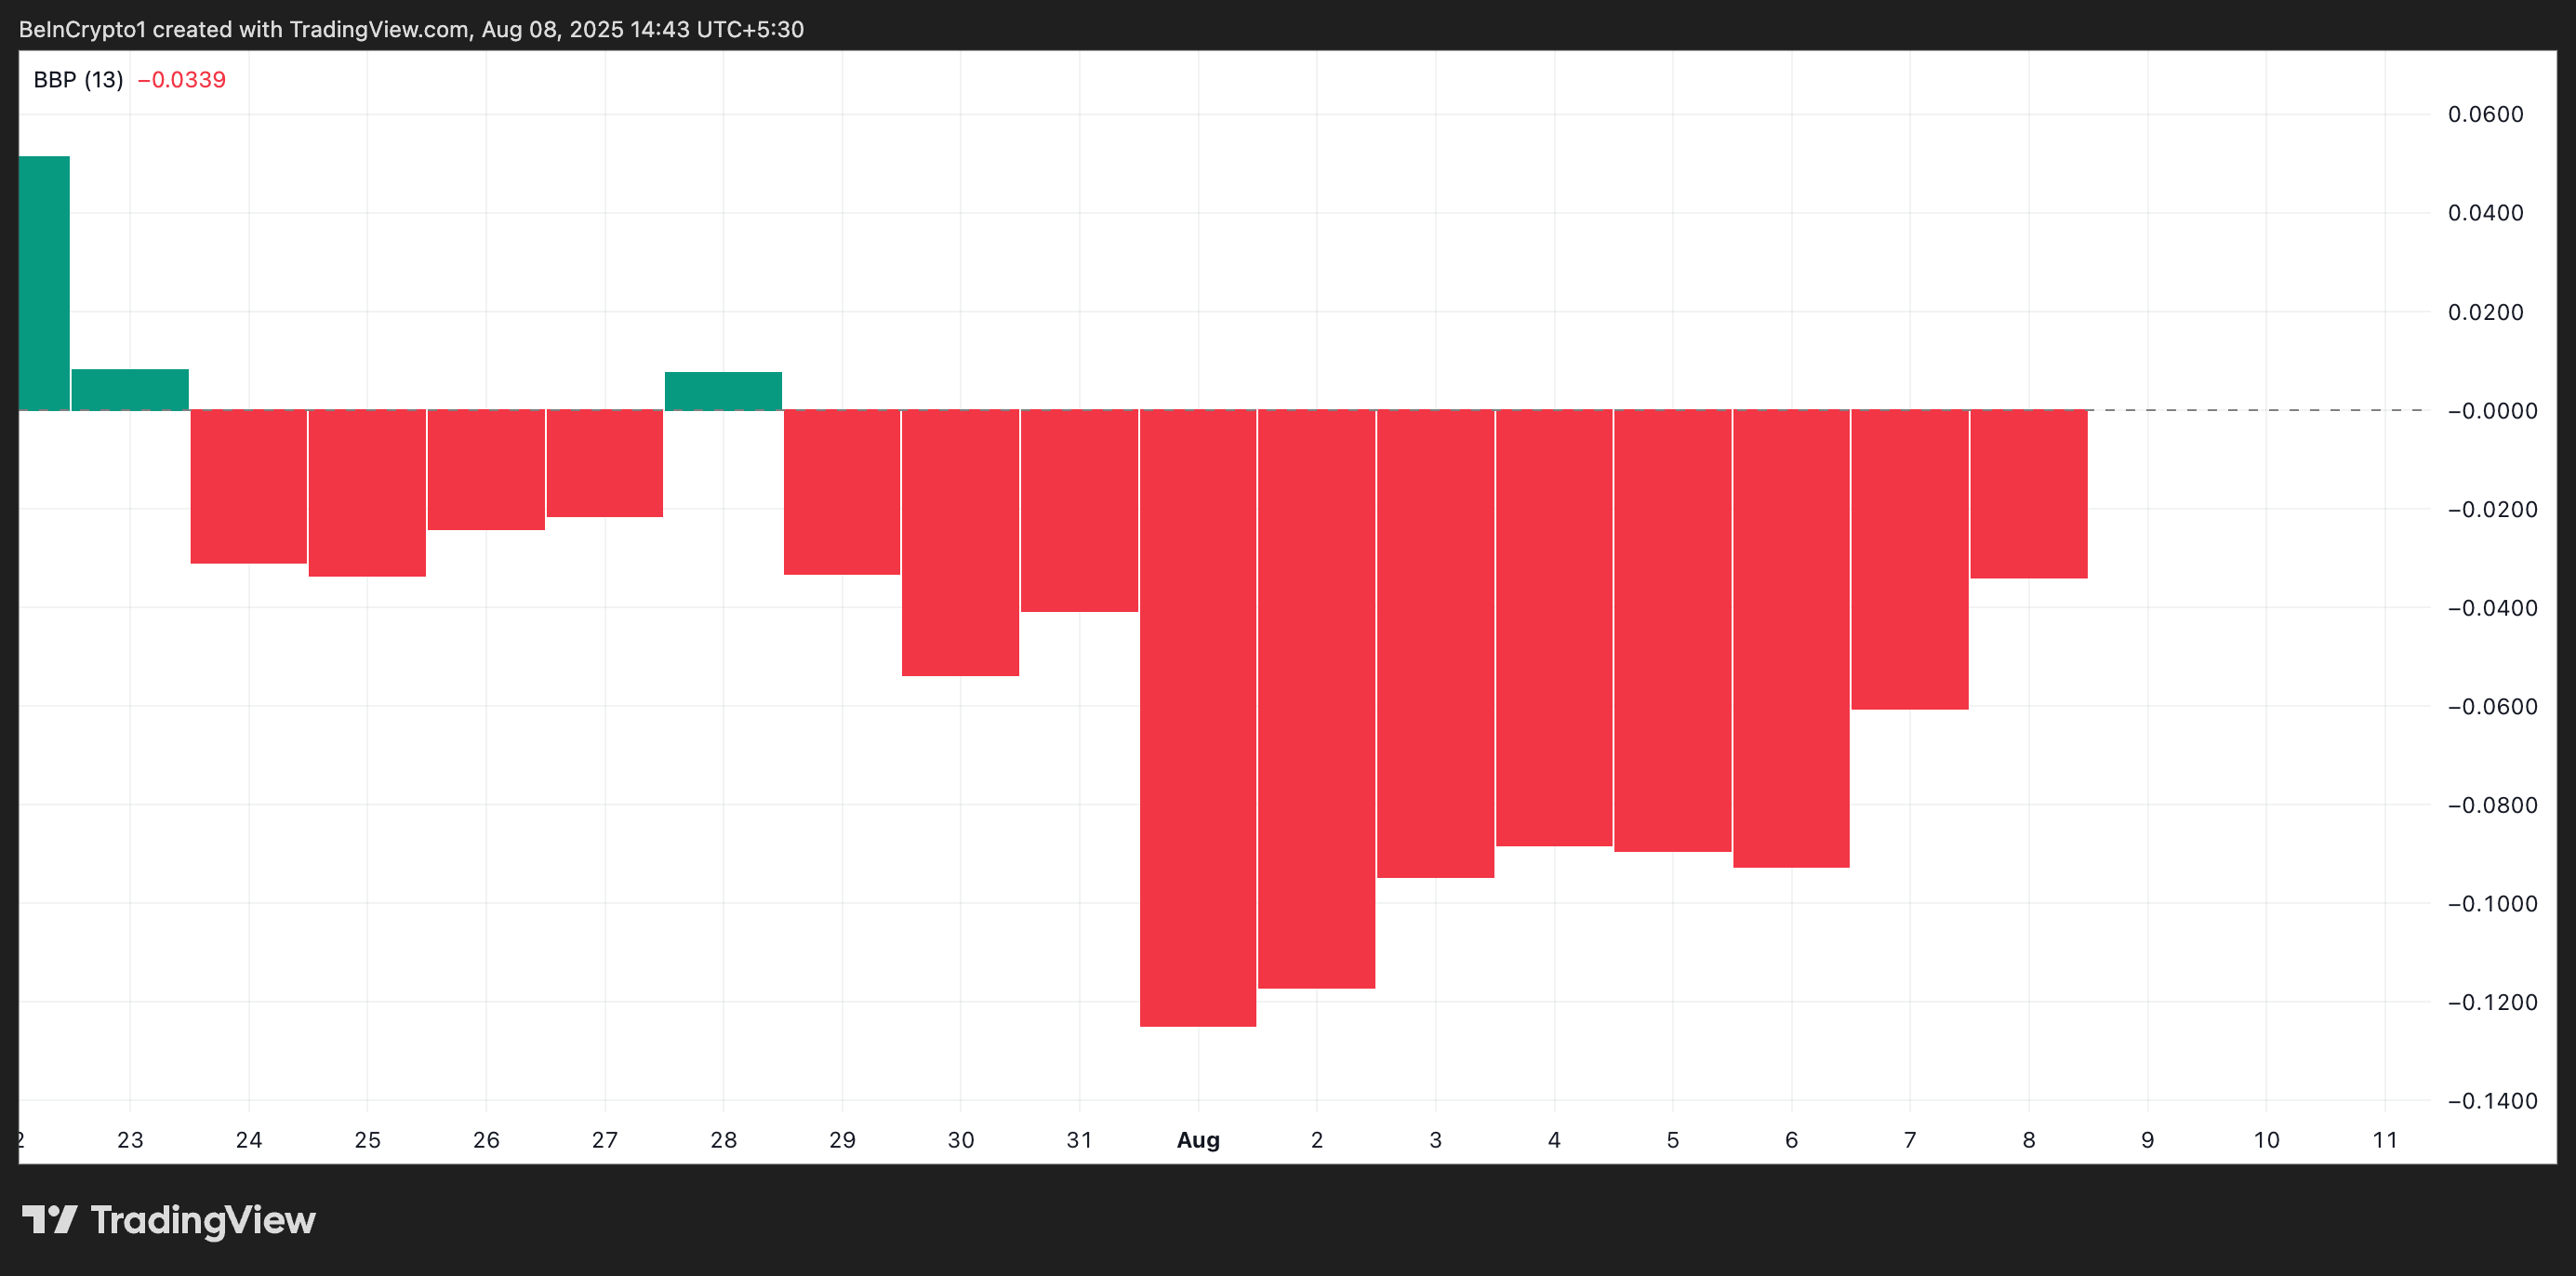
The BBTrend measures the strength and direction of a trend based on the expansion and contraction of Bollinger Bands. When it returns red bars, the asset’s price consistently closes near the lower Bollinger Band, reflecting sustained selling pressure.
However, when the sizes of these red bars start to drop, like with PI, selling pressure is easing, and the market sentiment is shifting towards buying.
PI Token’s Next Move Hinges on Demand
A sustained demand for Pi could push it above the upper range of its horizontal channel, which forms resistance at $0.37. If successfully turned into a support floor, it could pave the way for a further rally to $0.44.
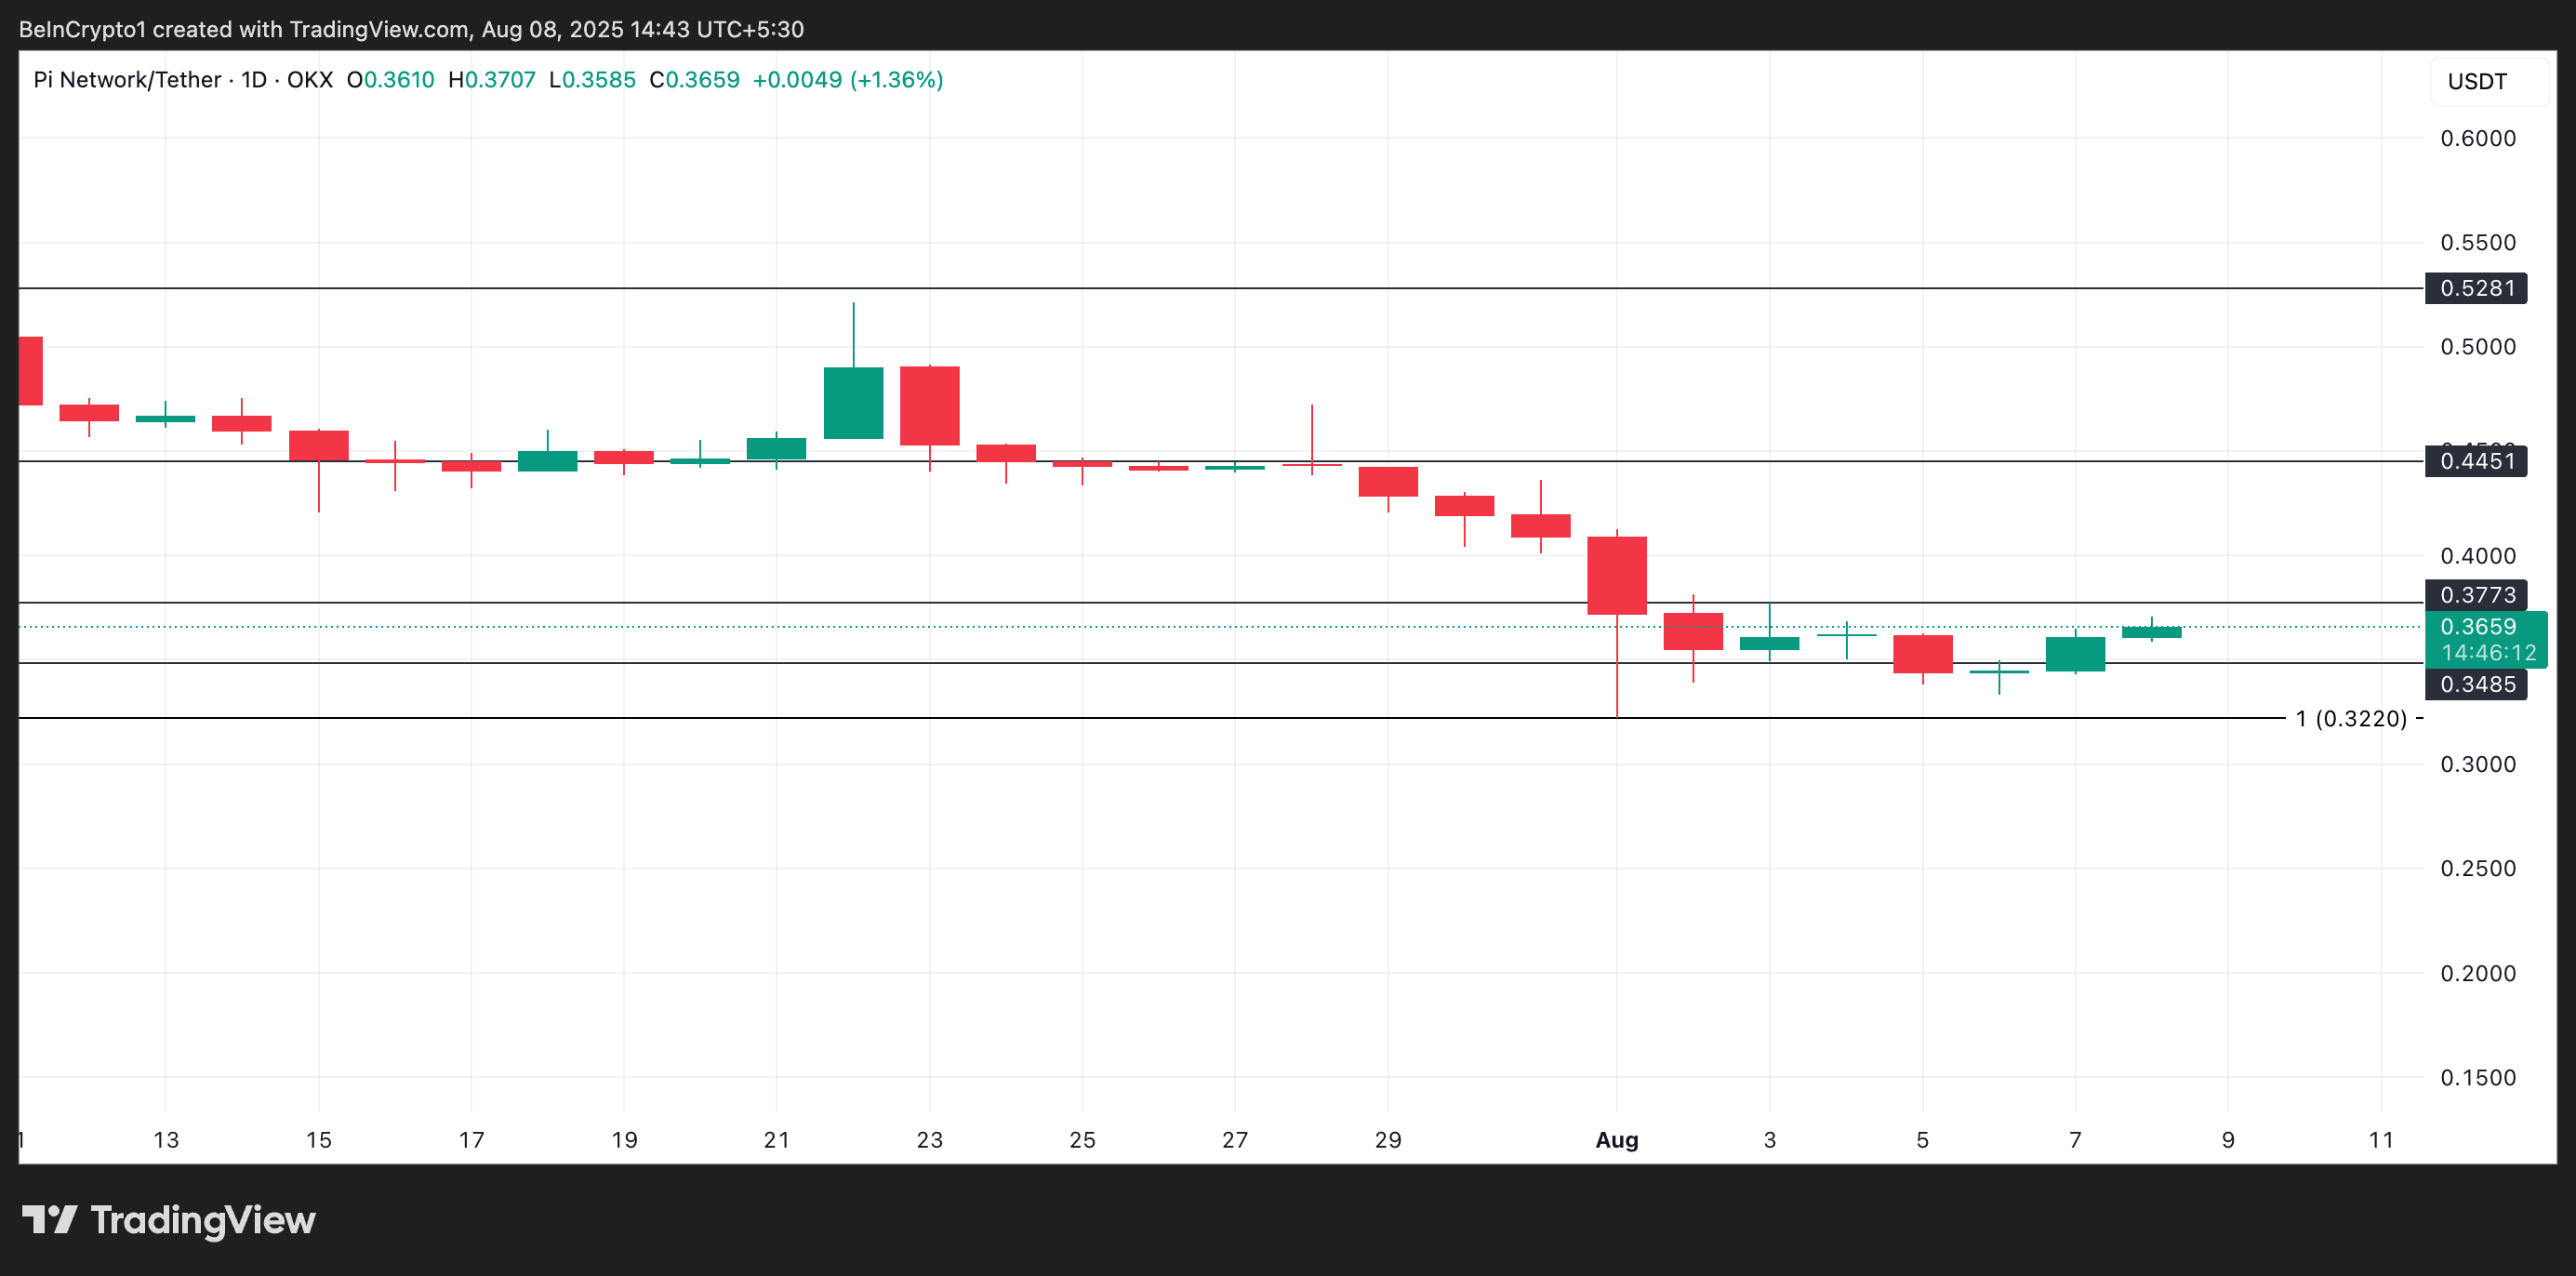
Conversely, if demand weakens again, PI could resume its sideways trend or fall under $0.34.
