Stellar (XLM) Skyrockets: 100% Rally Imminent—But Here’s the Catch

Stellar’s XLM isn’t just climbing—it’s gunning for a full-blown breakout. After months of sideways action, the coin’s chart paints a bullish picture: a 100% surge could be on the horizon. But before you FOMO in, there’s a catch.
The Bull Case: Liquidity on the Move
XLM’s price just shattered a key resistance level, flipping it into support. Volume’s spiking, and the RSI hasn’t hit overbought territory yet—classic runway for a continuation rally. Traders are eyeing the next liquidity pool like hawks.
The Risk: That One Nagging Red Flag
Macro’s still a wildcard. If BTC decides to pull a ‘2021’ and nosedive after a parabolic run, altcoins like XLM will get dragged down harder than a bagholder’s portfolio. And let’s be real—Wall Street’s ‘risk-on’ mode these days lasts about as long as a TikTok trend.
Bottom Line
XLM’s setup screams opportunity, but crypto’s a casino where the house always wins. Trade light, watch BTC’s mood swings, and maybe—just maybe—you’ll pocket gains before the next ‘macro headwind’ (read: hedge fund sell-off) hits.
Triple EMA Crossover Shows Strong Uptrend Setup
The 4-hour chart gives a clear view of trend momentum, and this is where the triple EMA crossover begins to show strength. The 20-period exponential moving average (EMA) has already crossed above both the 50 and 100 EMAs, and the 50 EMA is now closing in on a similar crossover above the 100 EMA.
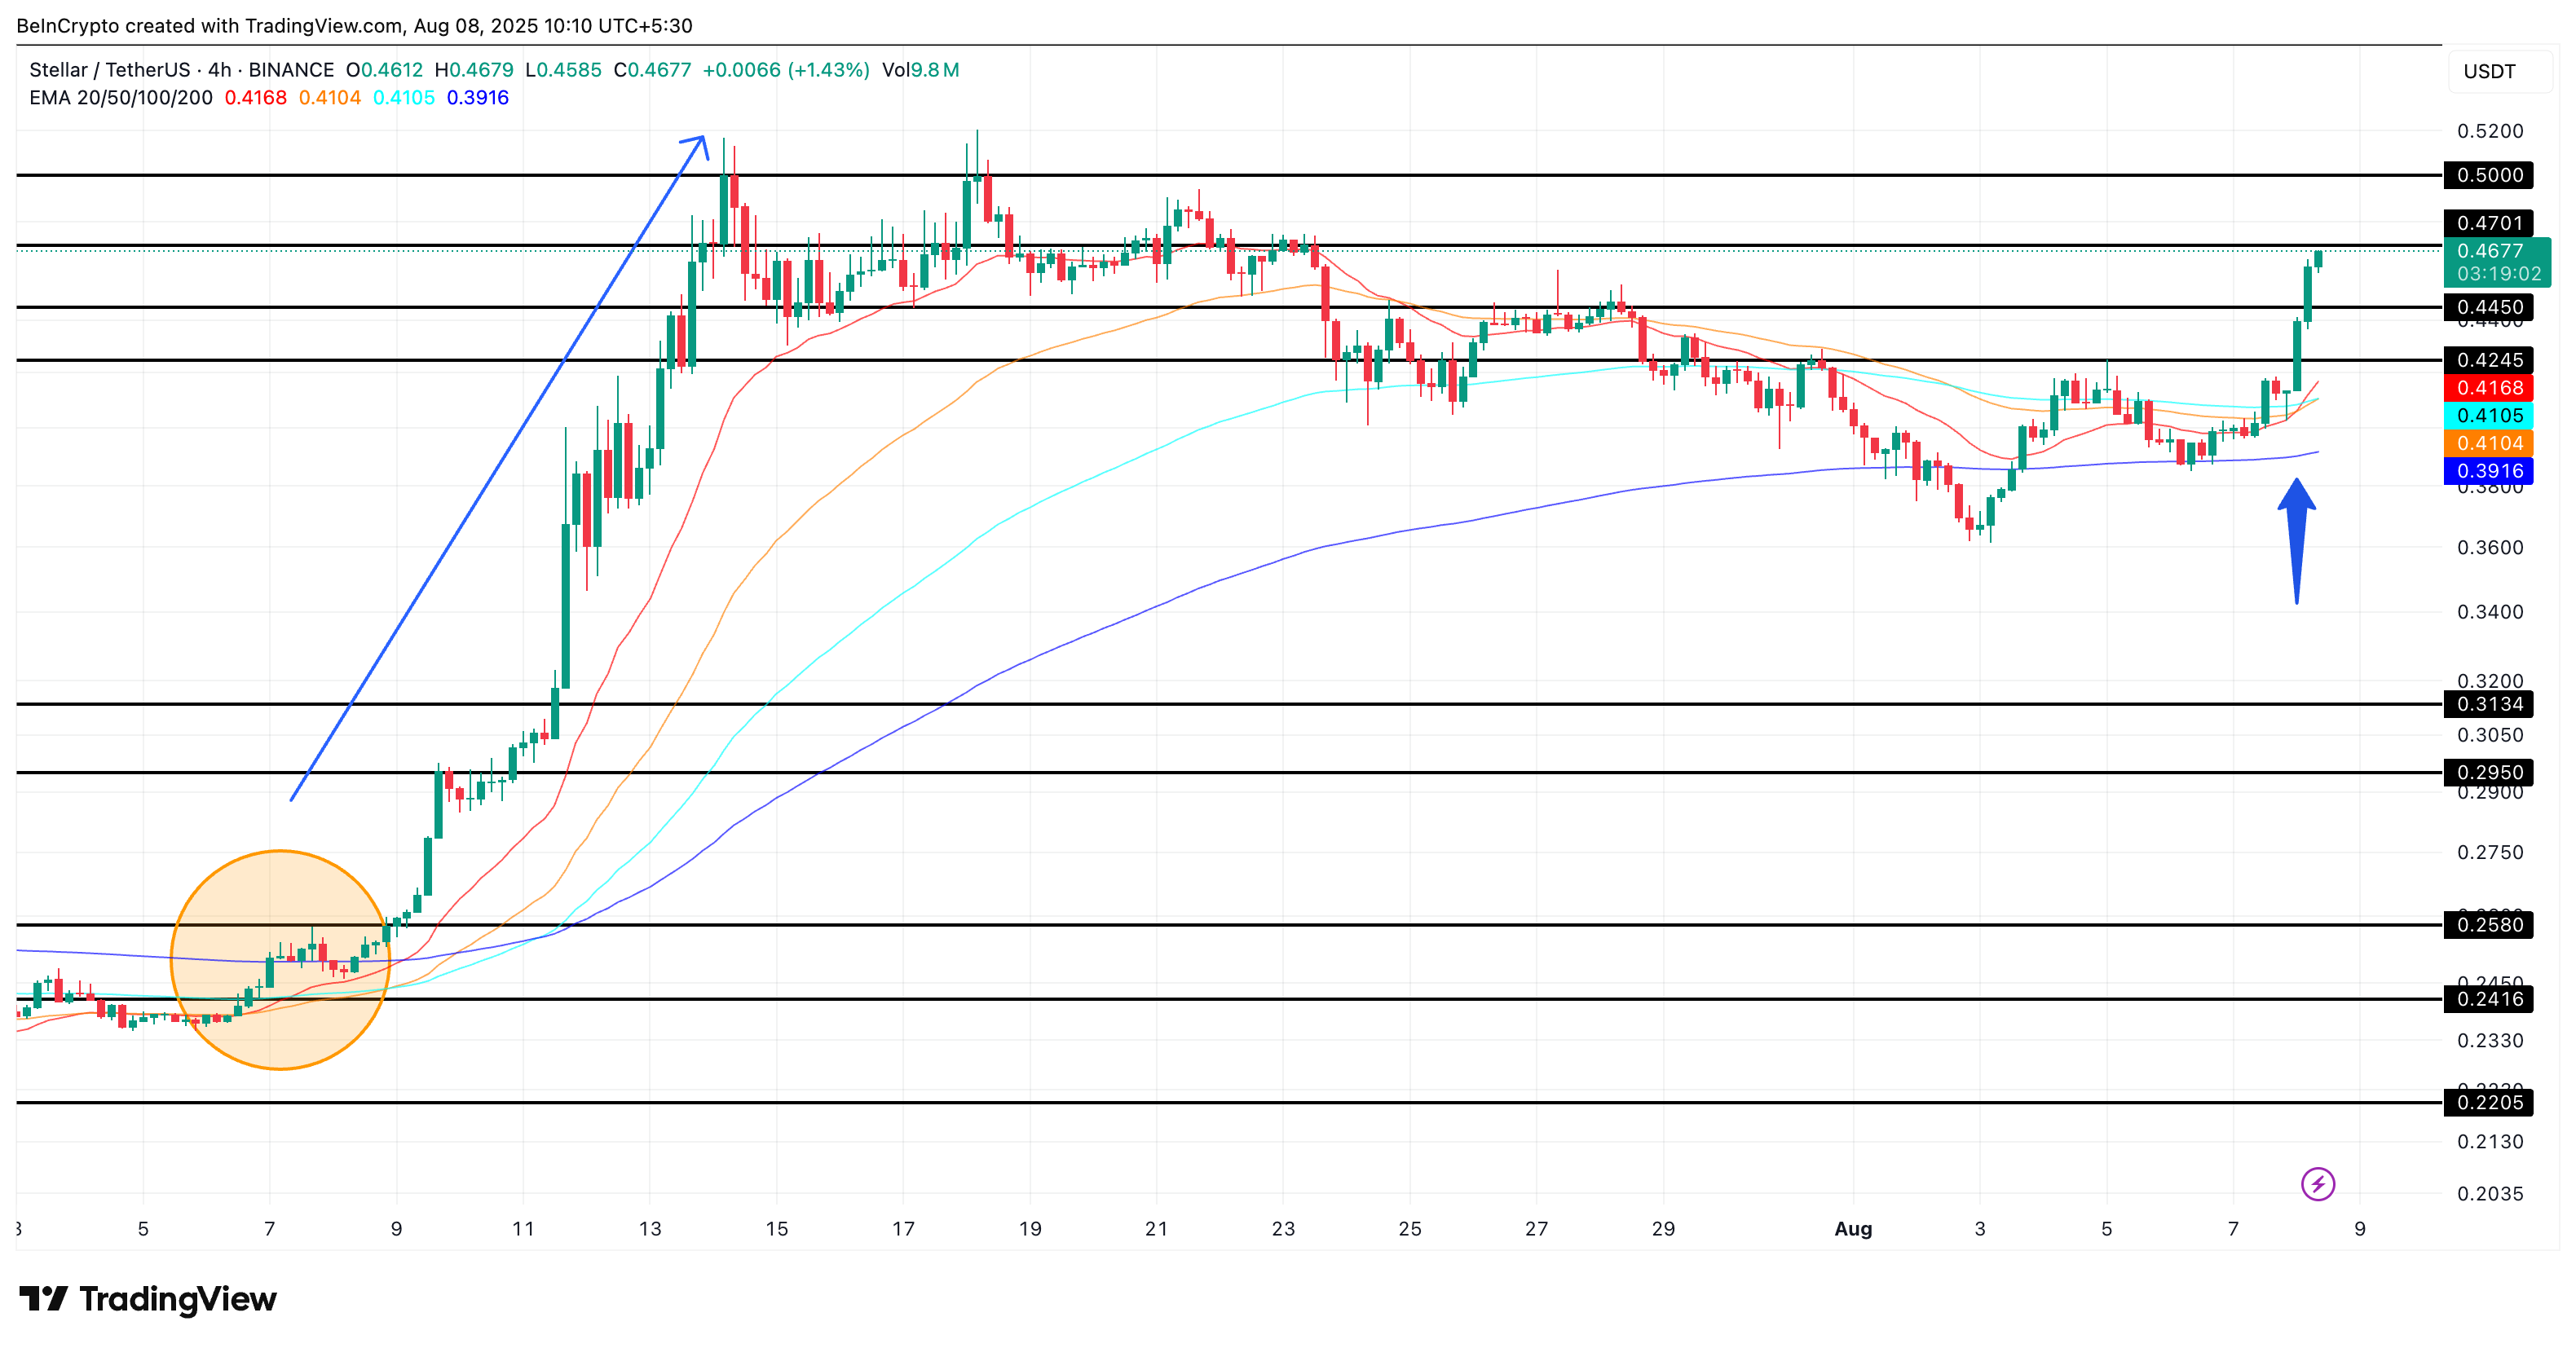
An exponential moving average (EMA) is a technical tool that smooths price data, placing more weight on recent prices. It reacts faster to recent movements compared to a simple moving average (SMA). A “Golden Cross” occurs when a shorter EMA crosses above a longer one, commonly used by traders to confirm bullish trend reversals.
Historically, the last time this triple crossover setup occurred (in early July), stellar price jumped from $0.23 to over $0.52; a 122% rally, give or take. This setup builds strong technical momentum as the price currently pushes above $0.46, with $0.50 as immediate psychological resistance and the $0.52–$0.97 range as the bullish extension zone.
: Want more token insights like this? Sign up for Editor Harsh Notariya’s Daily crypto Newsletter here.
Netflows Show Early Profit-Taking Risk
The one-week spot exchange netflow chart shows a jump from just $724,000 in the previous week to $9.12 million this week; an increase of over 1,159%. This metric tracks how much XLM is flowing onto or off exchanges. When flows rise, it usually signals traders moving tokens to exchanges to potentially sell.
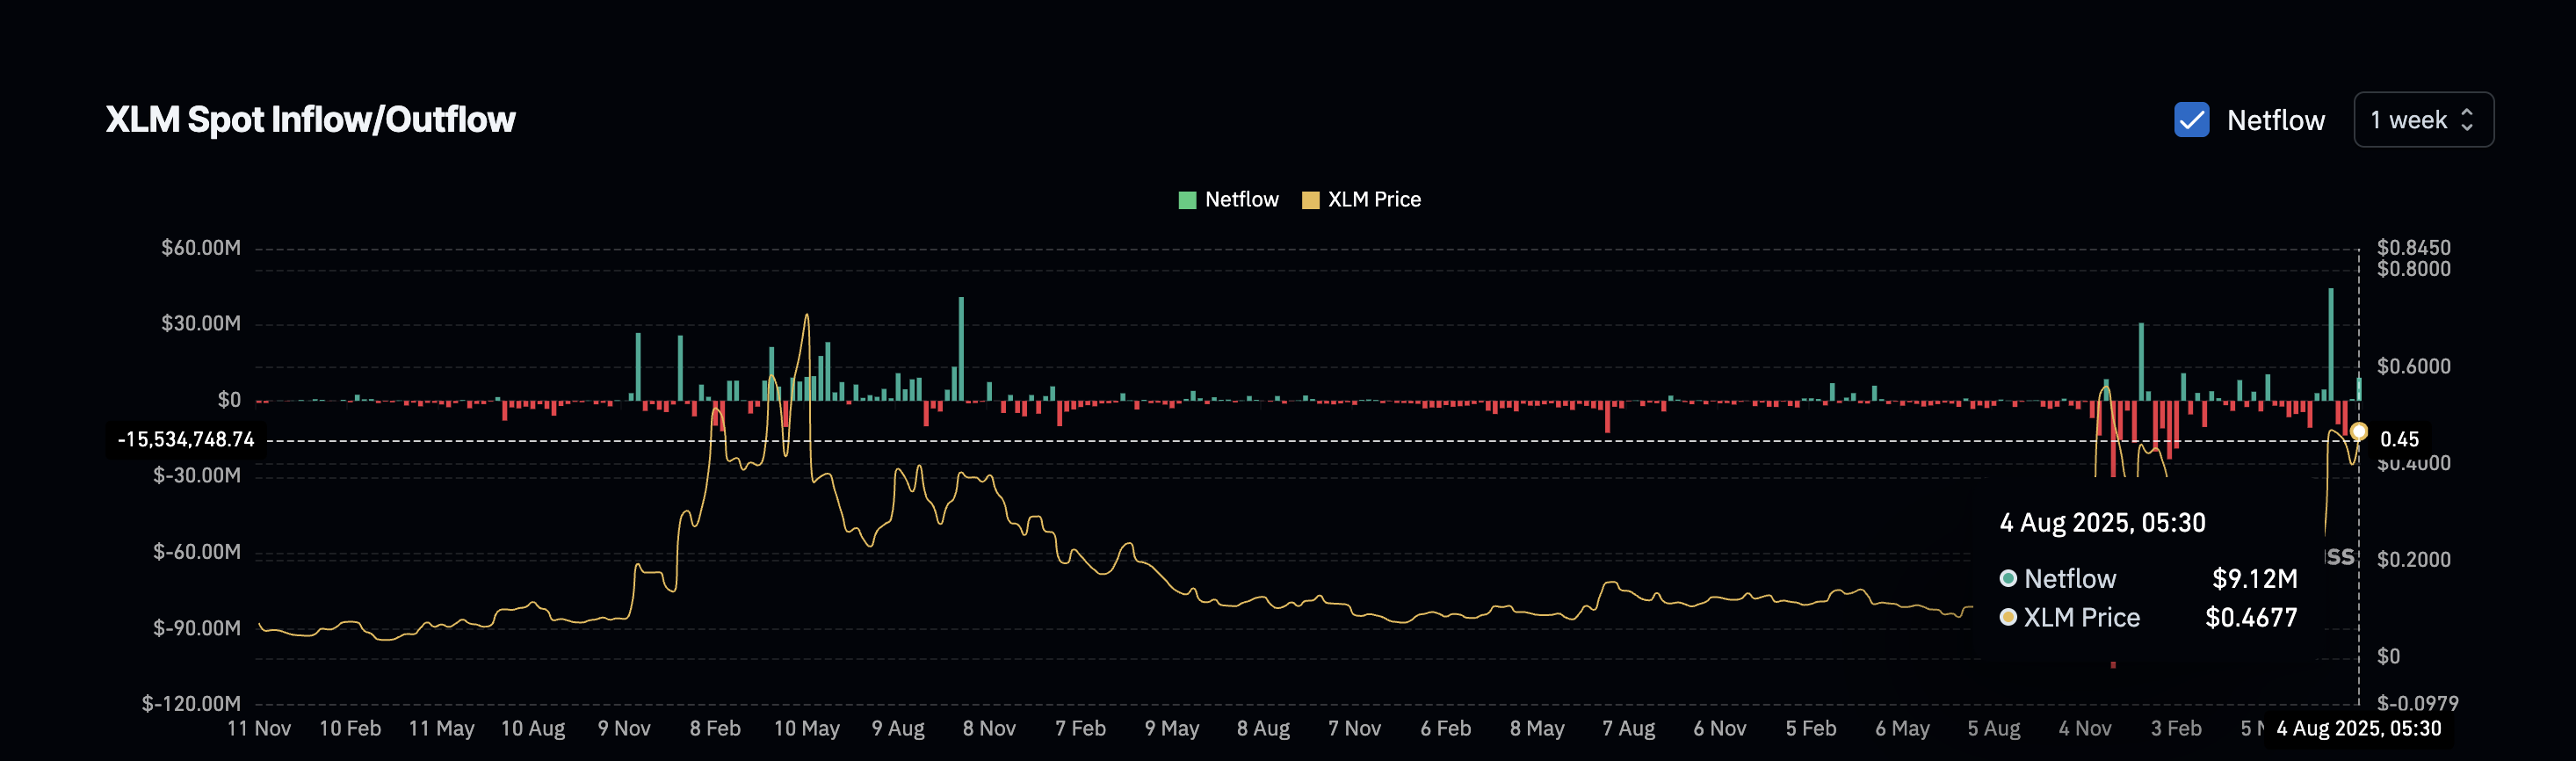
This isn’t the first time this has happened. On June 23, 2024, netflows also flipped positive, and the Stellar price dropped from $0.26 to $0.24 shortly after. Another instance was on December 30, 2024, when a similar surge (after weeks of silence) in exchange inflows led to a short-term price correction.
So while the technical setup looks bullish, traders should stay alert for potential pullbacks triggered by profit-booking pressure in the coming sessions.
Bull-Bear Power Index Validates the Stellar Price Breakout
The pole-and-flag breakout on the daily chart adds further strength to the bullish argument. It starts with a strong price run (the pole), followed by a slanted consolidation (the flag), and a breakout usually leads to another leg up.
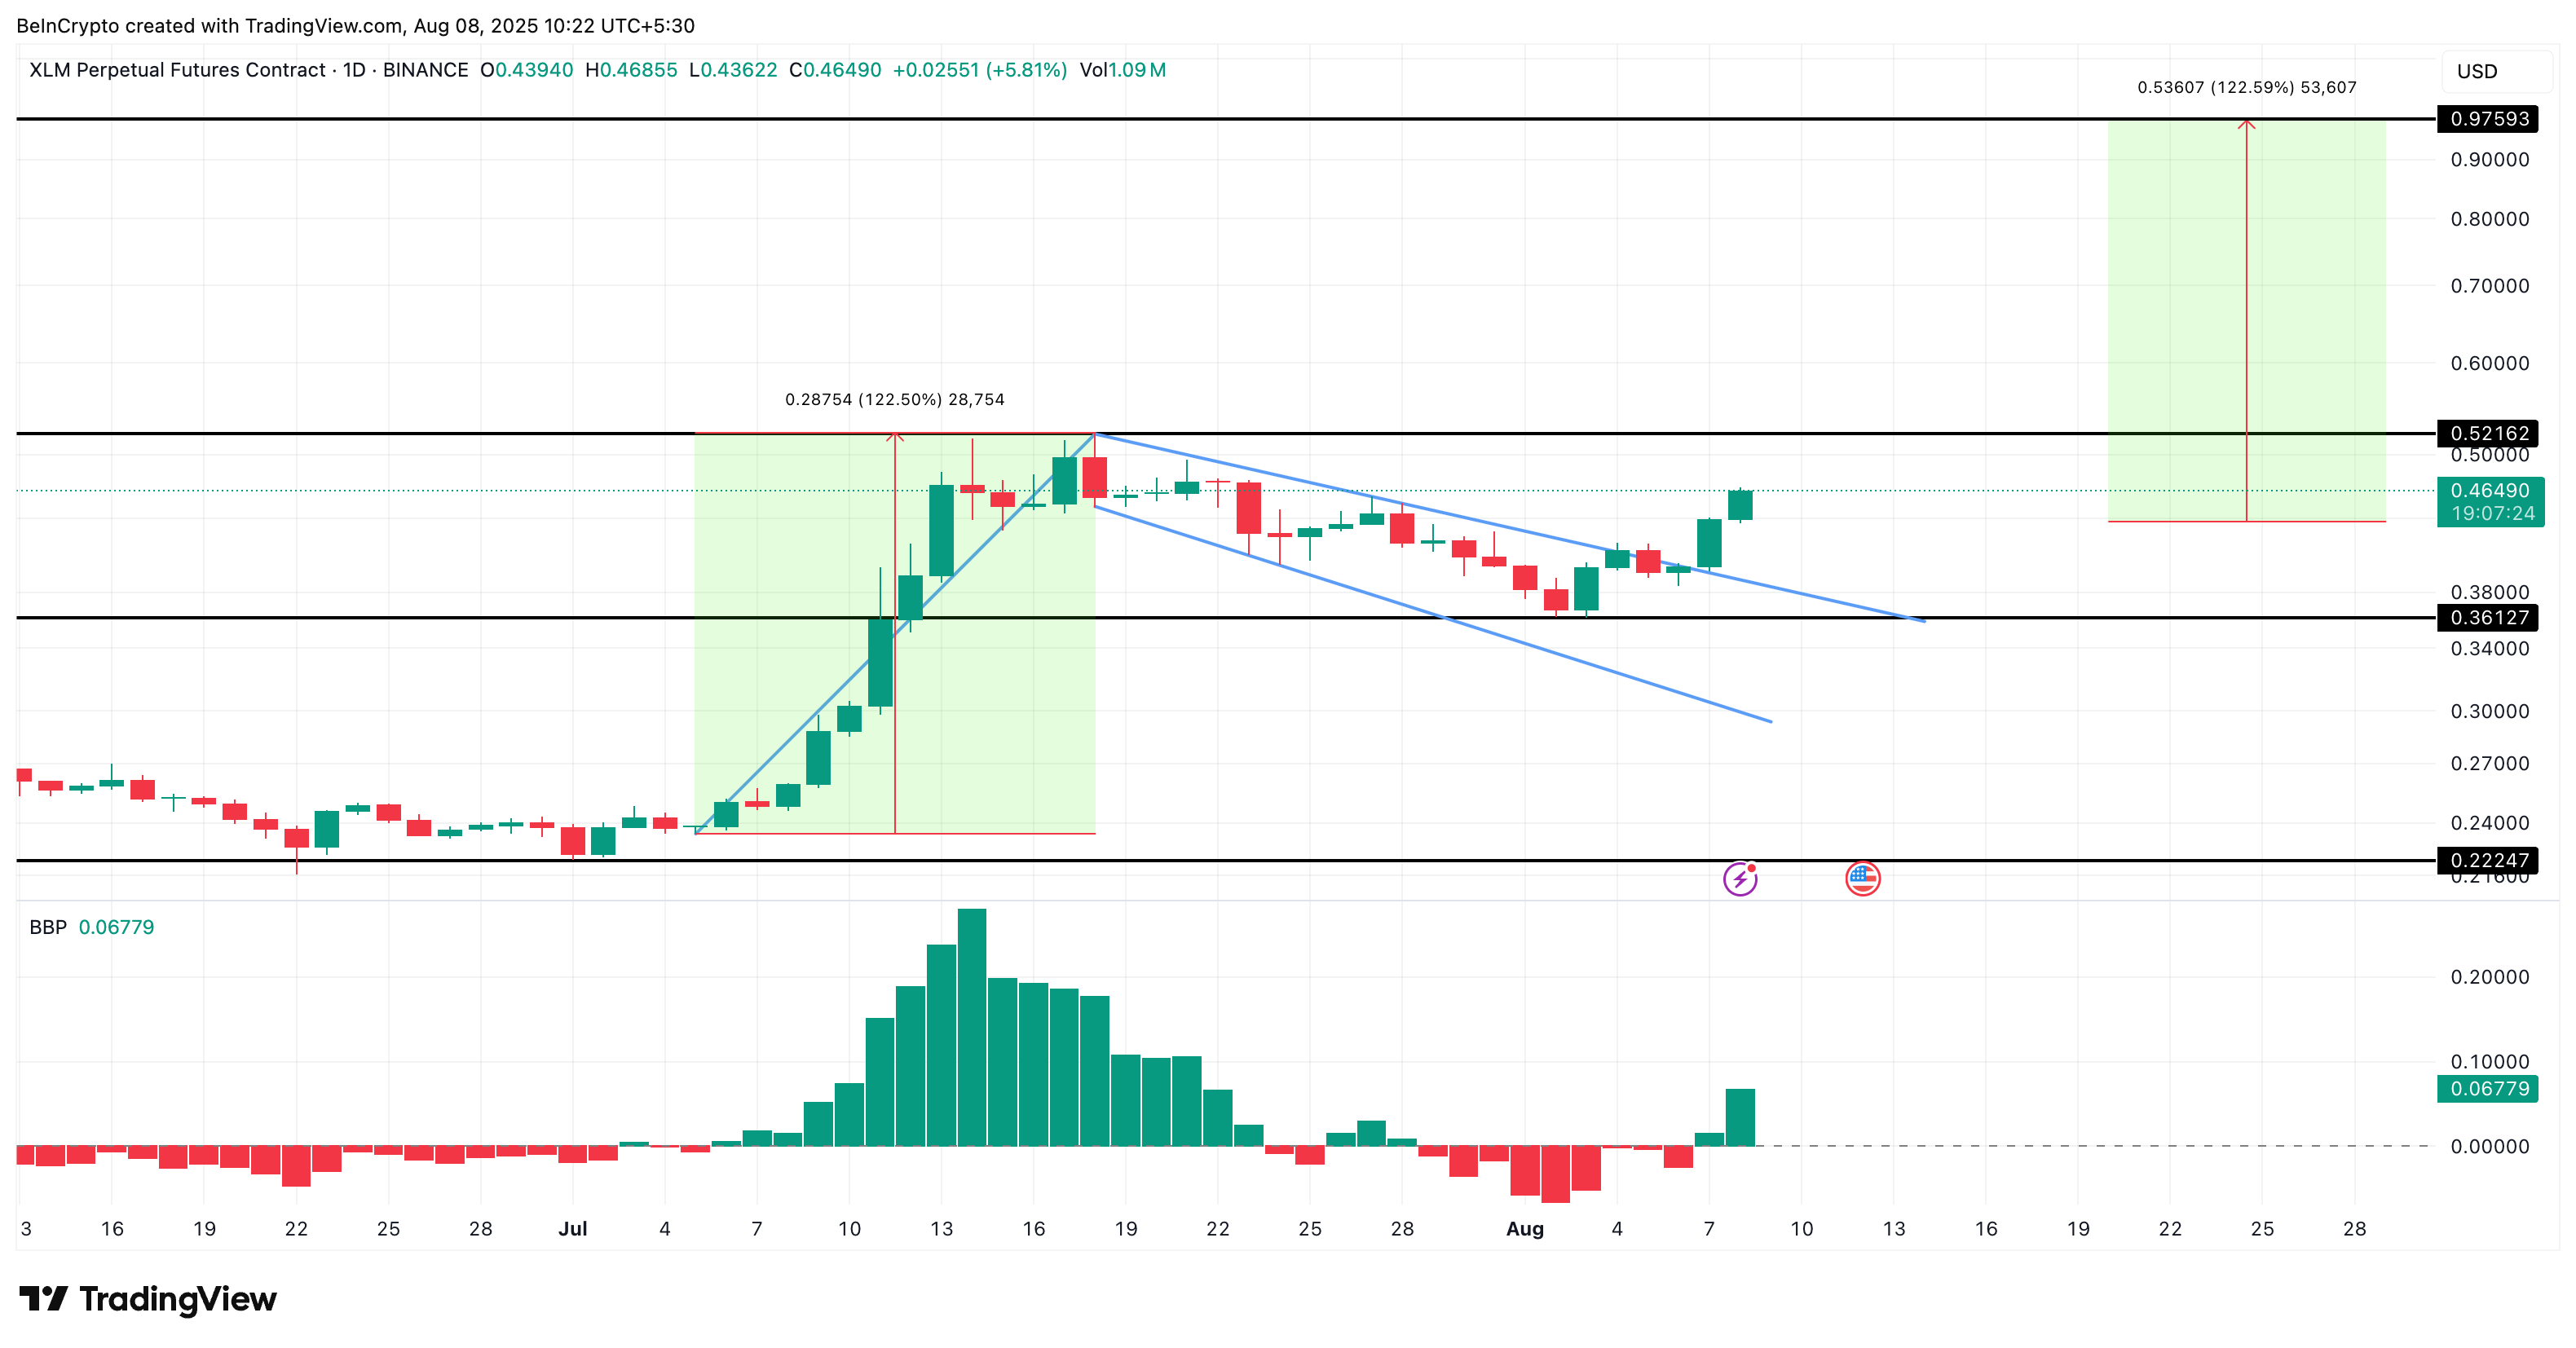
What makes this case stronger is the Bull-Bear Power (BBP) index, which has flipped green again. This indicator shows the difference between the highest price buyers were willing to pay and the lowest price sellers accepted. A green BBP during a breakout usually confirms that buying strength is returning.
With the pole measured from the $0.23 bottom to the $0.52 top, the same extension from the breakout candle’s close puts the next Stellar price target near $0.97, assuming the rally continues. Do note that the pole comprises the same XLM price rally zone that was previously mentioned as part of the concluded triple crossover. To form a clean upside move, Stellar price must first cross $0.52, the previous swing high, or the highest point of the pole.
However, the short-term bullish hypothesis gets invalidated if the stellar price falls under $0.36, primarily led by increased selling pressure, as highlighted earlier.
