XLM Primed for a Breakout August: 2 Catalysts You Can’t Ignore

Stellar's XLM is flashing bullish signals as August kicks off—here's what could send it soaring.
Factor 1: Network Upgrades Hit Critical Mass
Protocol improvements slated for mid-month promise faster settlements and lower costs. Builders are already stacking XLM in anticipation.
Factor 2: Institutional FOMO Brewing
With Ripple's legal saga nearing conclusion, cross-border payment tokens are back in vogue. Guess which altcoin quietly doubled its enterprise partnerships last quarter?
Of course, this could all be another 'institutional adoption' narrative that conveniently lines whales' pockets—but hey, those trendlines don't lie. Yet.
XLM Prepares for Next Push
A bull flag pattern is formed after a strong price rally when the asset enters a brief period of consolidation, during which it trades within a horizontal channel.
This phase resembles a “flag” on the chart and suggests that buyers are taking a breather before pushing prices higher again. The pattern is considered a bullish continuation, meaning it is likely to result in another upward leg once the consolidation ends and a breakout occurs.
XLM’s recent price action follows this structure. Between July 8 and July 14, the altcoin surged by 84%, marking a strong upward move (forming a flagpole). Since then, XLM has entered a consolidation phase, trading within a horizontal channel on the daily chart.
: Want more token insights like this? Sign up for Editor Harsh Notariya’s Daily crypto Newsletter here.
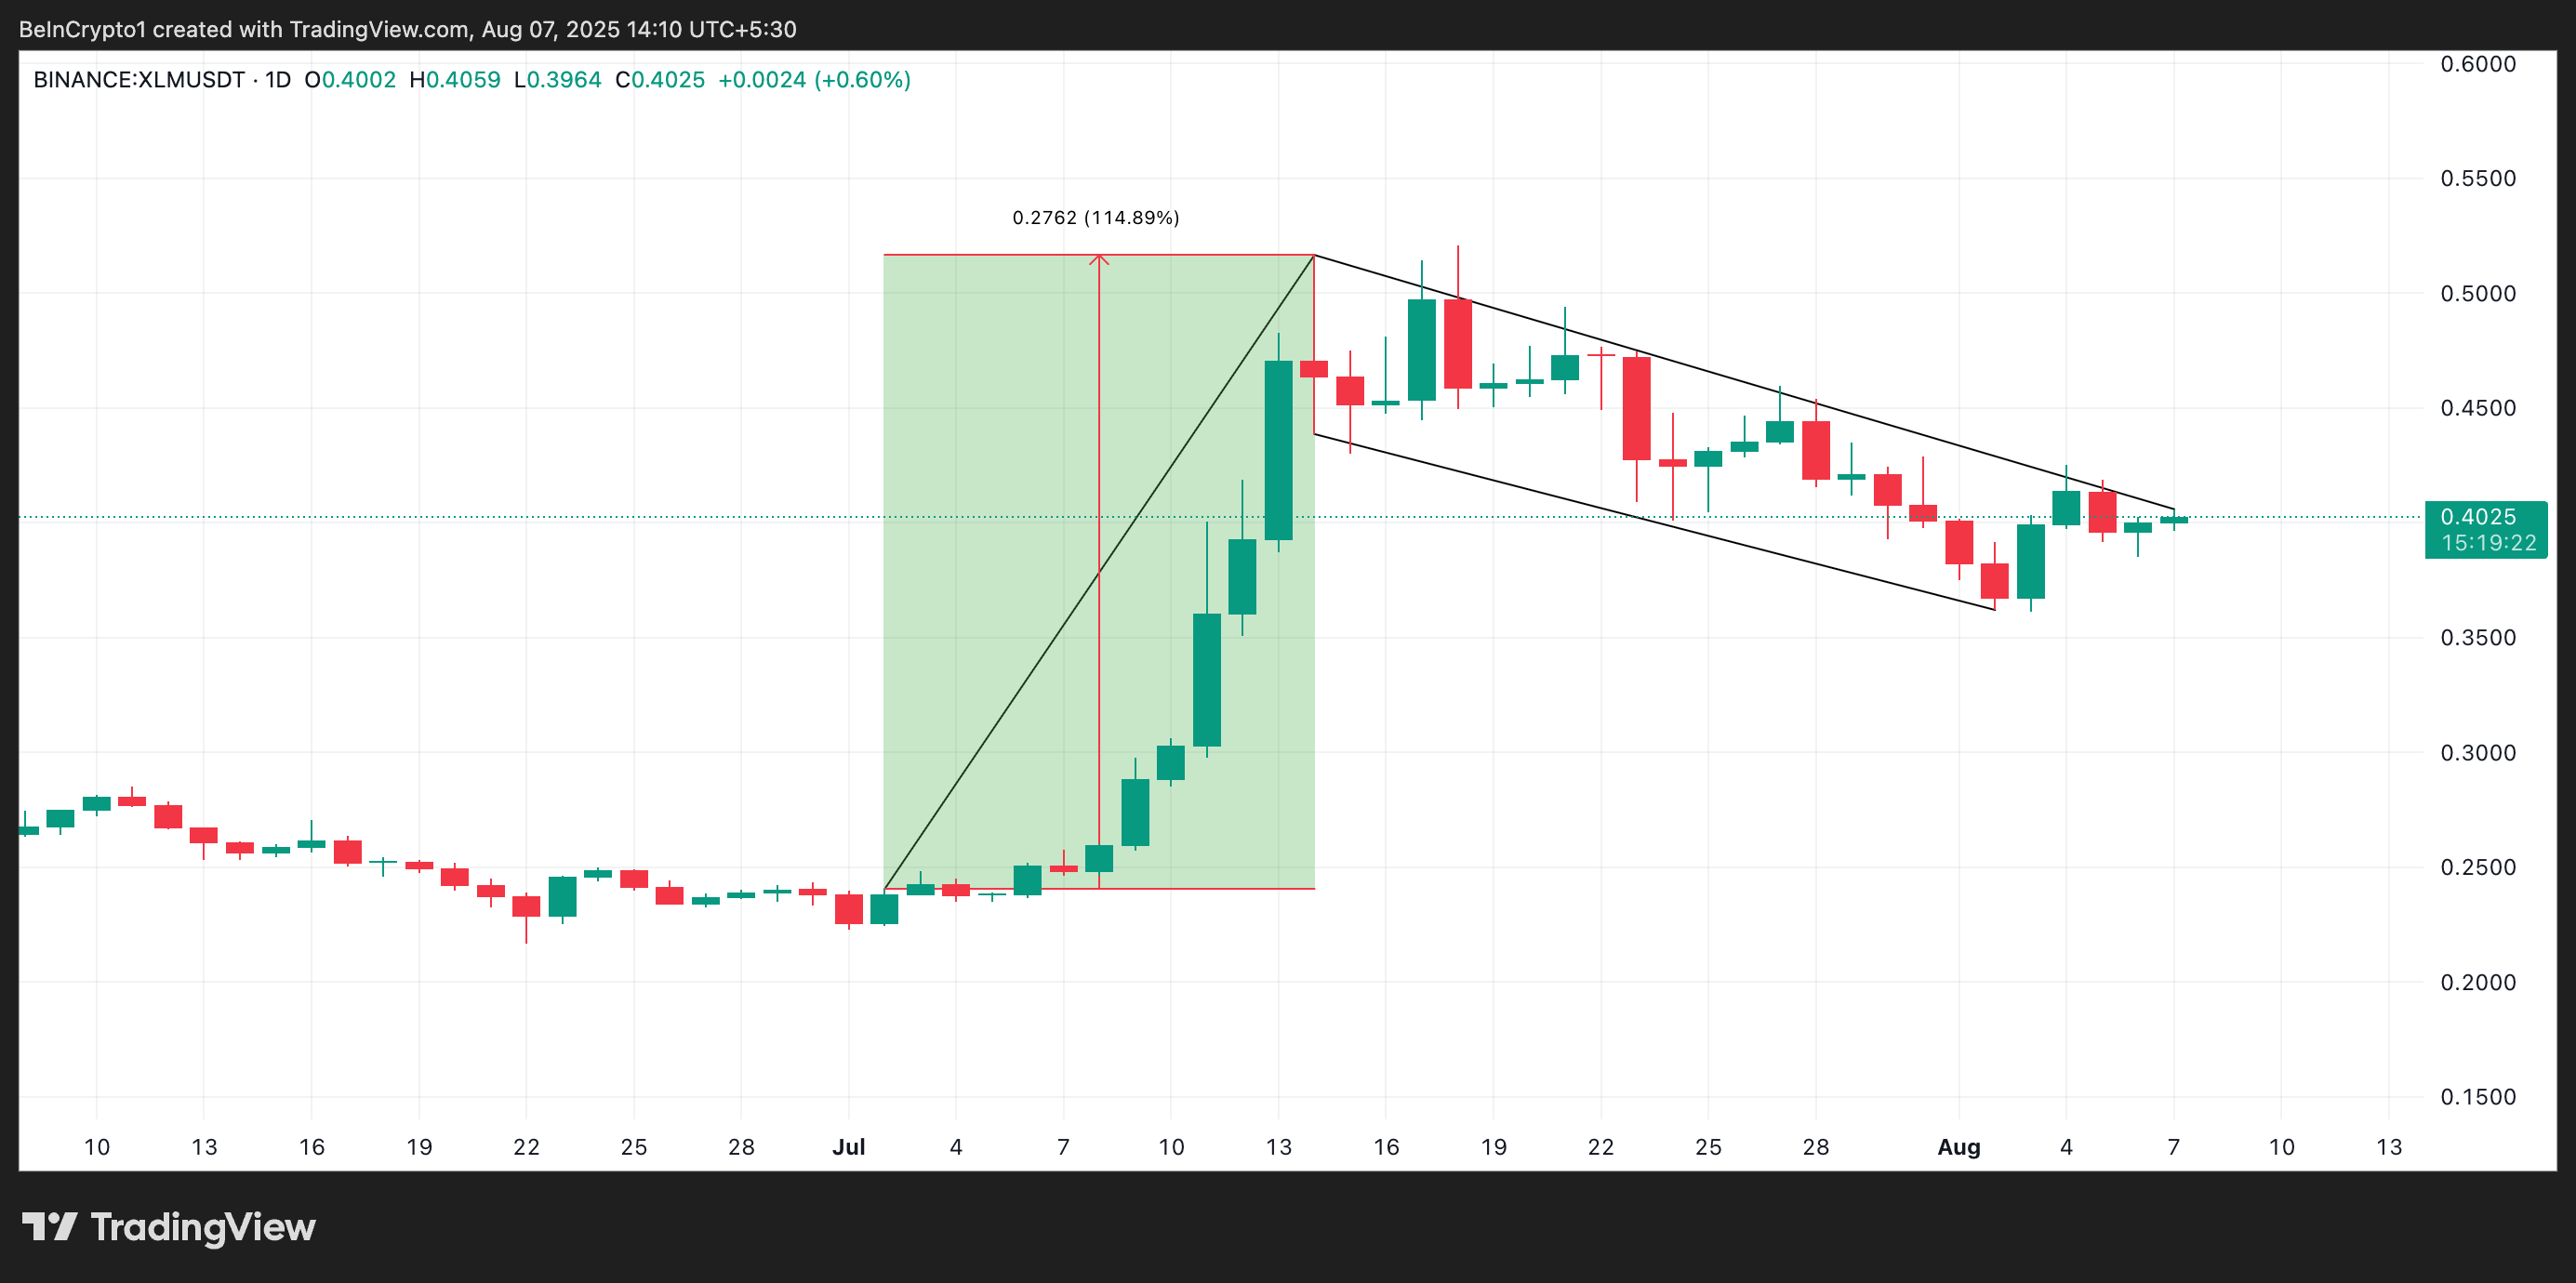
This formation suggests that bulls are not backing down, but rather regrouping. The consolidation reflects a healthy cooldown after the uptick, allowing the market to rebuild bullish sentiment.
Moreover, XLM’s liquidation heatmap shows a significant concentration of liquidity at the $0.42 price zone. This cluster sits above XLM’s current trading range, further strengthening the case for a potential upward move.
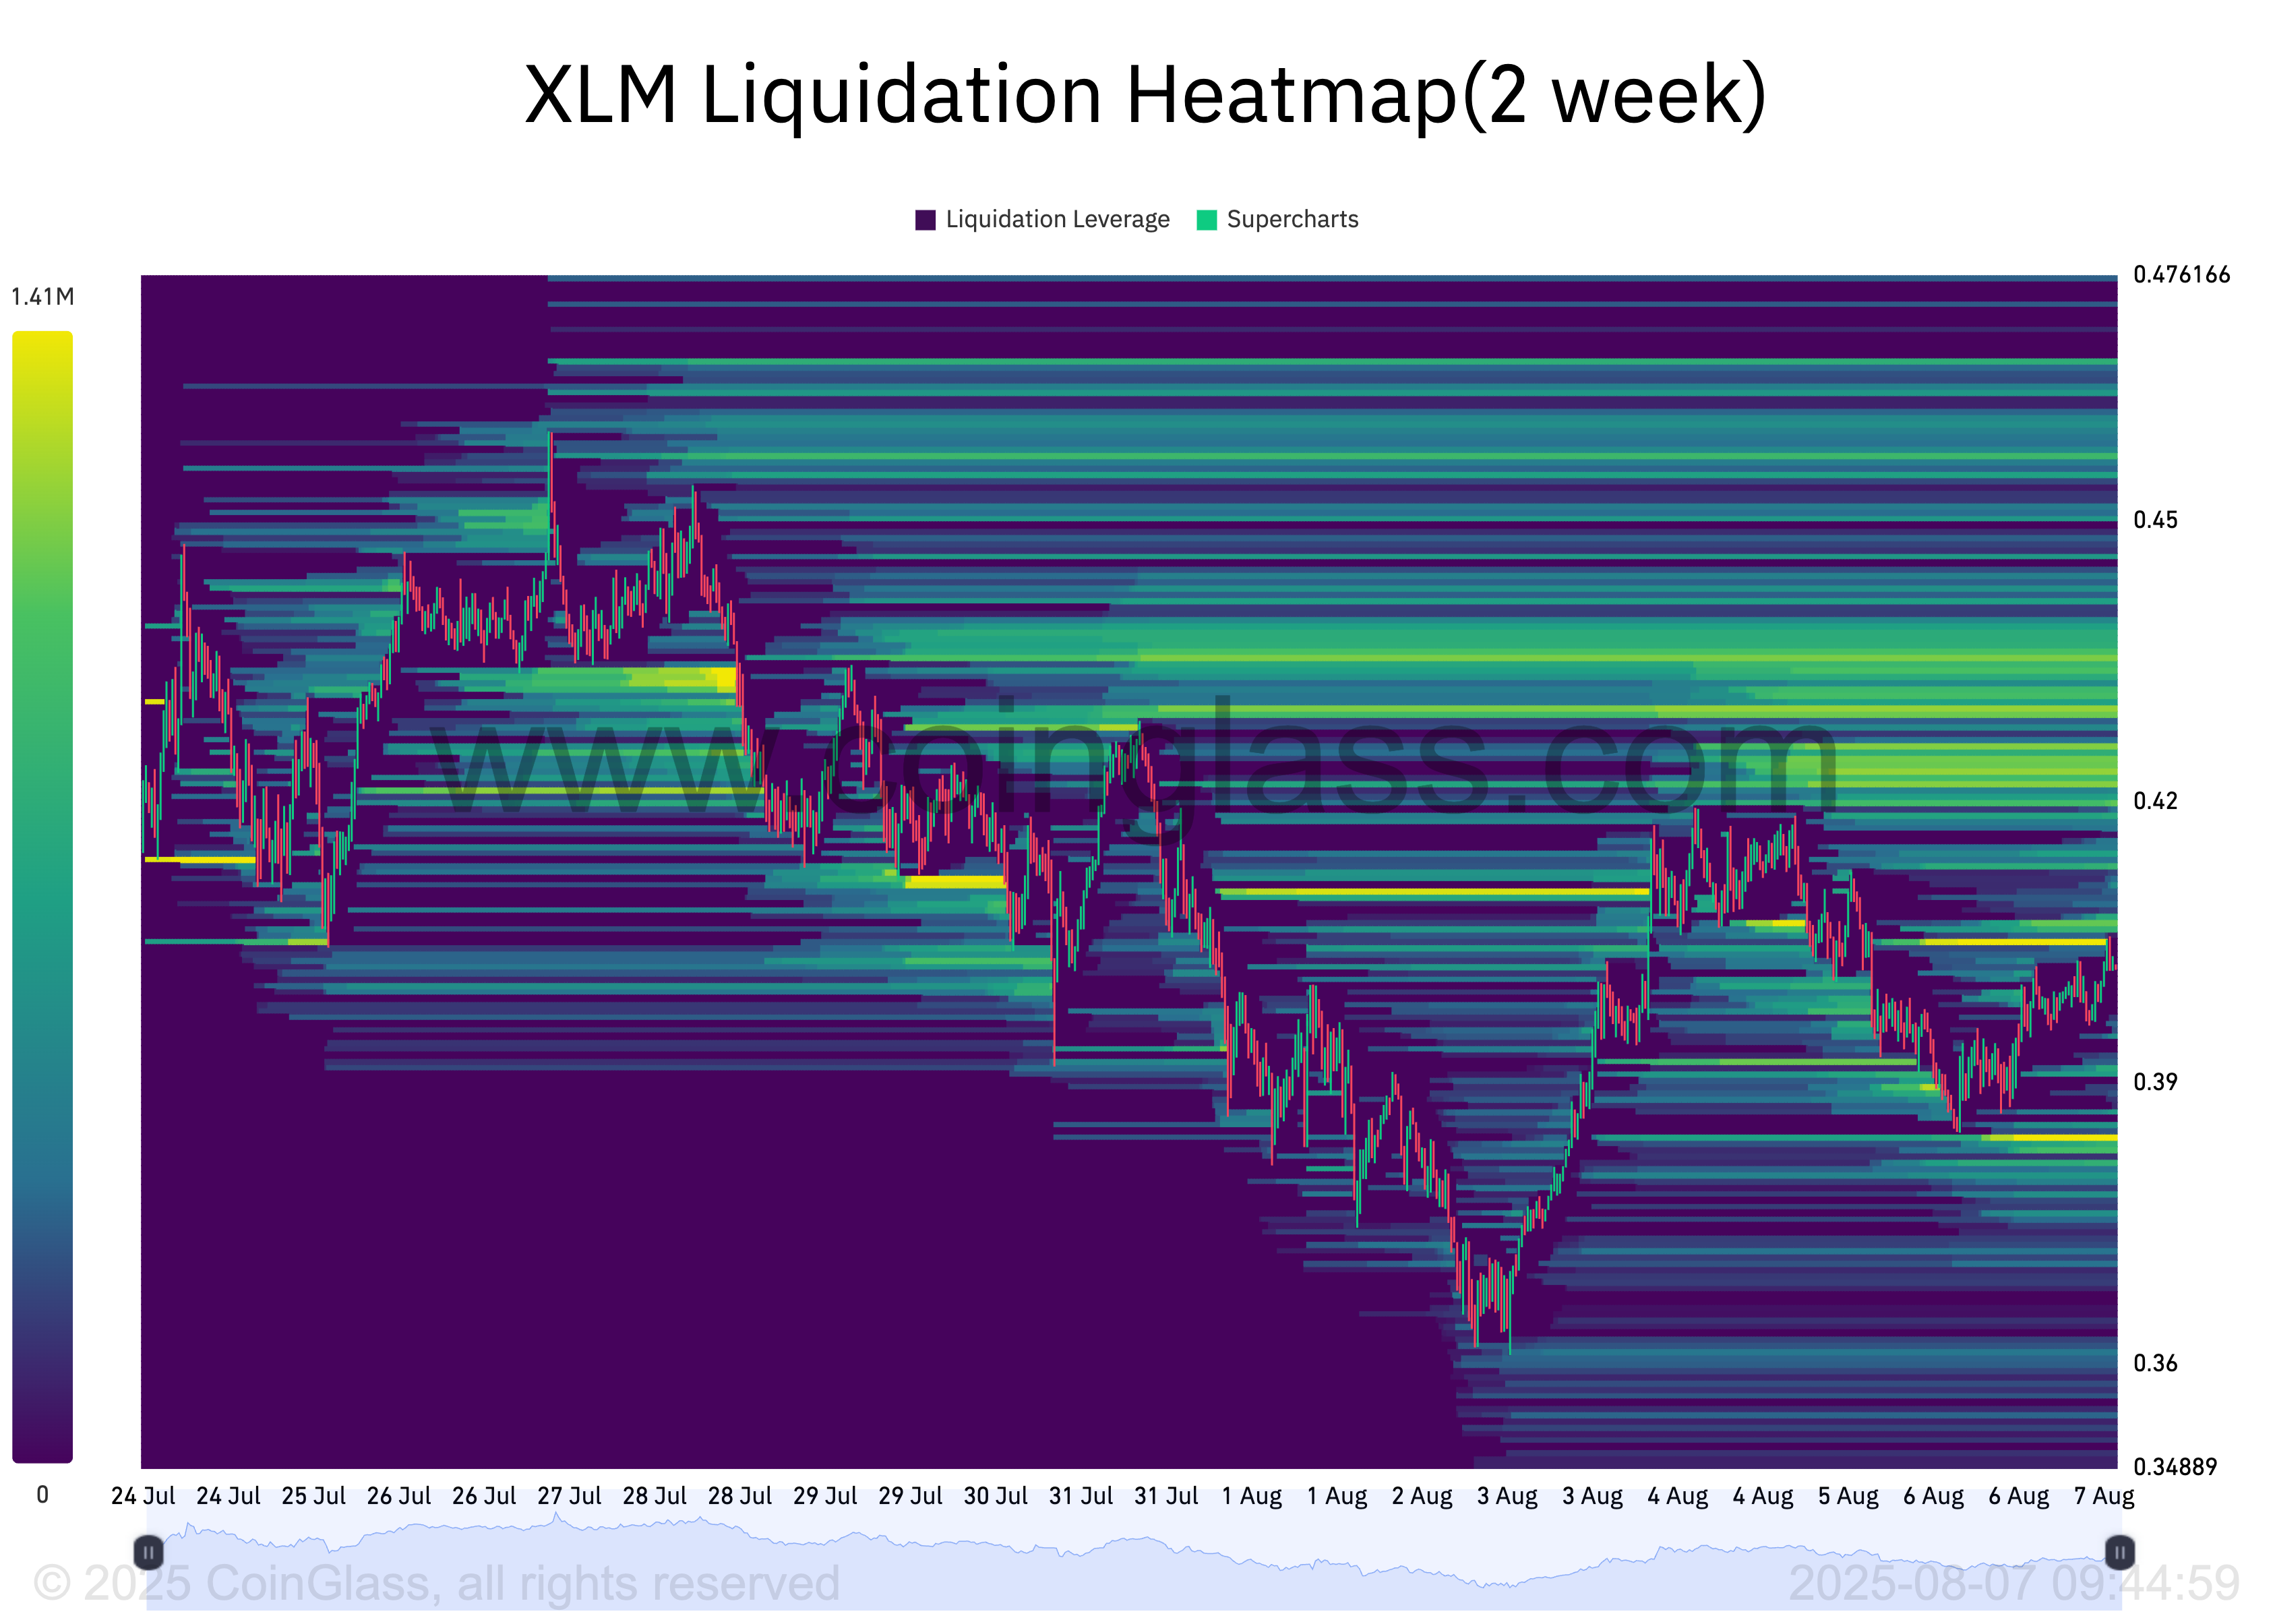
Traders use liquidity heatmaps to visualize where large numbers of stop-losses, take-profits, and liquidation levels are positioned. These clusters act as magnets for price, especially in highly Leveraged markets.
For XLM, the visible cluster NEAR $0.42 hints at a potential move toward that price point. This could drive momentum and serve as the first step toward a broader price surge.
Can XLM Hold the Line?
Generally, when a bull flag pattern forms, it signals that after a brief period of consolidation, the asset is likely to continue its prior uptrend. The expected move following a breakout is often equal in height to the initial rally (the “flagpole”).
If this technical setup holds, XLM could be on track for a rally toward $0.67, aligning with the measured target.
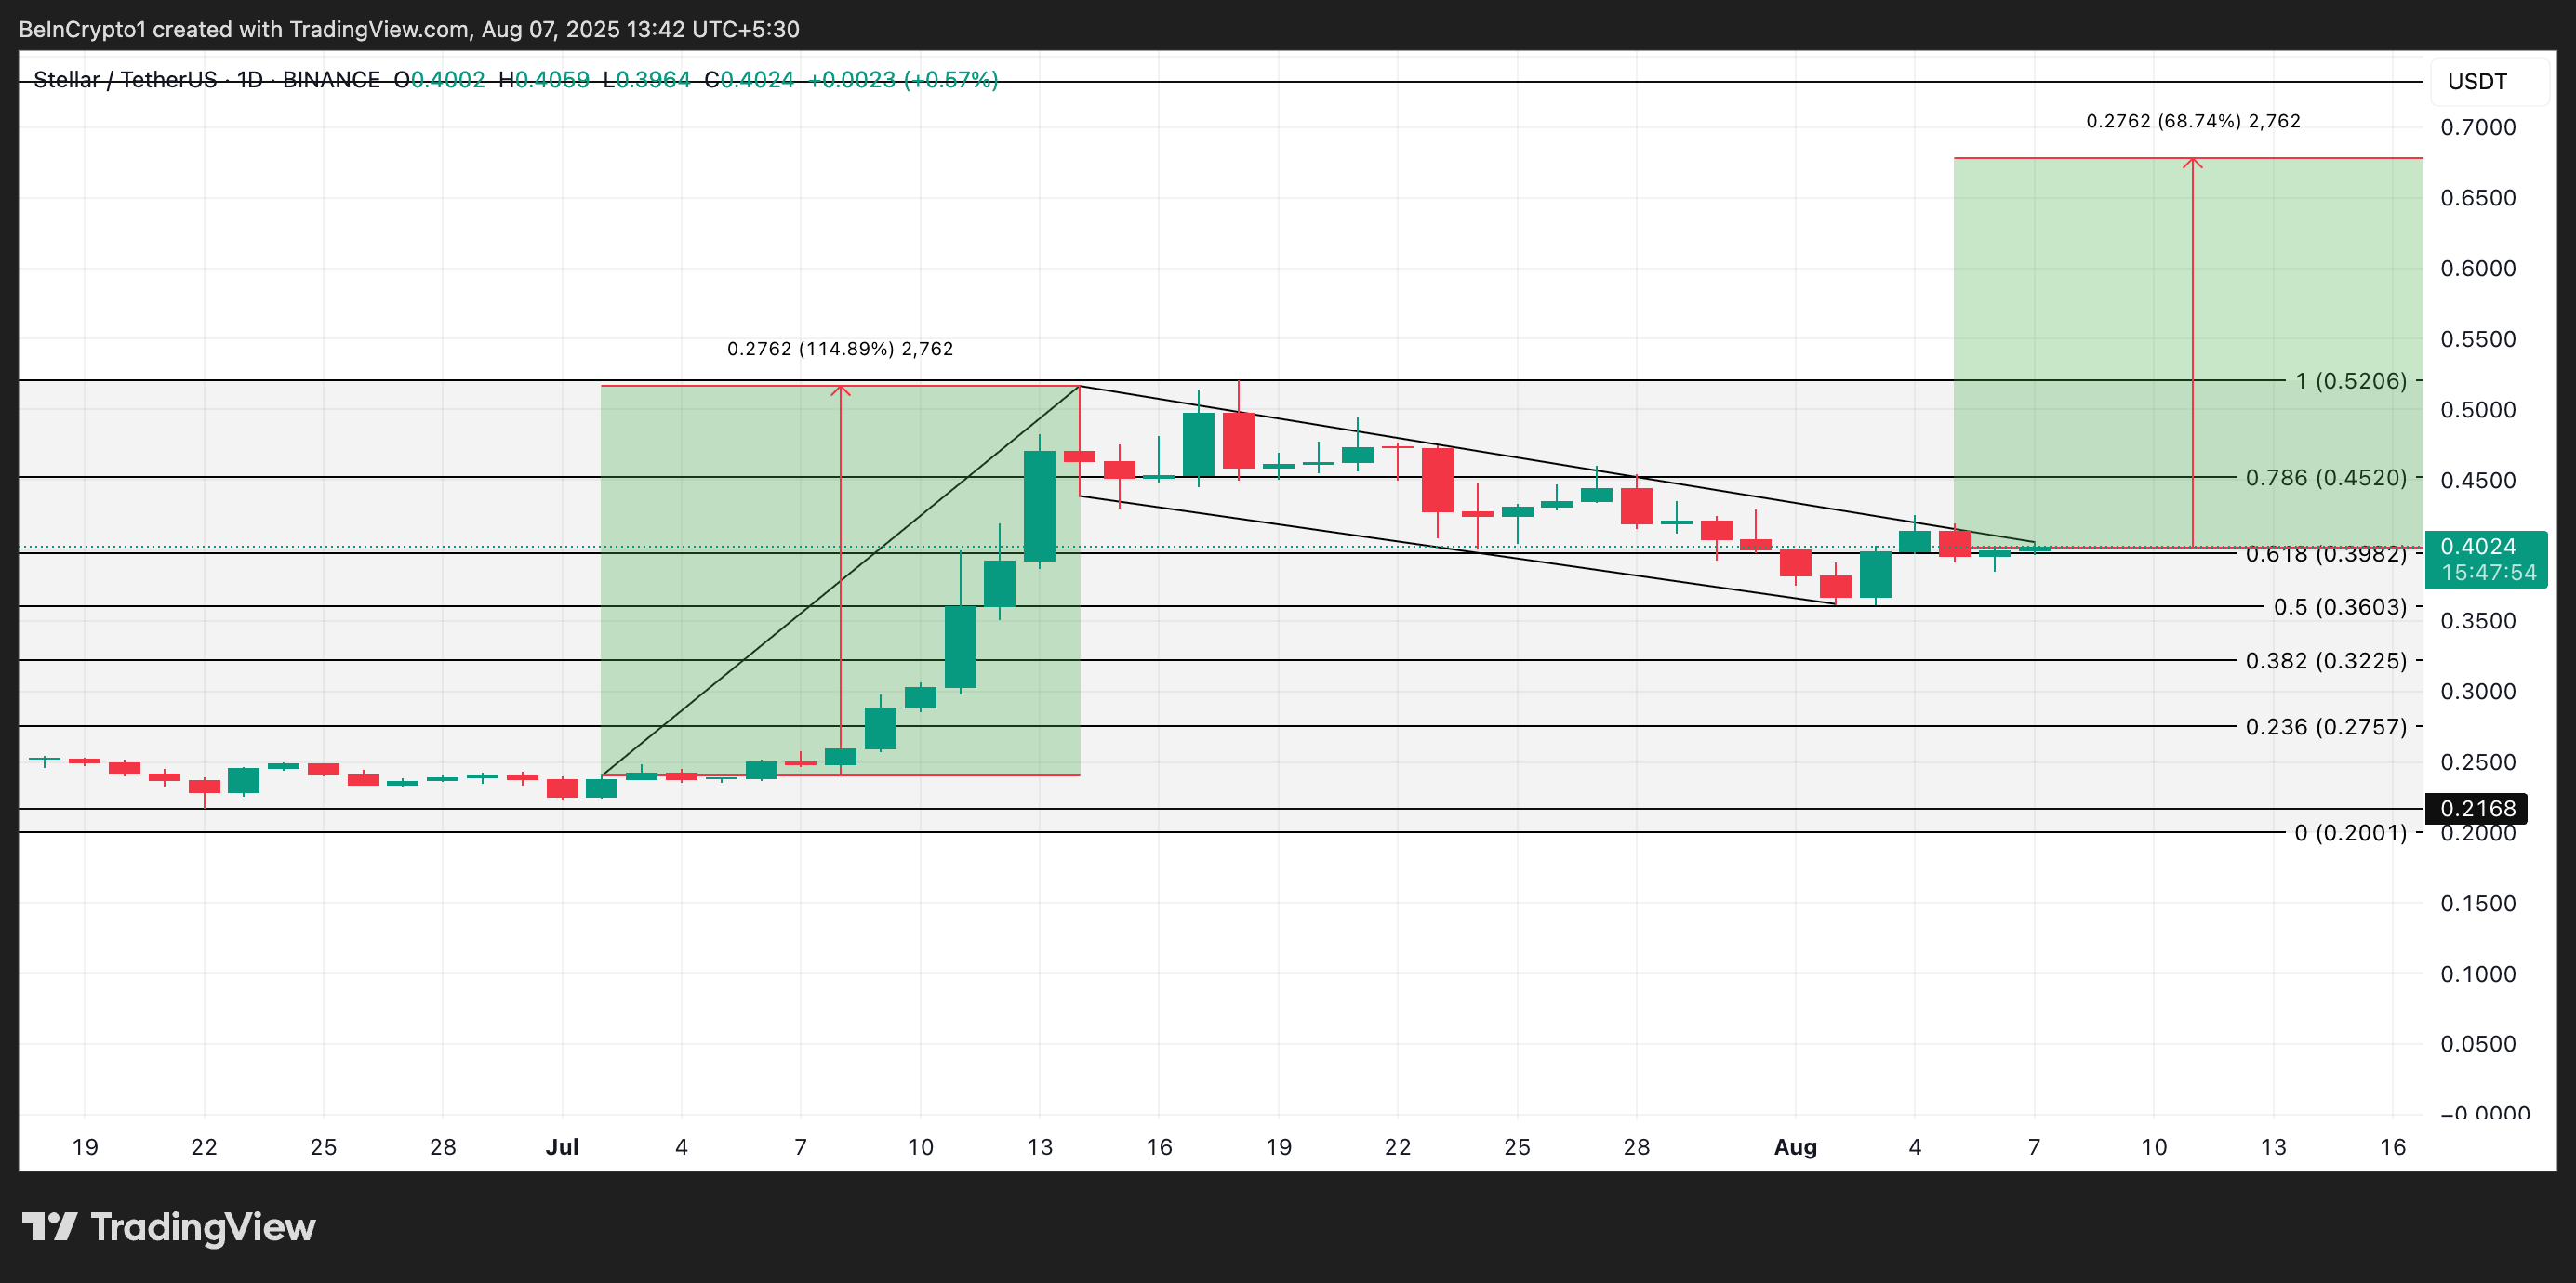
However, if the price fails to hold the breaks below the horizontal consolidation channel, it WOULD invalidate the bullish pattern. In that scenario, downside pressure could increase, dragging XLM below the $0.38 level.
