Bitcoin’s Sideways Stalemate: The Calm Before the Next Explosive Rally?

Bitcoin's price action has flatlined—but don't mistake boredom for stability. When volatility compresses this tight, the breakout tends to be violent.
The Squeeze Before the Spark
With trading volume drying up and Bollinger Bands at their narrowest since the 2023 rally, BTC's coiled spring looks ready to snap. Market makers are playing chicken with liquidity, and retail traders are about to get run over.
Whales vs. Weak Hands
On-chain data shows accumulation patterns mirroring early 2024—right before that 70% pump. Meanwhile, leverage ratios suggest overeager futures traders are setting up for another liquidation cascade. Some things never change.
The Cynic's Corner
Wall Street's latest 'digital asset strategist' will inevitably claim they predicted this move—just like they called the last three corrections and missed every rally. Funny how that works.
When this dam breaks, it won't be a trickle. The only question is which side of the trade you're on when the flood hits.
Short-Term Sellers Are Still Bleeding, But Slowing Down
Every time the Bitcoin price has touched $115,000 or any local top over the past month, short-term holders, those who bought BTC in the last few weeks, have started selling. The spent output age bands show this clearly. On July 22, July 28, and even August 6, Bitcoin tried to push higher, but selling from wallets holding BTC for under a month picked up right at the top.
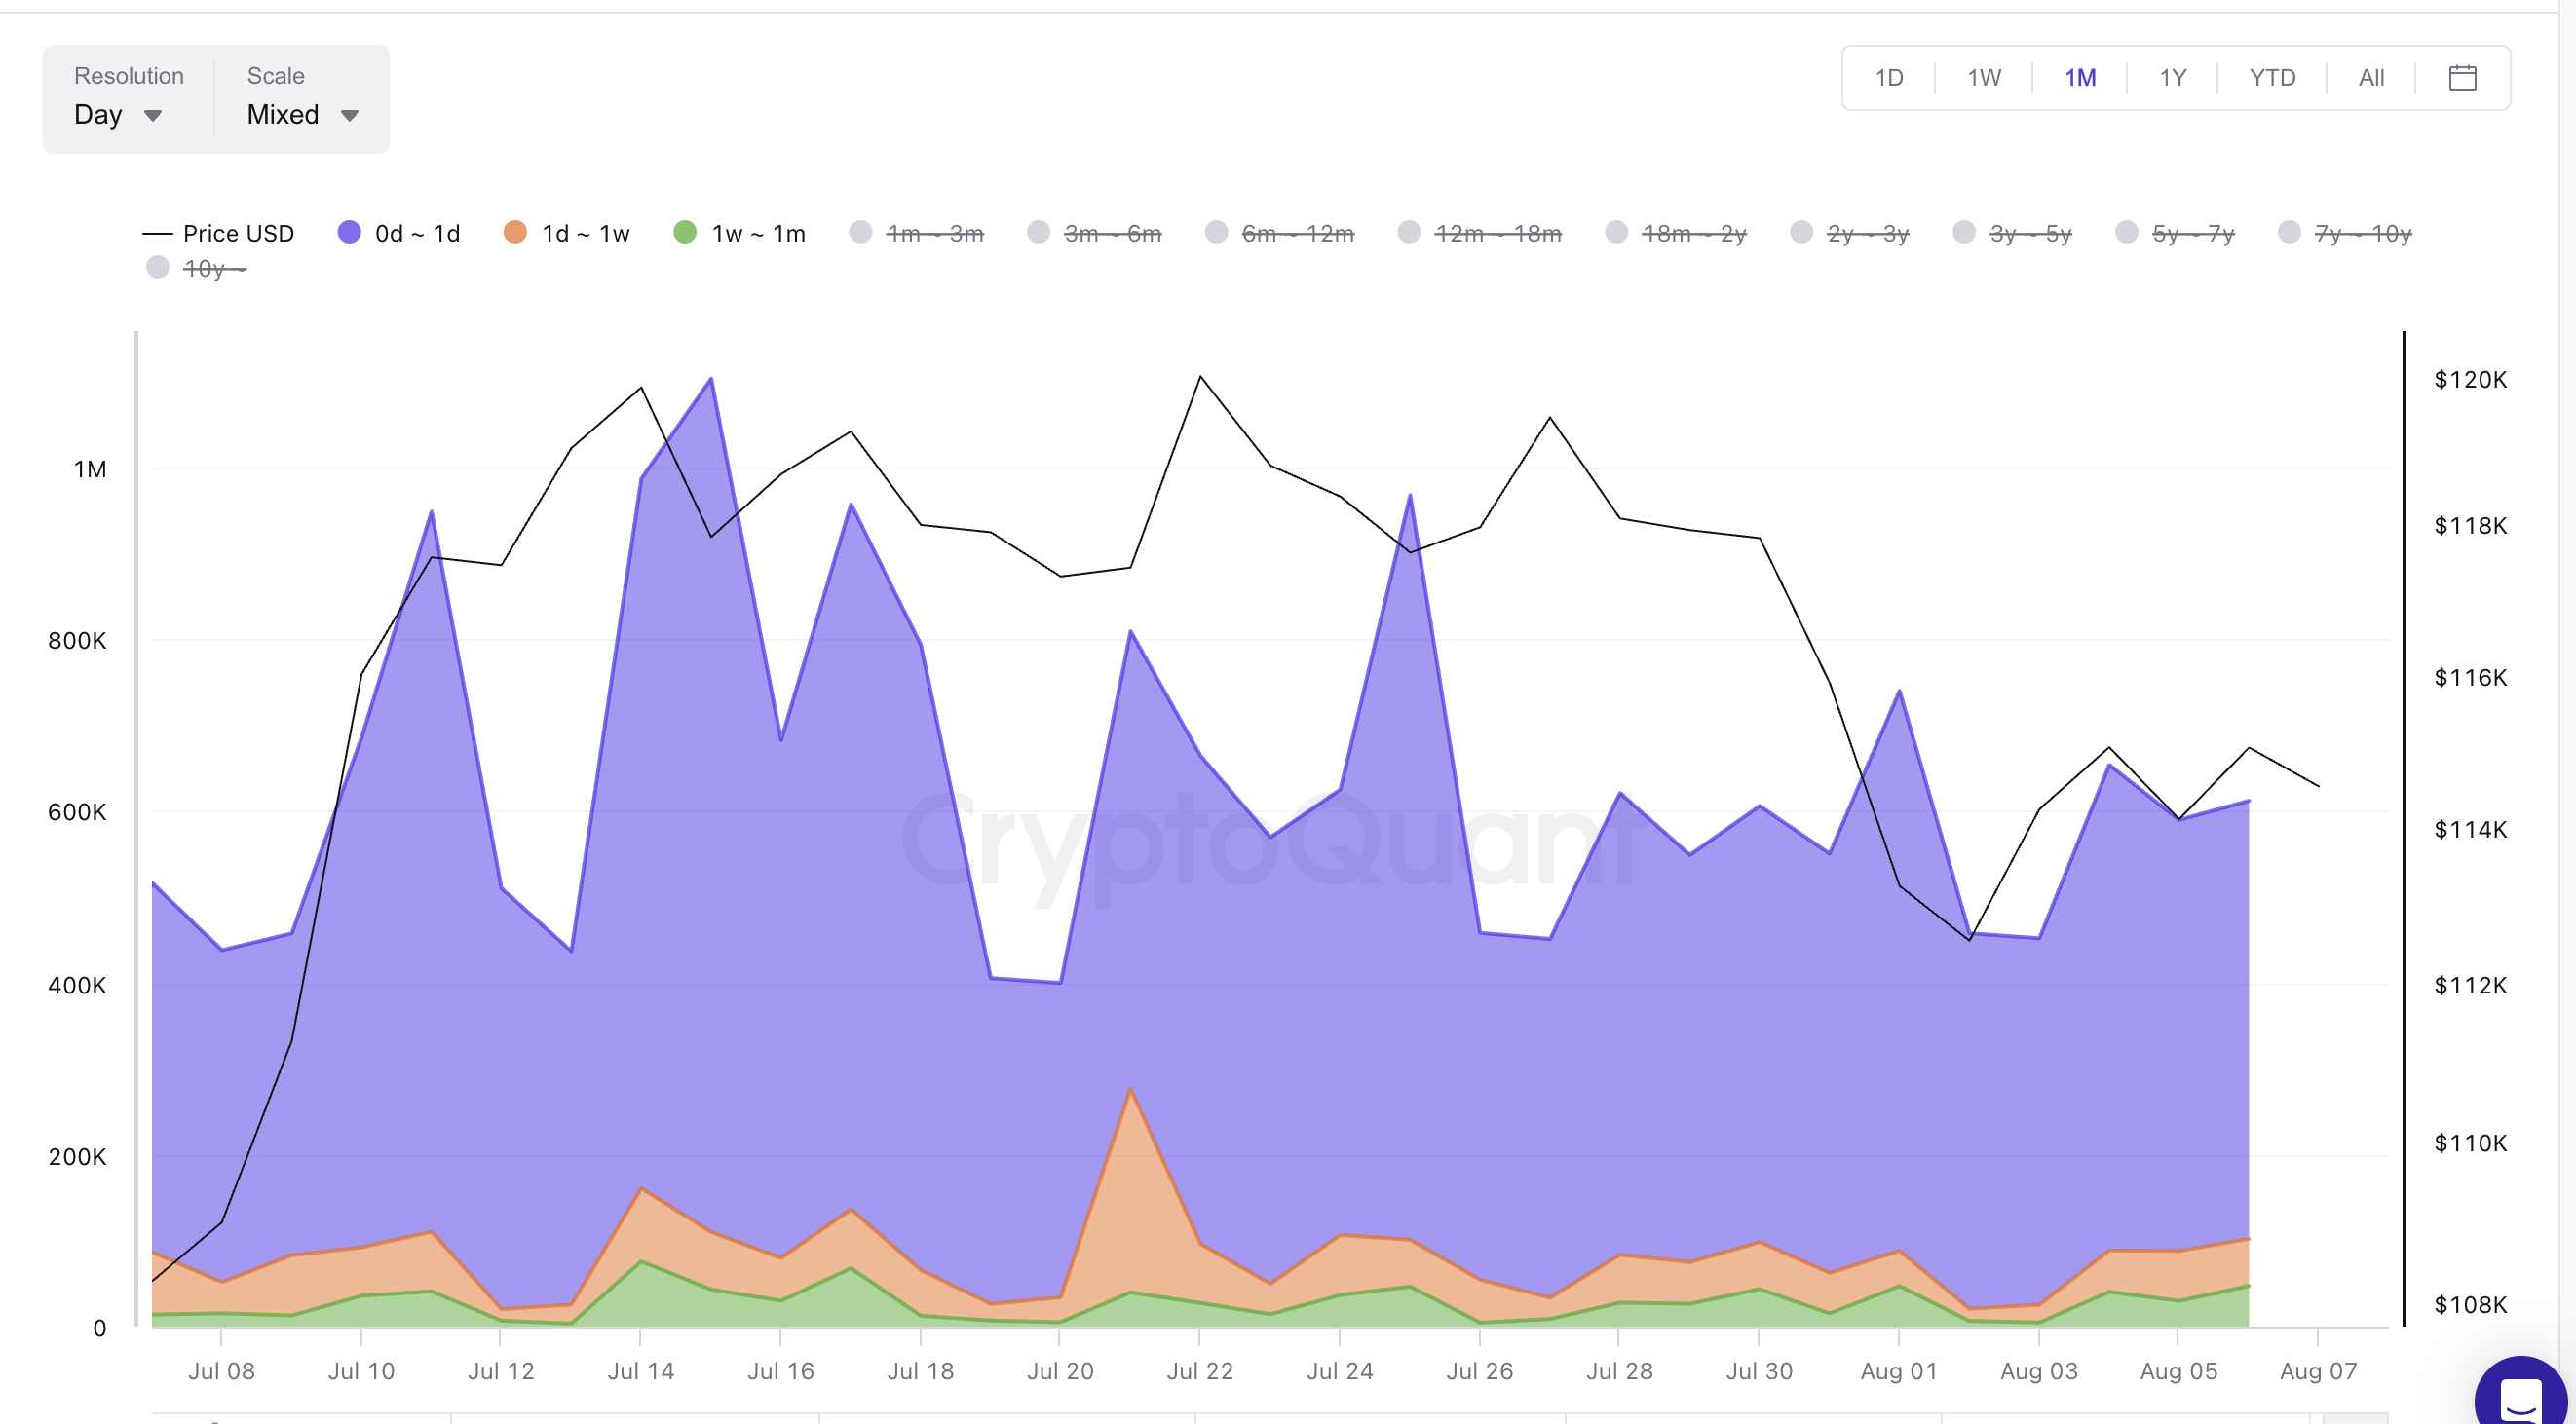
This shows that short-term traders are booking quick profits, causing local tops in the Spent Output metric. But something changed after July 25. These selling spikes are getting weaker. That means short-term traders may be running out of BTC to sell, or getting more confident in holding. If this continues, bitcoin could finally break through resistance.
The Spent Output Age Bands metric tracks coins that were moved (or “spent”) based on how long they were held. High movement from young coins (0–1 day, 1–7 days, 7–30 days) often signals selling pressure.
: Want more token insights like this? Sign up for Editor Harsh Notariya’s Daily crypto Newsletter here.
Bottom Signal from SOPR?
The Spent Output Profit Ratio (SOPR) measures whether BTC holders are selling at a profit or a loss. It usually peaks when people lock in profits at the top, and drops when they sell at a loss, often NEAR bottoms.
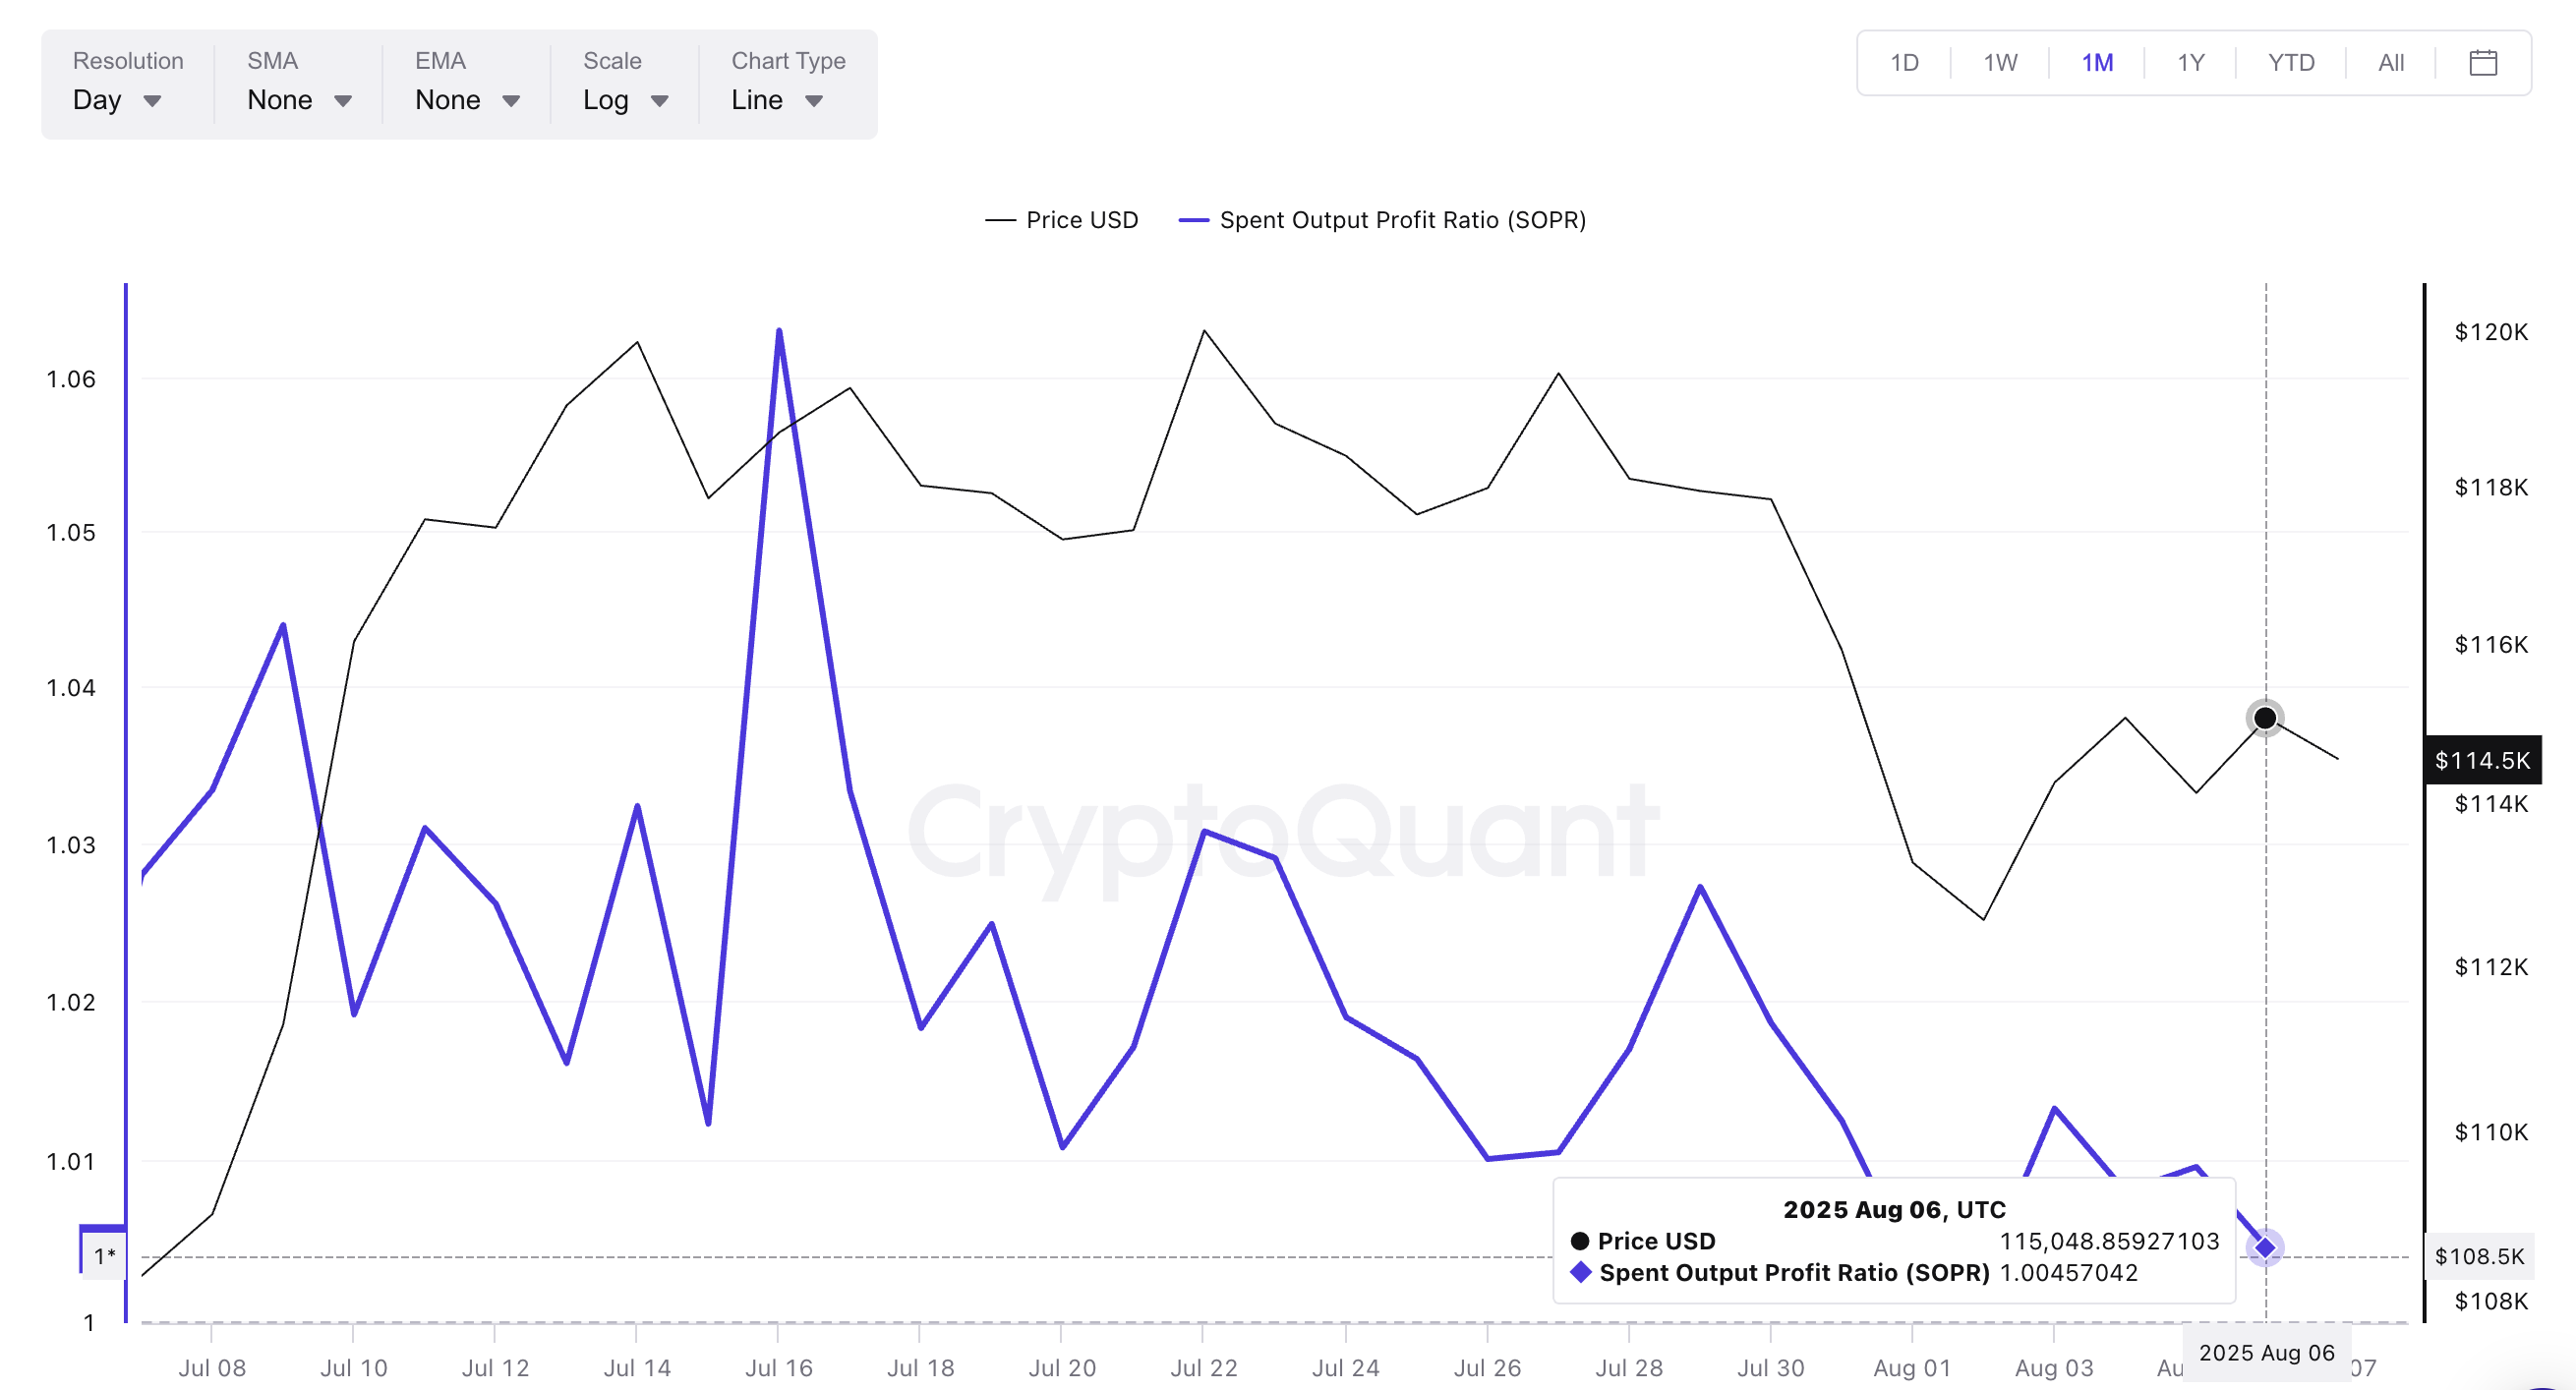
We’ve seen this pattern play out multiple times recently:
- July 16: SOPR hit 1.06, price topped around $118K.
- July 25: SOPR dropped from 1.016 to 1.01, but the Bitcoin price actually rose, showing divergence.
- August 5: SOPR dropped again while the price rose from $114,000 to $115,000.
That means fewer sellers are in profit, and some are likely exiting at a loss. When this happens alongside a stable or rising price, it often points to a market bottom forming.
Bitcoin Price Pattern Still Bullish, Despite Rejections
Even though the bitcoin price keeps failing to break above the resistance zone near $115,000, one important signal shows the trend may still be bullish: the Relative Strength Index (RSI).
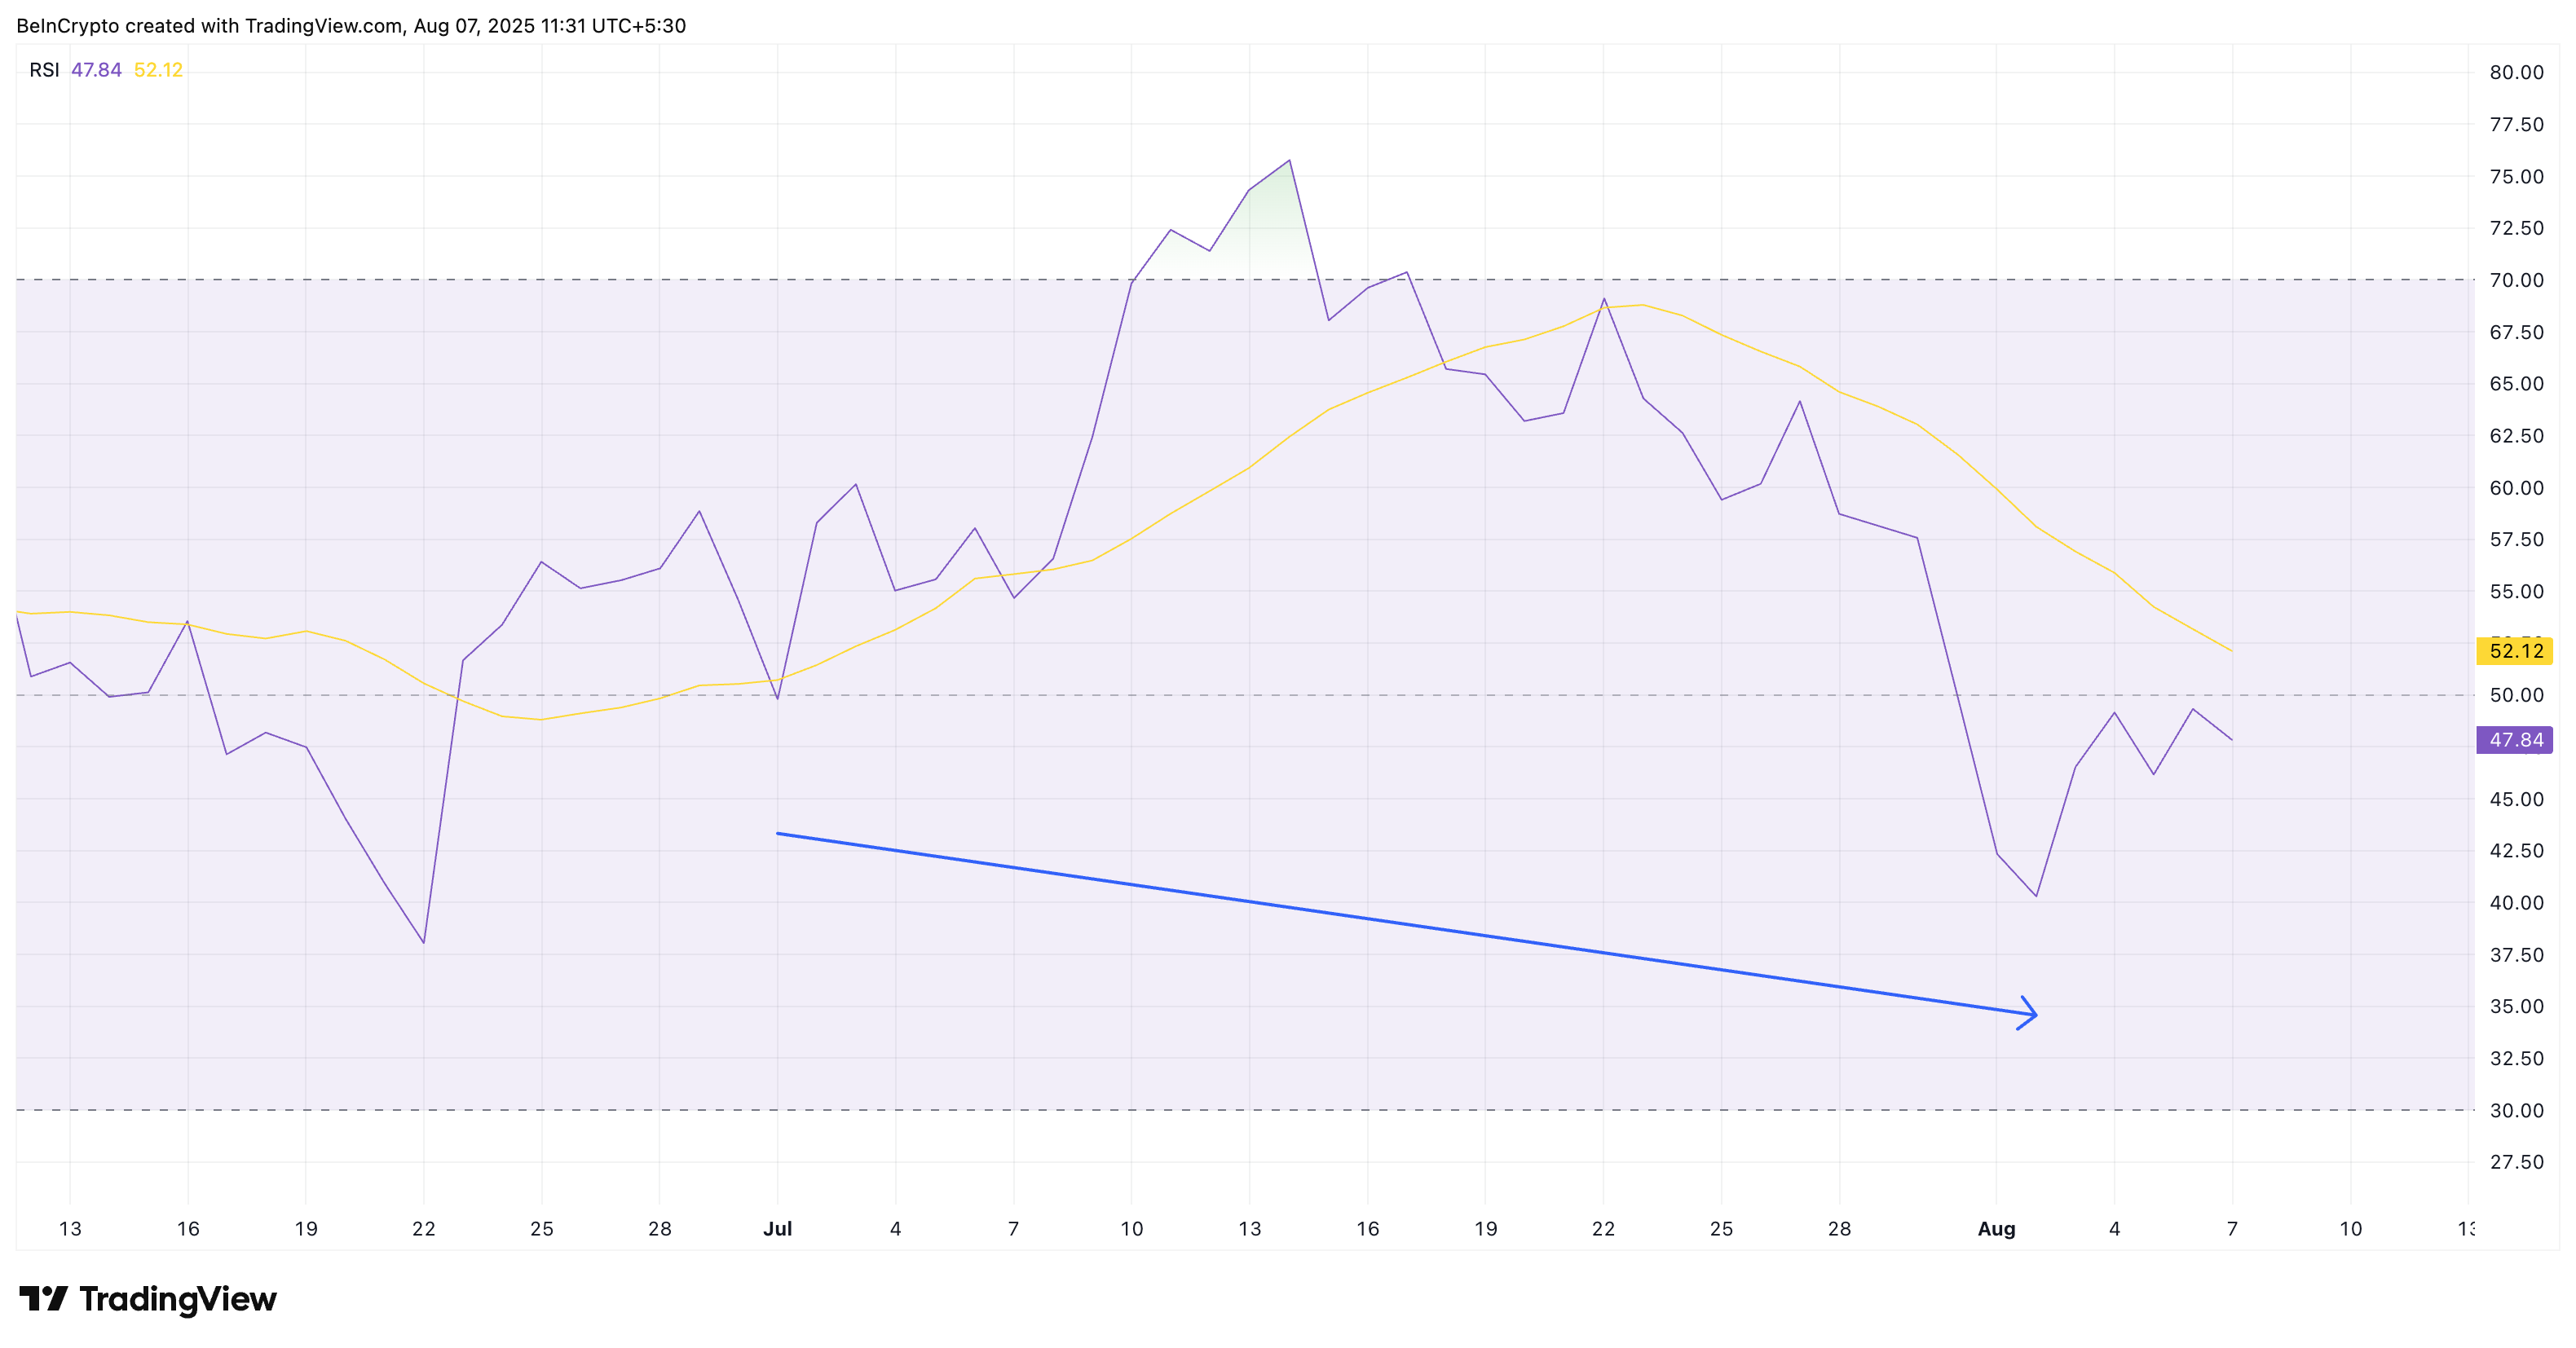
Between July 2 and August 2, Bitcoin formed a higher low, indicating that each subsequent dip was not as DEEP as the one before it —a classic sign of strength in price. However, during the same period, the RSI hit a lower low. This is known as a hidden bullish divergence, indicating that momentum is building quietly, even if the price has not yet risen significantly.
The Relative Strength Index (RSI) measures the strength of recent price moves to spot potential trend shifts.
So, while the price chart appears stuck, the RSI is quietly indicating that buyers are still in control, and that any breakout could have strong legs. This also indicates that the underlying trend remains bullish.
Now pair this with the actual chart pattern. Bitcoin is moving inside a bullish pennant pattern. The key resistance remains $115,000. That’s the line Bitcoin just can’t break. But price has been making higher lows while consolidating under that level.
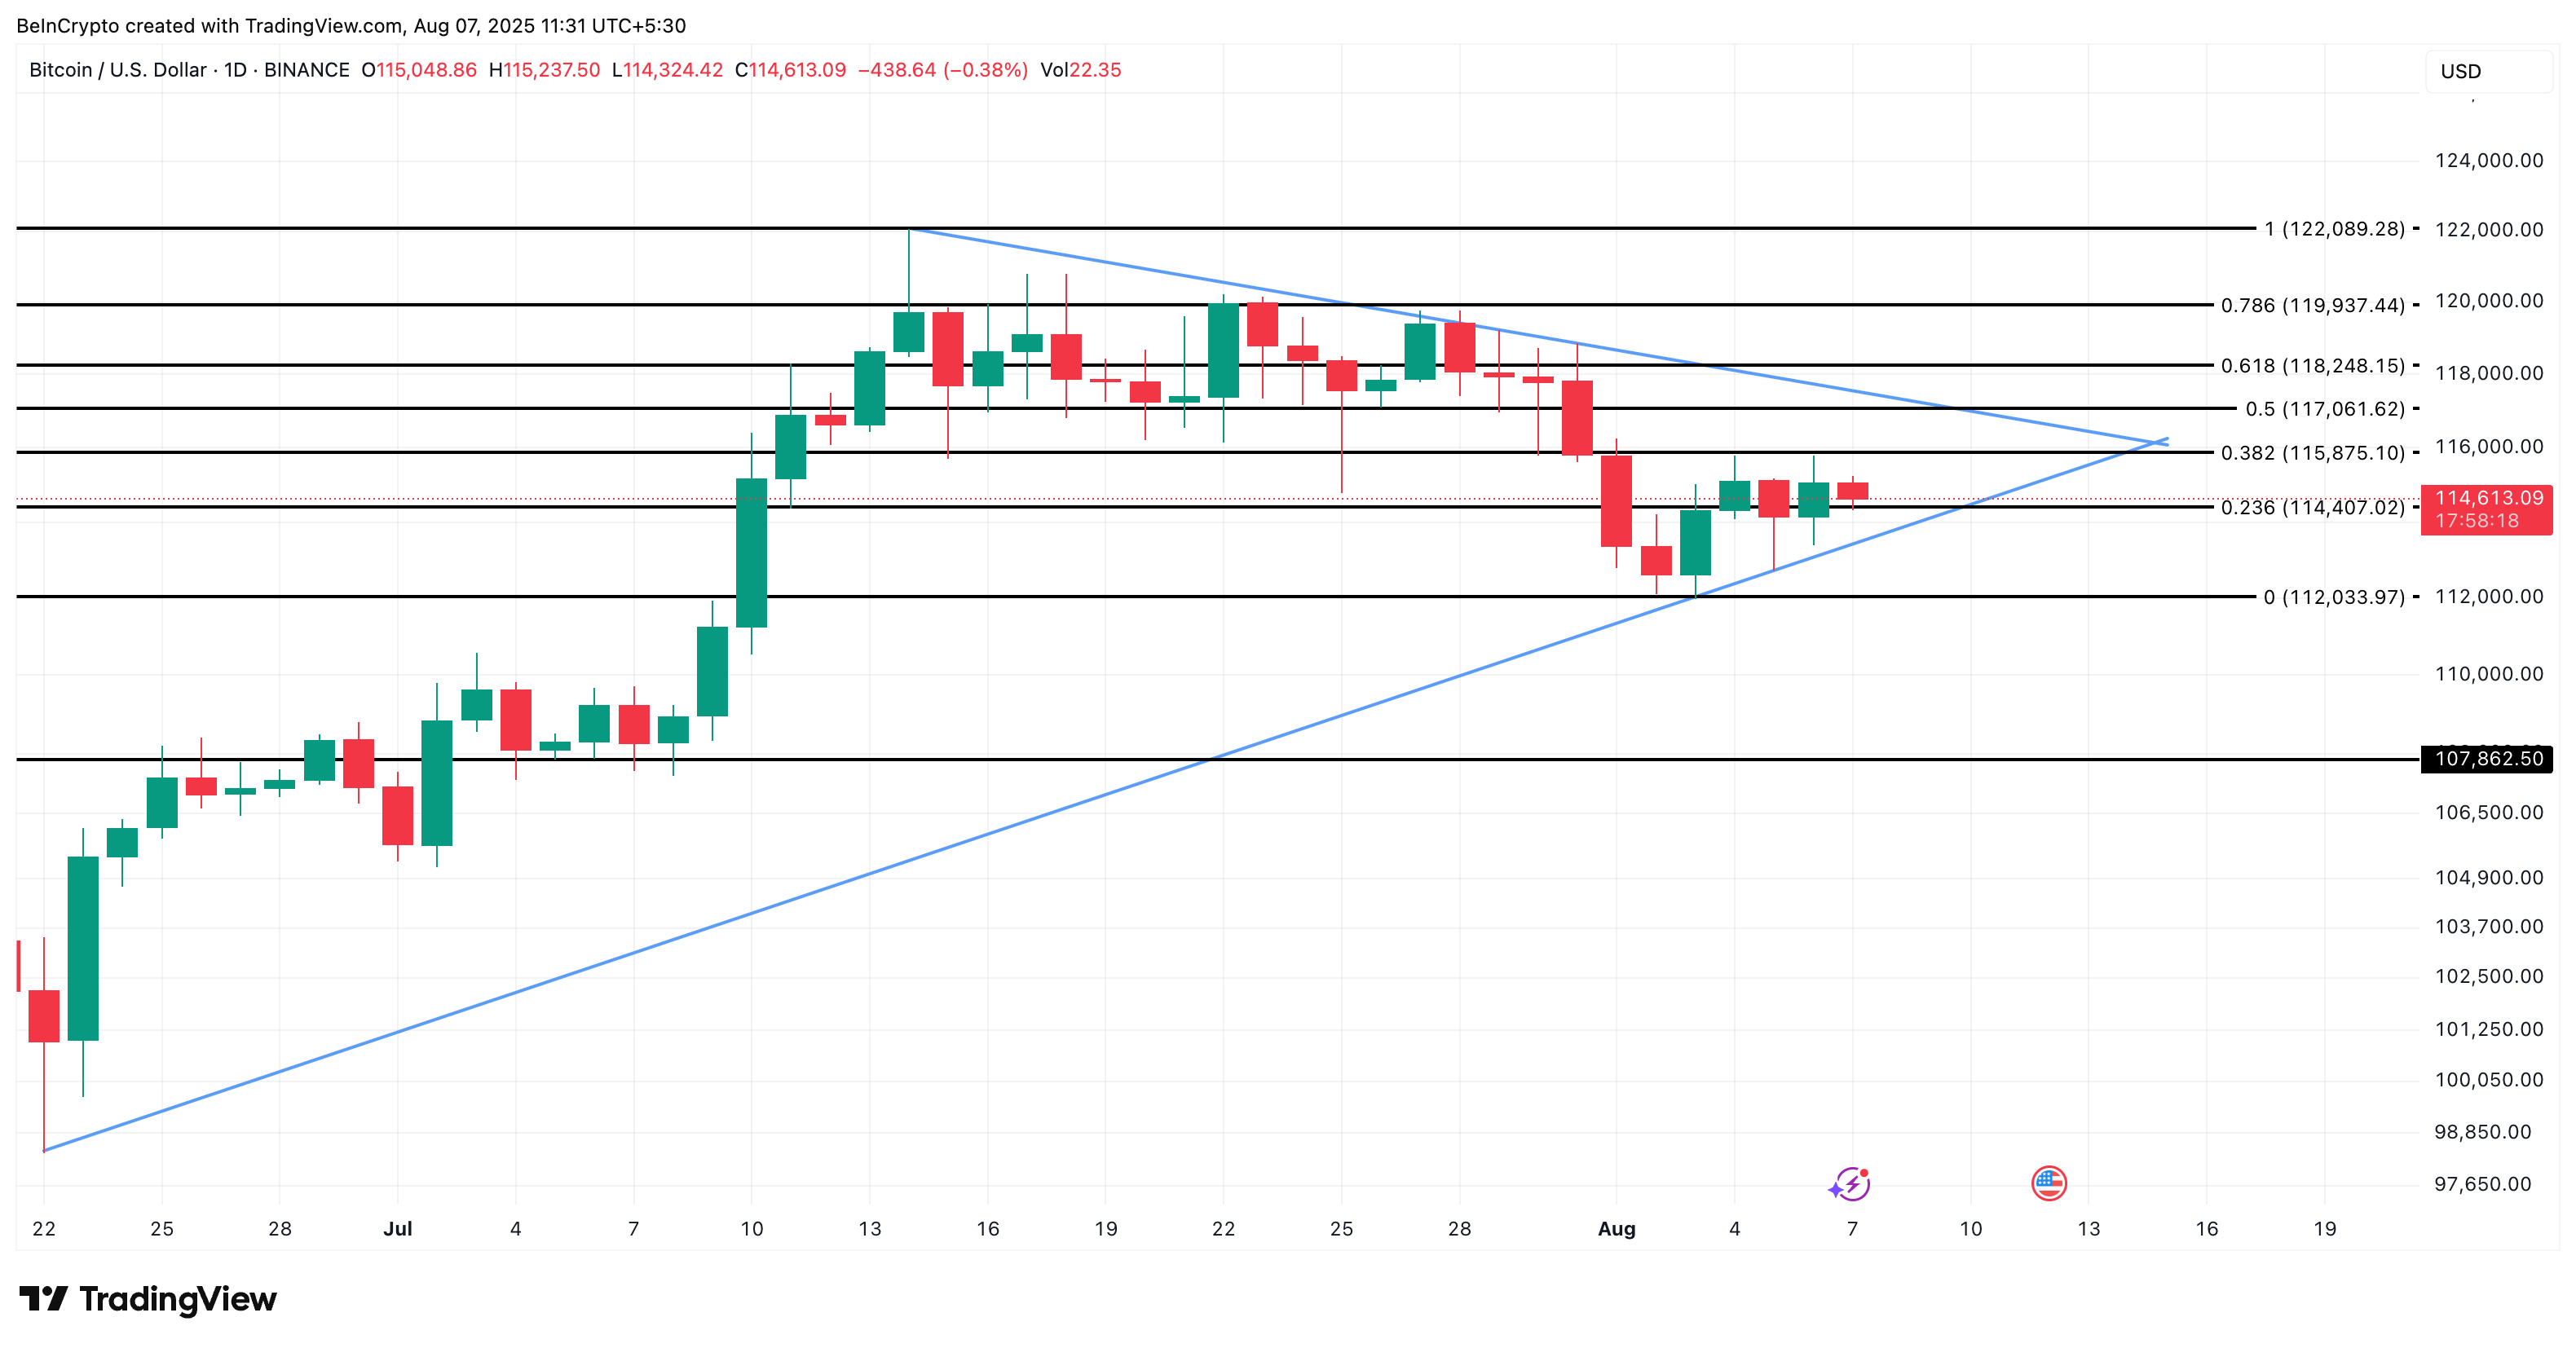
If Bitcoin can close above $117,000 and then $118,000, the breakout may confirm. Invalidation lies below $114,000 and especially under $112,000. A breakdown there could drag BTC to $107,000, but right now, all signs point to short-term strength building up.

Log in to Reply
Log in to comment your thoughtsComments
Related Articles
|Square
Get the BTCC app to start your crypto journey
Get started today Scan to join our 100M+ users